

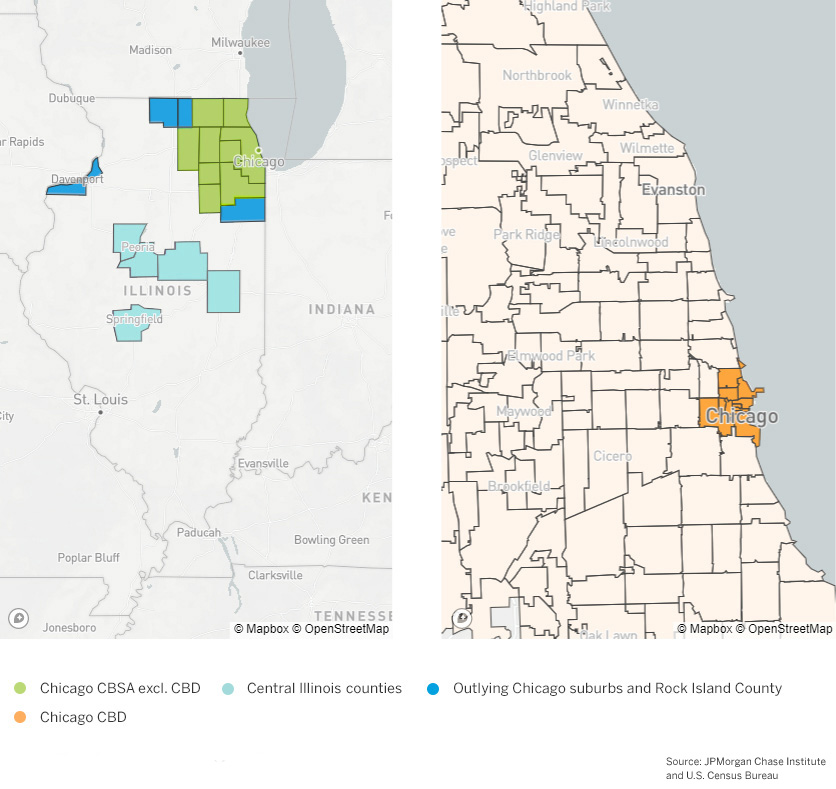
Figure 1: The sample of small businesses in Illinois covers urbanized counties.
Latest news

An Ohio-based company is protecting first responders around the world
With support from JPMorganChase, Fire-Dex is providing protective equipment to firefighters in 100 countries and all 50 states.
Learn moreLatest news

Veteran’s Unconventional Path to Landing her Dream Job in Tech
U.S. Army Veteran Ashley Wigfall transitioned to a civilian role and charted her path to technologist through mentorship and skills training at the JPMorgan Chase tech hub in Plano, Texas.
Learn more
Findings
For small businesses across the country, the onset of the pandemic was an unexpected adverse shock to normal business. The early days of the pandemic were marked by widespread reductions in operations or even temporary closures as businesses abided by the restrictions necessitated by the pandemic and consumers changed their behavior. As the pandemic continued, however, many small businesses adapted.
This brief focuses on the financial outcomes of small businesses in Illinois from March 2020 through February 2021. By analyzing a full year of outcomes during the pandemic, we offer insight into the financial health of small businesses after a protracted period of restrictions. In as much as the firms in this sample all faced the same state restrictions and recommendations, our results shed light on outcomes that are unlikely to be driven by differences in these policies.1 In addition, this perspective may be particularly relevant for state and local decision makers, who can interpret these findings in their geographic context.
Our sample includes small businesses with Chase Business Banking deposit accounts that were operating in the year prior to March 2020. Our sample covers the relatively urban counties near Chicago, Davenport, and in central Illinois in which Chase has a retail branch footprint.2 Notably, small businesses tend to be relatively concentrated in metro areas. Figure 1 shows the locations where the firms in our sample are located. We combine the counties into several groups: the Chicago central business district (CBD), the Chicago CBSA3 excluding the central business district, outlying Chicago suburbs and Rock Island County, and central Illinois counties. Within the Chicago CBSA, we analyze small business finances at the ZIP code level by neighborhood characteristics derived from U.S. Census Bureau American Community Survey data, excluding the Chicago CBD centered around the Loop.
Figure 1: The sample of small businesses in Illinois covers urbanized counties.
We previously showed the revenue and expense growth trajectories of small businesses through September 2020 (Farrell et al. 2020). This analysis uses a full 12 months of financial data, which captures a cumulative view of small business finances during a period in which some may have closed temporarily and reopened, provides an estimate as to whether the recovery in later months was sufficient to offset the steep declines in the initial weeks, and addresses issues of seasonality that may be present for some businesses. In addition, COVID-19 vaccines became more widely available in Illinois in early 2021,4 so the 12 months ending in February 2021 is a year in which pandemic precautions were applicable to most.
We find that over the course of the year, small businesses adapted but their revenues have not fully recovered, although their cash balances are elevated relative to pre-pandemic levels. We found:
As COVID-19 vaccination rates rise and restrictions are lifted, small businesses will continue to recuperate. Our analyses provides insight into the industries and locations which have been more severely impacted by the pandemic and may need support not only to recover from the past year’s losses but also to rebuild deliberately, allowing for future resilience as well as opportunities for growth.
Median expenses declined by a greater degree than median revenues during the COVID-19 pandemic. The largest declines were in Chicago’s central business district and in central Illinois.
During the weeks following the national emergency declaration on March 13, 2020, revenues declined sharply as stay-at-home orders were issued. Small business revenues initially declined ahead of expenses, but expenses declined more than revenues by the end of April 2020 (Farrell, Wheat and Mac 2020a). This suggests that over time, firms were able to adapt and manage their expenditures to match reduced revenues. While this adaptation may have helped firms mitigate losses, it is unclear whether the reduction in expenses represented deferred expenditures, which would have implications for future operations. Moreover, their suppliers may also be small businesses relying on those expenditures as their revenue.
In the year following the onset of the pandemic, many small businesses have operated with restrictions or changes in their business models. Measuring their revenues and expenses during this pandemic year5 relative to the prior year6 as the baseline provides an estimate of how small businesses adapted over the course of the year. In Illinois, typical expenses for the year declined by more than revenues. As shown in Figure 2, median revenues fell by just over 5 percent while median expenses fell by about 8 percent. Over a year-long period of severe disruption, firms in Illinois were largely able to keep declines in revenues above declines in expenses.
Figure 2: In Illinois, median expenses declined by more than median revenues during the pandemic year, while median balances remain higher than they were pre-pandemic
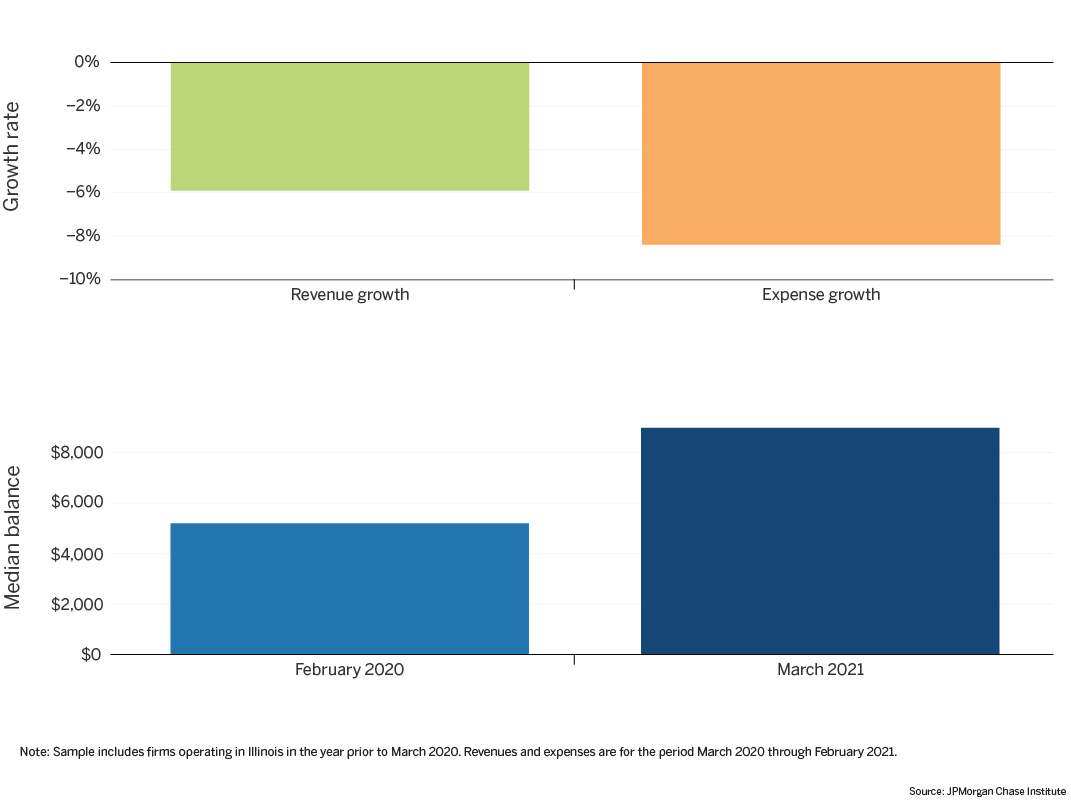
Despite lower revenues over the course of a year, the median balance of small businesses in Illinois was materially higher in March 2021 than in February 2020, the last month prior to the onset of the pandemic. These increases may have been due in part to reductions in expenses greater than reductions in revenue. In addition, previous research suggested that the sharp increases many firms saw in their balances were likely also driven by the disbursement of funds through small business assistance programs such as the Paycheck Protection Program (PPP) and Economic Injury Disaster Loans (EIDL) (Farrell, Wheat and Mac 2020c). The Census Bureau’s Small Business Pulse Survey has also reported an increasing incidence of firms with more cash on hand during the pandemic.7
Figure 3: Small businesses in Chicago’s central business district and central Illinois had lower revenue and expense growth than typical small businesses elsewhere in the state
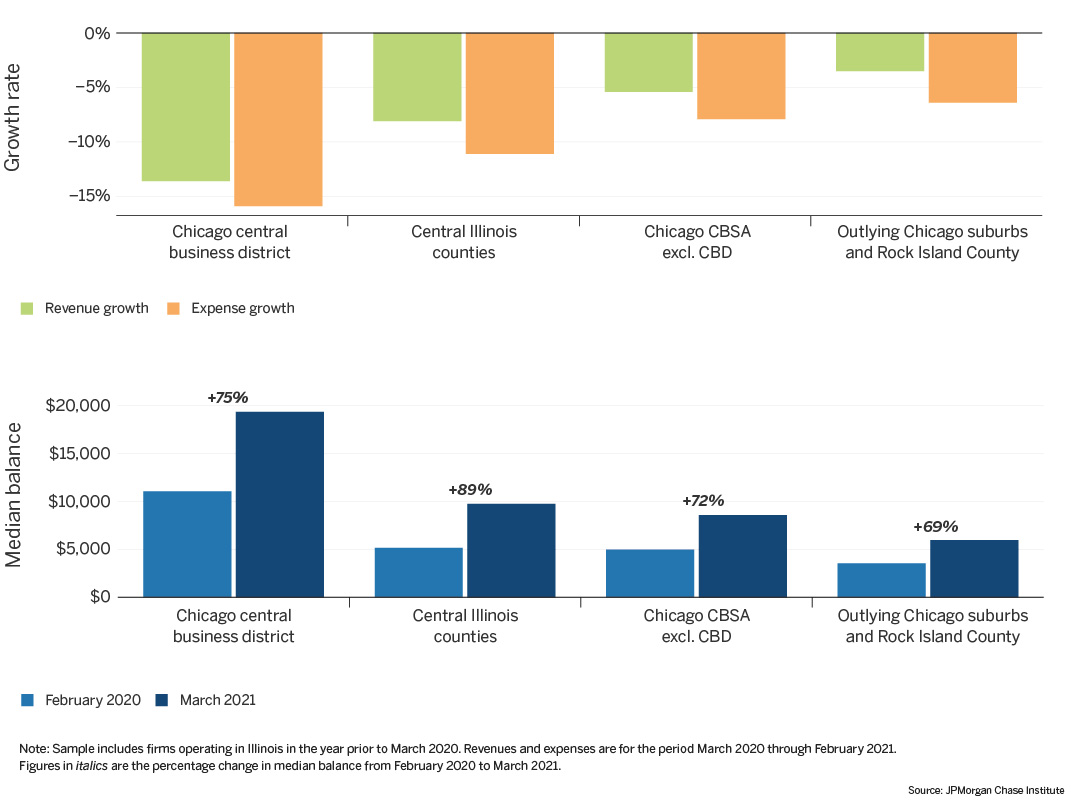
Figure 3 shows how small businesses fared differently among the urban regions of Illinois. Firms in Chicago’s central business district experienced the greatest declines in revenues and expenses. This is perhaps unsurprising given changes in commuting patterns as workplaces transitioned to partial or even full remote work models. However, the median balance among firms in the central business district was also higher than those in the other areas. Businesses with higher expenses likely need larger cash balances.
The typical small businesses in central Illinois—counties near Peoria, Springfield, and Champaign-Urbana—also experienced relatively large revenue and expense decreases of 8 and 11 percent respectively. Balances in these counties were slightly higher than the balances elsewhere in the state in March 2021. Notably, median balances in central Illinois grew the most in percentage terms compared to any other location. A potential contributing factor behind this trend may been a combination of a greater share of firms in central Illinois leveraging small business aid programs and the inflows of said programs may have been large relative to pre-COVID balance levels.
Residents changed the way they lived during the pandemic, and small businesses adapted by decreasing expenditures commensurately with reduced revenues. However, small businesses saw differential effects by location, perhaps due to their exposure to commuters or tourists. Industry mix may also be a factor, and we analyze effects by industry in the next section. Moreover, changes to revenues and expenses are not the only measure of financial health during this period. Some areas with more severe declines in revenues also experienced large increases in balances, perhaps reflecting past small business relief programs.
Small personal services firms were the most impacted and were especially hard hit in the Chicago CBSA
The pandemic had differential impact on small businesses by industry. Firms may have faced pandemic-related regulations about how or when they could operate, lower customer demand, or a combination of both. Figure 4 shows median revenue and expense growth across industries during the pandemic. Median revenues for restaurants and personal service firms declined sharply relative to the prior year. Notably, both industries are highly dependent on in-person interaction, a likely contributing factor to their larger declines.
Figure 4: Personal service firms experienced the largest revenue declines during the pandemic and had the lowest median balances in March 2021
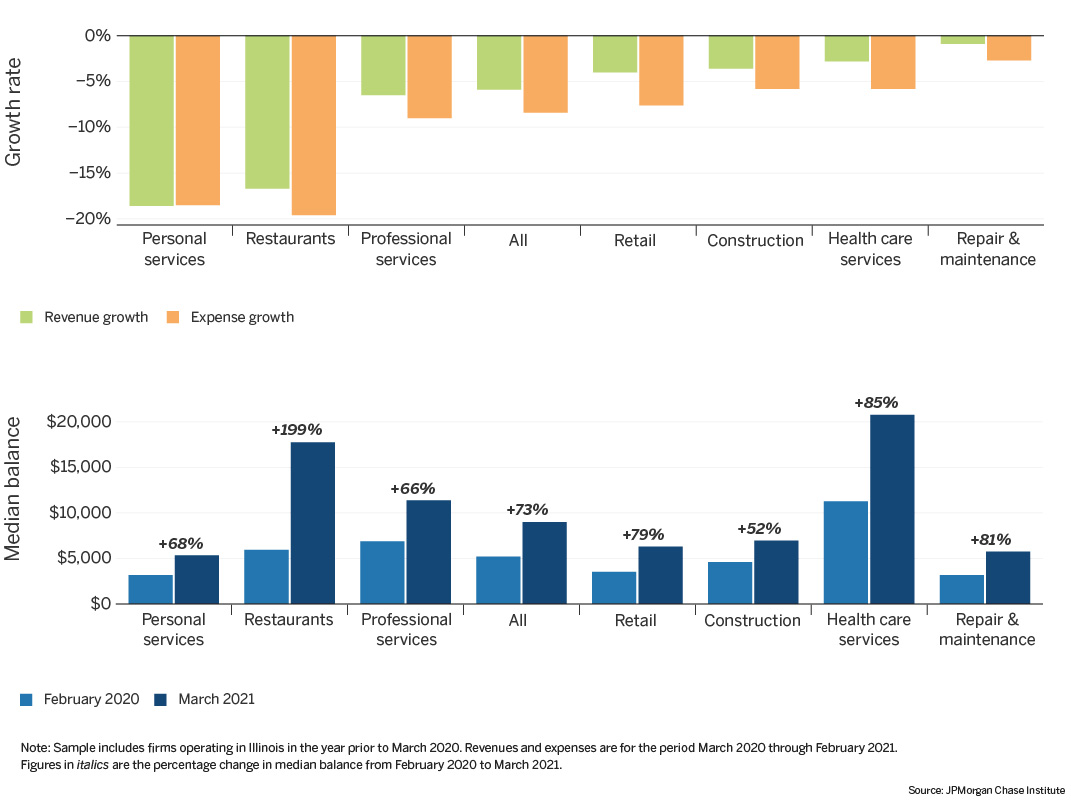
As illustrated in the above analyses, small businesses can mitigate revenue losses by limiting expenditures. The first panel of Figure 4 also shows that in most industries, expenses declined by a larger magnitude than revenues, which may have helped firms manage their cash flows. However, one industry stands as an exception – personal services, where median revenue declines outpaced declines in expenses. As is the case with restaurants, a large swath of the personal services industry relies on in-person interaction. However, owners of personal services firms may have had greater difficulty adapting their services than restaurant owners did. On the revenue side, it is possible that many personal service firms saw vastly diminished customer bases. In the initial months after the national emergency declaration, a noticeable gap between revenue and expense declines was more evident in personal services than in other industries (Farrell, Wheat and Mac 2020c). However, that persisting gap suggests that personal service firms did not fully adjust expenditures over the course of the year to reflect lower revenues.
There is additional reason to be concerned about personal service firms beyond their generally worse outcomes. For one, they carry lower balances in comparison to firms in many other industries. Firms may use their balances as a form of precautionary savings in times of financial distress, and to the extent that personal service firms carry lower balances, they may be less able to withstand adverse shocks. Moreover, Black and Latinx-owned firms and women-owned firms are overrepresented in the personal services industry, and these groups face challenges of lower revenues, profit margins, and cash liquidity (McManus 2016; Farrell, Wheat and Mac 2019, 2020b).
Figure 5: Median revenue and expense growth rates, by industry and location
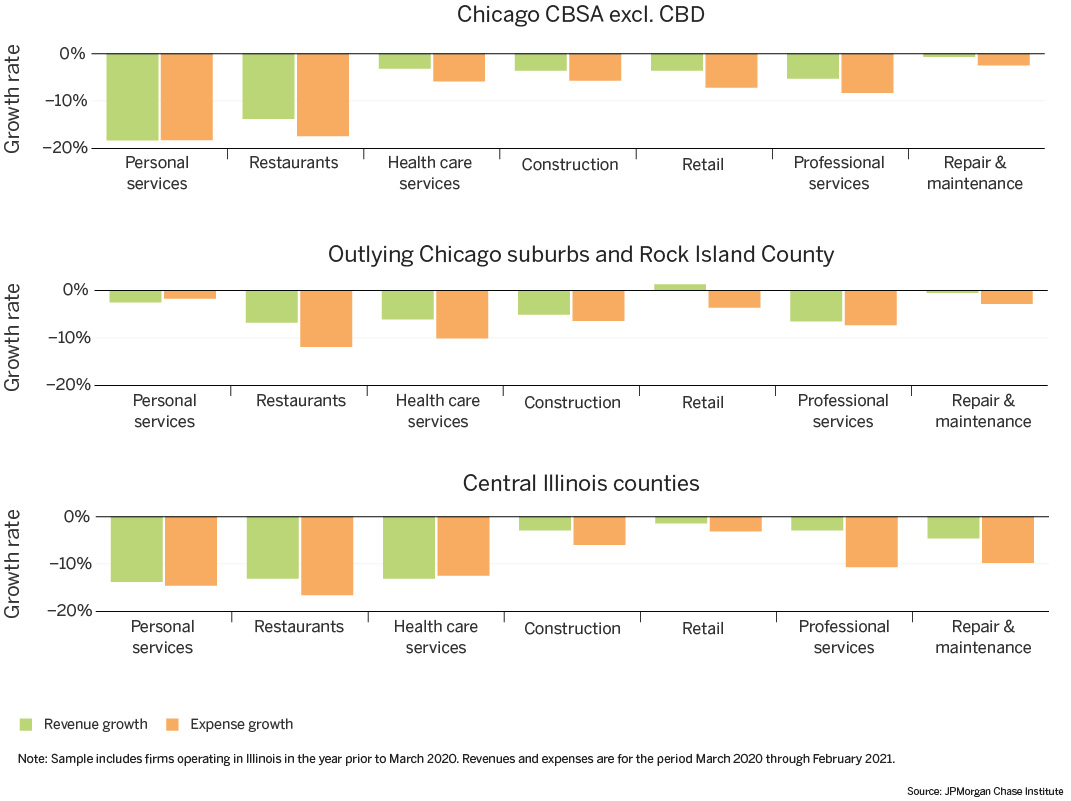
Figure 5 displays median revenue and expense growth by industry and location. Again, we note that the magnitude of the declines in revenues and expenses provide an estimate of the severity of the impact of the pandemic on a given industry, while the difference between revenue and expense growth measures the degree to which firms were able to reduce expenses to reflect lower revenues. Within certain industries, like personal services, the difference between median revenue growth and median expense growth is relatively small. For other industries, like retail, there is more variation in outcome depending upon firm location; with small retailers in the CBSA and central Illinois experiencing a 4 percent and 1 percent decline in revenues, respectively, while small retailers in the outlying Chicago suburbs and Rock Island County actually saw a 1 percent increase in their revenues.
Firms located in lower-income and more racially diverse neighborhoods were less profitable.
While regional differences in small business financial outcomes can be large, neighborhood-level differences within cities can be even larger (Farrell, Wheat and Grandet 2019). To that end, we examined variation in small business financial outcomes during the pandemic between neighborhoods within the Chicago CBSA outside of the central business district.8 Building on the results from the prior analyses in which we observed differences in the extent to which some firms were able to reduce expenses to mitigate revenue losses, we focus on revenue-expense ratios in these neighborhood-level analyses. The revenue-expense ratio provides a measure of whether a firm was able to cover its expenses from its revenue proceeds during the year. We find that firms located in lower-income or more racially diverse neighborhoods generate less revenue for every dollar in expense. This pattern was evident before the pandemic as well (Farrell, Wheat and Grandet 2019).
Figure 6: Distribution of revenue-expense ratios, by neighborhood income
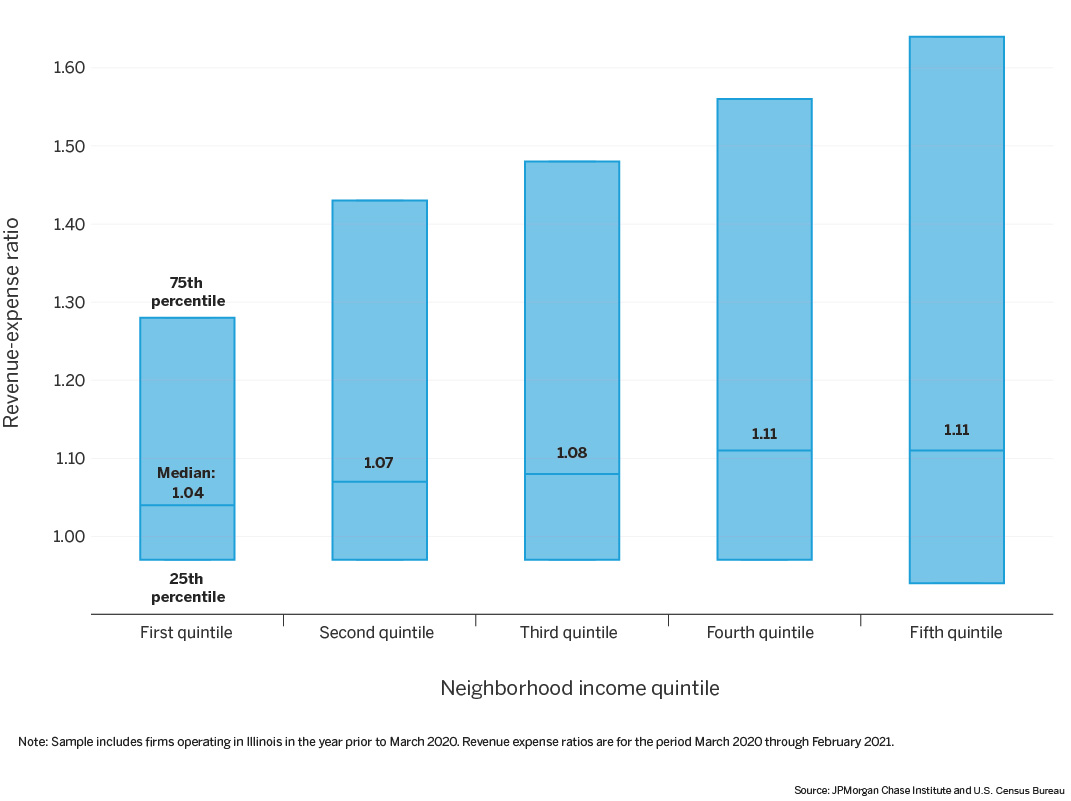
Figure 6 shows that during the pandemic, the typical firm located in lower-income (first quintile) neighborhoods earned about $1.04 in revenue for every dollar spent in expenses, while the typical firm in higher-income neighborhoods (fifth quintile) earned about $1.11 in revenue for every dollar spent in expenses. Moreover, the differences were starker for firms at the upper end of the distribution. At the 75th percentile, a firm in a lower-income neighborhood generated about $1.28 for every dollar in expenses while the 75th percentile firm in a higher-income neighborhood generated about $1.64.
Figure 7: Distribution of revenue-expense ratios, by neighborhood racial composition
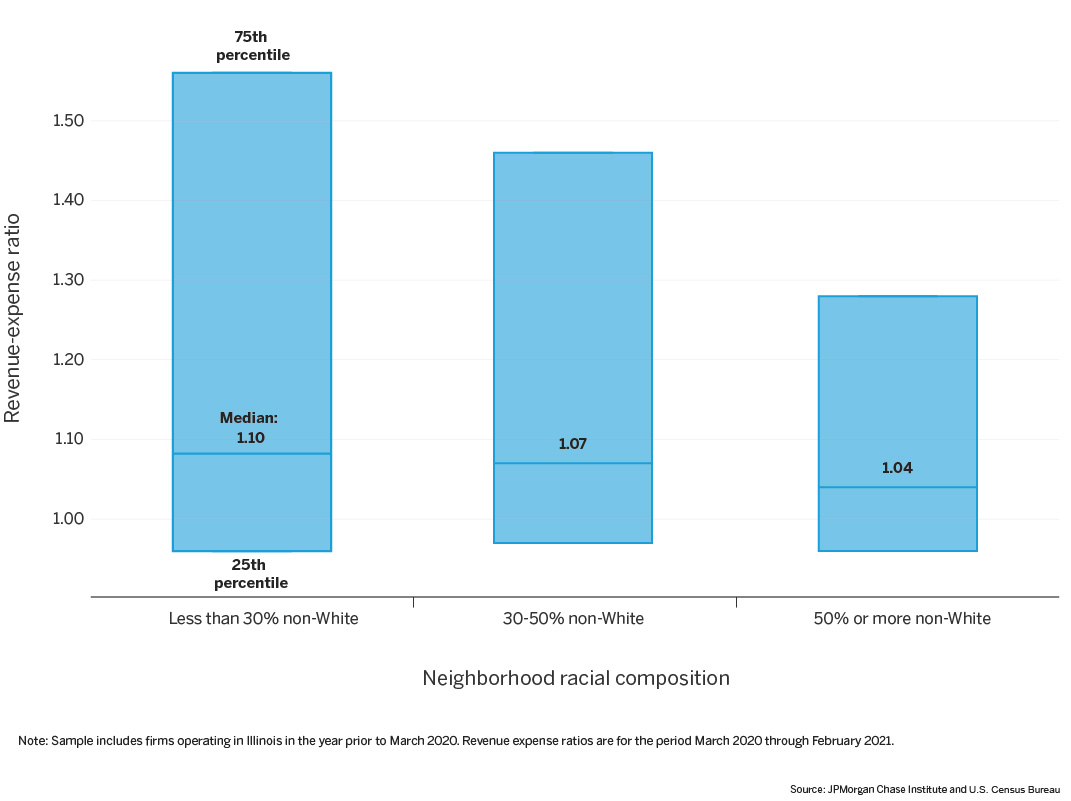
Figure 7 shows the distribution of revenue-expense ratios by the racial composition of neighborhoods. In neighborhoods where less than 30 percent of residents are non-White,9 the typical firm generated $1.10 in revenue for every dollar of expense, compared to $1.04 in neighborhoods where at least 50 percent of residents are non-White. The wider distribution of revenue-expense ratios in neighborhoods with fewer non-White residents suggests that profitable businesses there earned more than their counterparts in more diverse neighborhoods. For example, a firm at the 75th percentile of a neighborhood where less than 30 percent of residents are non-White earned $1.56 for each dollar of expense, compared to $1.28 in a neighborhood where the majority of residents are non-White.
During the pandemic, small businesses were often able to reduce expenses to reflect the reduction in revenues. The distribution of revenue-expense ratios illustrates the degree to which firms were able to do so. Higher ratios imply higher profitability, and the higher revenue-expense ratios at the 75th percentile in higher-income and majority-White neighborhoods suggest larger shares of the more profitable small businesses. This pattern was evident before the pandemic as well (Farrell, Wheat and Grandet 2019), and it is important context in understanding systemic factors that contribute to how small businesses have weathered the pandemic and the resources they have to draw upon in rebuilding their businesses.
Using administrative bank data, we provide a view of small business financial outcomes in Illinois during the pandemic. Policies and programs providing relief to affected small businesses or support as they rebuild can use this research to target sectors that have been more adversely affected by the public health emergency. With these objectives in mind, we offer the following implications for leaders and decision makers:
We thank Sruthi Rao for her support. We are indebted to our internal partners and colleagues, who support delivery of our agenda in a myriad of ways and acknowledge their contributions to each and all releases.
We are also grateful for the invaluable constructive feedback we received from our external partner Brad McConnell. We are deeply grateful for his generosity of time, insight, and support.
We would like to acknowledge Jamie Dimon, CEO of JPMorgan Chase & Co., for his vision and leadership in establishing the Institute and enabling the ongoing research agenda. We remain deeply grateful to Peter Scher, Vice Chairman, Heather Higginbottom, President of the JPMC PolicyCenter, and others across the firm for the resources and support to pioneer a new approach to contribute to global economic analysis and insight.
Farrell, Diana, Chris Wheat, and Carlos Grandet. 2019. “Place Matters: Small Business Financial Health in Urban Communities.” JPMorgan Chase Institute.
Farrell, Diana, Chris Wheat, and Chi Mac. 2019. “Gender, Age, and Small Business Financial Outcomes.” JPMorgan Chase Institute.
Farrell, Diana, Chris Wheat, and Chi Mac. 2020a. “Small Business Financial Outcomes during the Onset of COVID-19.” JPMorgan Chase Institute.
Farrell, Diana, Chris Wheat, and Chi Mac. 2020b. “Small Business Owner Race, Liquidity, and Survival.” JPMorgan Chase Institute.
Farrell, Diana, Chris Wheat, and Chi Mac. 2020c. “Small Business Financial Outcomes during the COVID-19 Pandemic.” JPMorgan Chase Institute.
Farrell, Diana, Chris Wheat, Chi Mac, and Bryan Kim. 2020. “Small Business Expenses during COVID-19.” JPMorgan Chase Institute.
McManus, Michael. 2016. "Minority Business Owners: Data from the 2012 Survey of Business Owners." SBA Issue Brief (202): 1-13.
U.S. Census Bureau. 2021. Small Business Pulse Survey. https://portal.census.gov/pulse/data/
Wheat, Chris, Chi Mac, and James Duguid. 2021. “Retail Spending Response to Local Conditions during COVID-19.” JPMorgan Chase Institute.
However, other analyses did not find clear relationships between local restrictions and related consumer spending (Wheat, Mac and Duguid 2021).
A notable exception is the metro area around St. Louis, where we do not have a sufficiently large sample of firms.
Core-based statistical area
Health care workers were eligible December 15, 2020; frontline essential workers and residents 65 and over were eligible January 25, 2021; residents with high-risk conditions were eligible February 25, 2021; higher education staff, government workers, and media were eligible March 22, 2021; restaurant staff, construction workers, and religious leaders were eligible March 29, 2021; and all residents 16 and older were eligible April 12, 2021. https://coronavirus.illinois.gov/s/vaccination-plan-overview.
March 2020 through February 2021
March 2019 through February 2020
For the week of April 26, 2020, 13.3 percent of small businesses in Illinois reported having enough cash on hand for at least 3 months of operations. During the week of January 4, 2021, that share was 20.7 percent (U.S. Census Bureau).
Chicago’s central business district was distinctly and severely impacted the pandemic as commuting patterns changed, making it difficult to compare firms there with those elsewhere in Illinois. Small businesses in the Chicago CBD were therefore excluded from this analysis.
Racial compositions are based on data from the American Community Survey, which treats Latinx origin separately from race. Latinx Americans may be included as White or non-White.
Authors

Bryan Kim
Research Engineer, JPMorgan Chase Institute

Chi Mac
Business Research Director

Chris Wheat
President, JPMorganChase Institute