

Figure 1: Median balances were down 12.7% at their lowest point
Latest news

An Ohio-based company is protecting first responders around the world
With support from JPMorganChase, Fire-Dex is providing protective equipment to firefighters in 100 countries and all 50 states.
Learn moreLatest news

Veteran’s Unconventional Path to Landing her Dream Job in Tech
U.S. Army Veteran Ashley Wigfall transitioned to a civilian role and charted her path to technologist through mentorship and skills training at the JPMorgan Chase tech hub in Plano, Texas.
Learn more
Findings
The COVID-19 pandemic has affected every aspect of everyday life, from work to leisure. Even before a national emergency was declared on March 13, 2020, Americans began limiting their movements in an effort to contain the virus’s spread. In the weeks that followed, many states issued stay-at-home orders and closed nonessential businesses. Consumers cut their spending (Farrell, Greig, et al. 2020a) and shifted some of it online (Farrell, Wheat, et al. 2020).
For many small businesses and their owners, this was an unprecedented adverse shock. The typical small business maintains cash reserves to cover about two weeks of outflows in the event of a total revenue disruption (Farrell, Wheat and Grandet 2019). Some small businesses were able to shift to alternative channels, such as online sales, and many were able to reduce expenses to offset the loss of revenue. Others temporarily closed.
This report provides a first look at the effect of COVID-19 and the ensuing economic downturn on America’s small businesses. We examine small business changes in cash balances, revenues, and expenses through April 2020 using a de-identified sample of nearly 1.3 million small firms nationwide. This sample is based on the anonymized transactions of deposit accounts1 and represents both nonemployer and employer firms. The vast majority—over 80 percent—of small businesses are nonemployers,2 which is reflected in our sample.
Together, cash balances, revenues, and expenses provide a summary of small business financial health. Balances provide the liquidity firms need, especially when they experience an adverse shock. Revenues and expenses indicate the amount of business activity, which may be reflected in cash balances. However, cash balances are not simply the net change in revenues and expenses: Business owners may also transfer personal assets or secure other financing to replenish their balances.
We examined these financial health measures for all firms in our sample, as well as by metro area, industry, and owner race. We found that while the entire small business sector has been negatively affected by COVID-19, there was wide variation in the magnitude of effects. In particular, we found:
Based on administrative data, our findings complement studies based on survey data3 and provide additional insights. In particular, we provide estimates of the effect of the national emergency on small business financial outcomes. It is not surprising that small businesses are enduring hardship, but these data quantify the magnitude and variation of the effects and inform policymakers of the metro areas, industries, and demographic groups more deeply impacted. For these small businesses, recovery may be even more challenging than it already is.
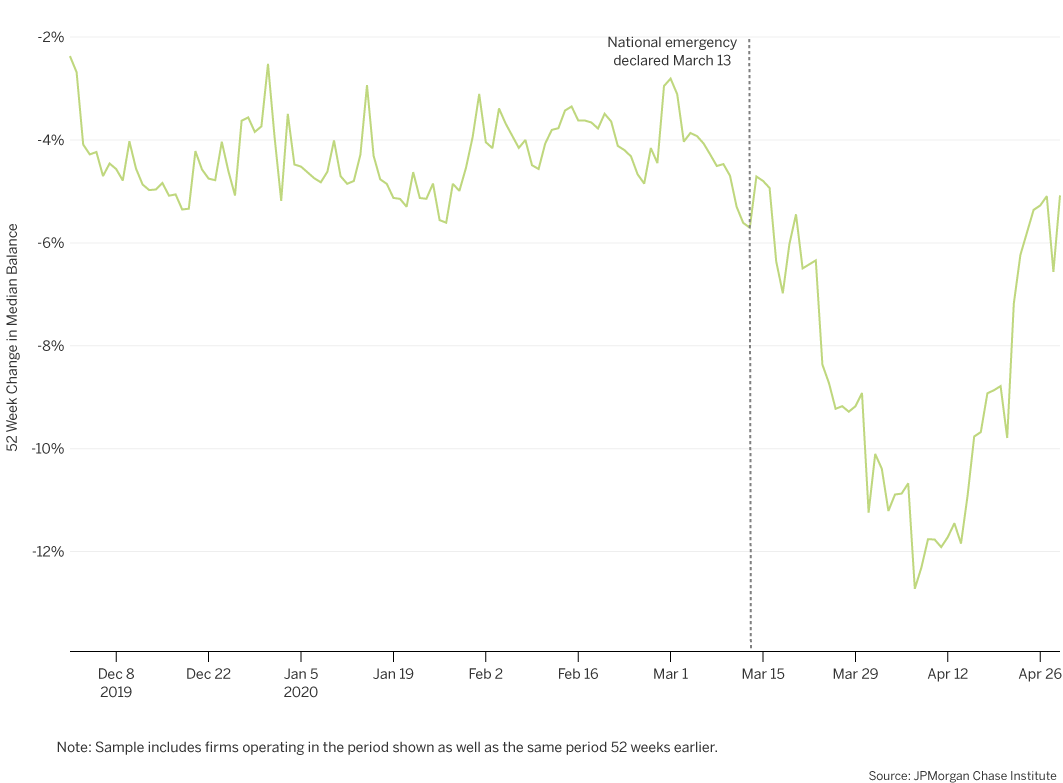
The typical small business experienced a substantial loss of cash liquidity of 12.7 percent during onset of the COVID-19 pandemic due to a sharp drop in revenue, partially offset by subsequent drops in expenses.
Figure 1: Median balances were down 12.7% at their lowest point
Figure 1 presents a daily view of 52-week changes in median daily cash balances for the firms in our sample. Notably, cash balances had been on the decline for most of the early weeks of 2020, hovering around a 4 percent annualized drop. At the time of the declared national emergency, balances were already 5.6 percent lower than they were a year before, and by April 7, they were down 12.7 percent. In comparison, balances in Houston and Miami were down about 7.5 percent after hurricanes Harvey and Irma before rebounding (Farrell and Wheat 2018).
Rebounding balances starting in mid-April were likely aided by CARES Act stimulus payments. Although these payments were paid to eligible individuals as opposed to firms, the majority of small businesses at large and in our sample are nonemployer firms. Pass-through entities, such as sole proprietorships, report net income on their owners’ tax returns. If those tax returns used the business’s direct deposit information, the stimulus payments would have been deposited into the business checking accounts.
Figure 2: Small business revenues initially declined ahead of expenses, but expenses declined more than revenues by the end of April
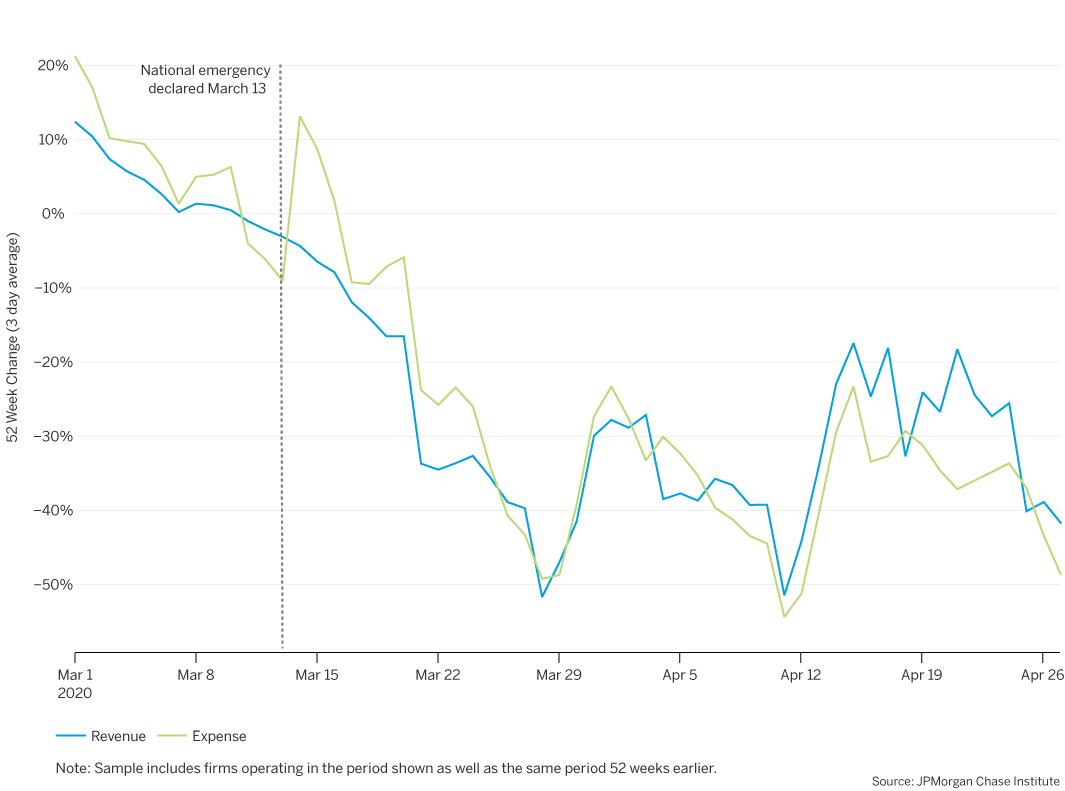
The change in cash balances can reflect not only changes in revenues and expenses but also net financing inflows, such as transfers. Examining revenues and expenses gives a more complete view of small business financial health. Figure 2 shows that small business revenues declined substantially after a national emergency was declared on March 13. At the end of March, the typical small business generated revenues that were about 50 percent lower than the same period in the prior year. During this period, expenses also decreased but not to the same degree as revenues. In the latter half of April, there was some rebounding of balances, with larger declines in expenses than revenues. Firms may have been able to adjust their expenditures in later weeks to a greater degree than they did initially.
For the typical small business, the decline in revenues starting in mid-March was mirrored and later surpassed by corresponding declines in expenses, mitigating the impact on cash balances. At the end of April, both revenues and expenses continued to be materially lower than they were a year prior.
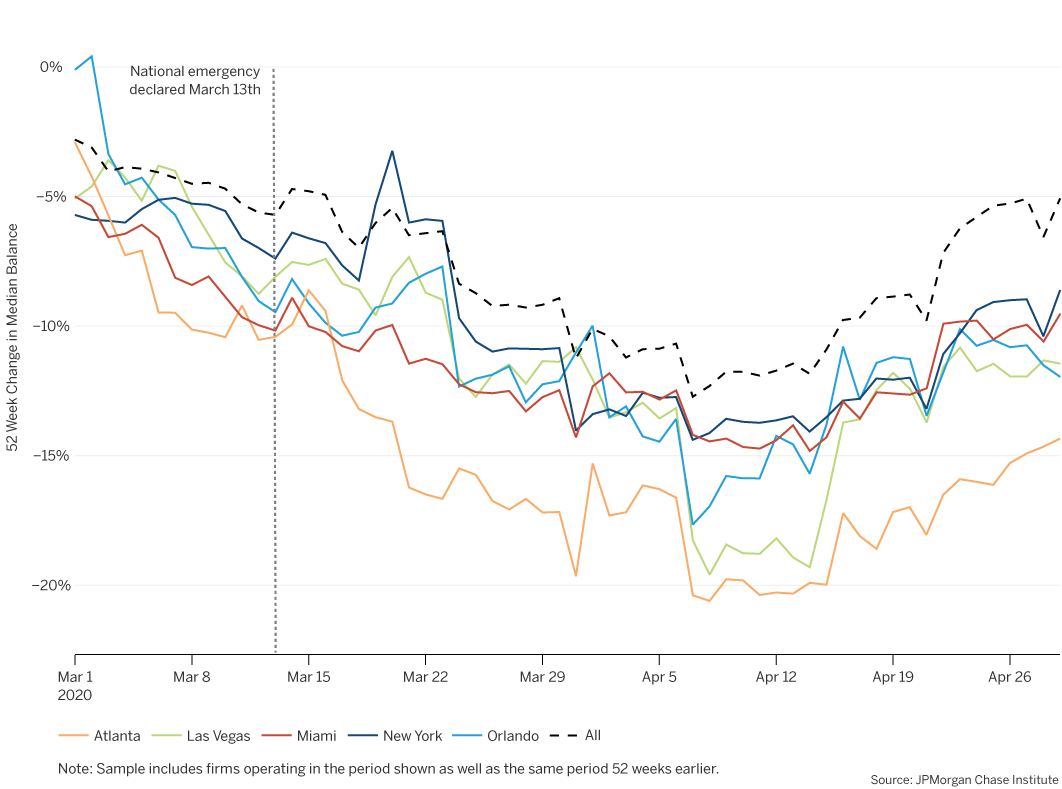
While local governments varied in the timing and scope of non-pharmaceutical interventions (NPIs), the general pattern of balance, revenue, and expense decline and recovery was surprisingly uniform across metro areas. However, the extent of the impact varied meaningfully across cities. Figure 3 presents balance growth trajectories for sixteen metro areas, five where median balances declined materially more than the median growth we observed in our sample, five where balance growth was substantially more muted and even grew by late April, and six where balance growth tracked our full sample.
Figure 3: Typical balances fell the most in Atlanta, but grew the most in Seattle and Indianapolis
Metro areas with larger than typical balance decreases
Metro areas with balance decreases similar to median
Metro areas with smaller than typical balance decreases
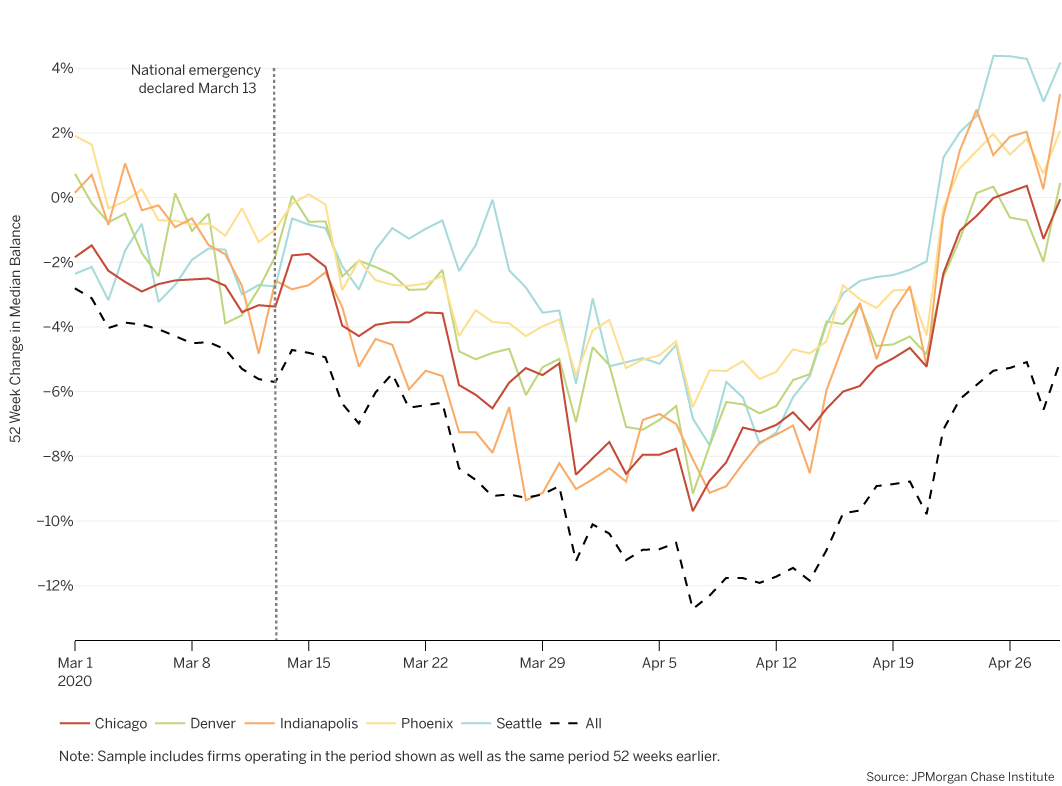
The top panel of Figure 3 shows the metro areas in which the decline in cash balances was more severe than the overall sample. Several of those metro areas, including Las Vegas, New York, and Orlando, are well-known tourist destinations. Small businesses in Atlanta, where balances were already 10 percent lower than the prior year before the national emergency declaration, saw the largest declines. The bottom panel shows the five metro areas in which cash balances did not decline as much as the nationwide sample. Small businesses in Seattle fared relatively well despite an early cluster of COVID-19 cases in the region.
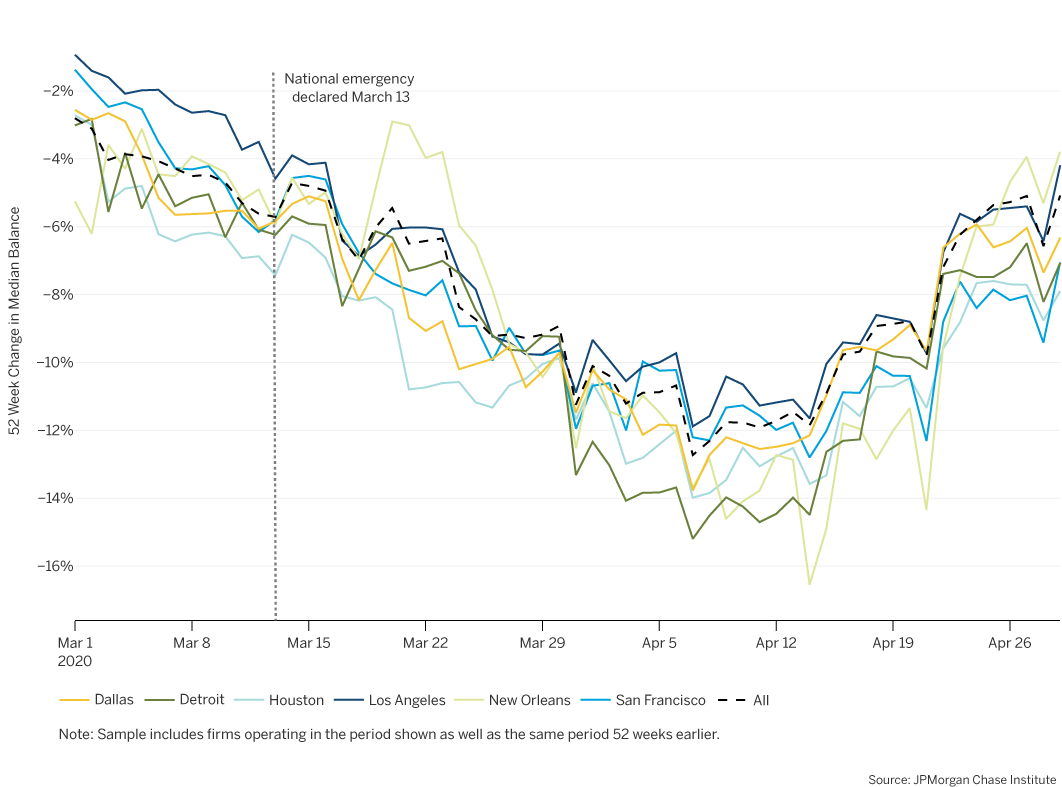
Figure 4: Change in revenues and expenses by metro area
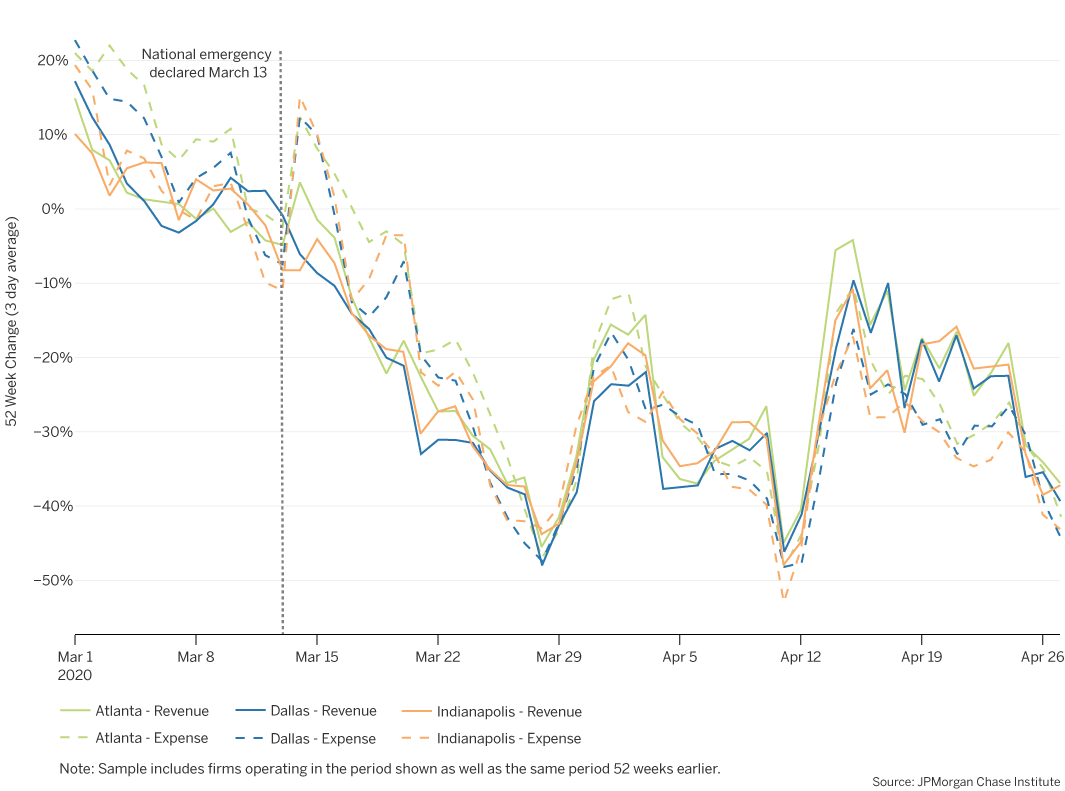
Revenues and expenses for small businesses in each city displayed similar patterns. Figure 4 shows the revenues and expenses for three cities relative to the same period in the prior year, with one city from each of the three groups of cash balance changes in Figure 3. Atlanta saw the largest changes in balances, while those in Indianapolis were more moderate. In Dallas, the declines in cash balances were similar to the experiences of small businesses nationwide. In each of these cities, both revenues and expenses declined dramatically in March, with somewhat larger decreases in revenues relative to expenses, which in turn contributed to the decline in balances. Despite some rebound at the end of March and again in mid-April, both revenues and expenses continued to be materially lower at the end of April than in the prior year. The larger reduction in expenses relative to revenues in April may result in the rebounding of small businesses’ cash balances.
Cities may have seen varying COVID-19 caseloads, as well as different stay-at-home policies, but small businesses in each city in our sample showed consistent declines with variation in the extent of the decline in revenues and expenses. Despite some recovery in cash balances in April, both revenues and expenses had not recovered by the end of April.
In the face of rising COVID-19 cases, and with an eye toward balancing customer and employee health with the needs of the economy, federal and local policymakers made decisions about which industries were essential and which were not. The effect of these decisions can be observed in differential small business financial outcomes across industries.
Figure 5: Typical balances fell the most for restaurants, and grew the most for health care service providers
Larger balance decreases
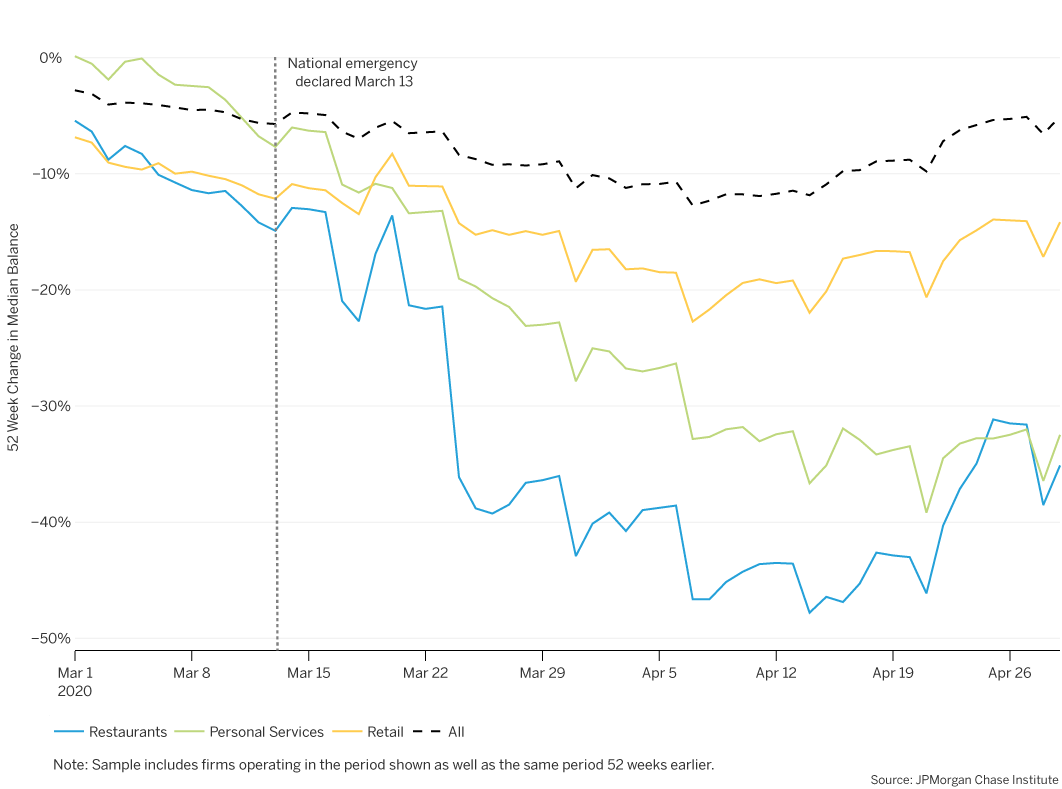
Typical balance changes
Smaller balance decreases
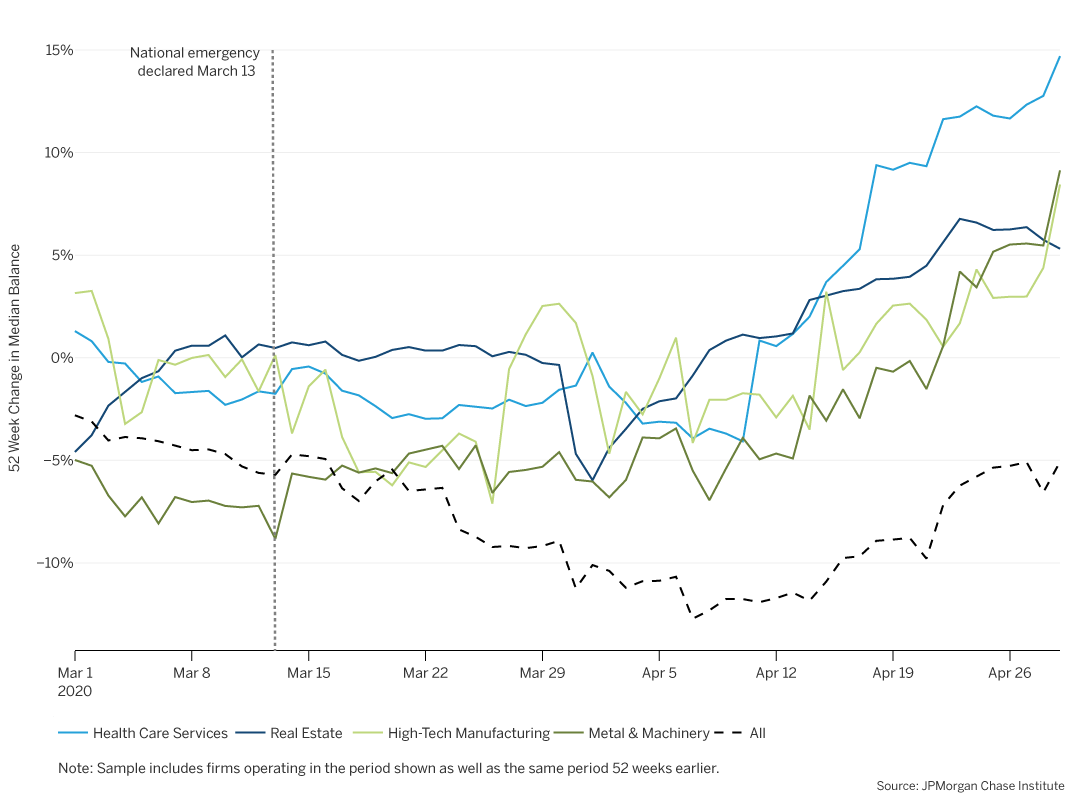
Figure 5 shows the cash balances of typical small businesses relative to their balances from the prior year. In the top panel are industries for which the decreases in balances were larger in magnitude than in the overall sample across all industries. Notably, balances fell the most for restaurants, personal services, and retail—three industries that largely depend on face-to-face interactions with customers. Among these, balances fell the least among retailers, some of which were designated as essential. Balances also fell more for restaurants than they did for personal services firms, even though most personal service firms were designated non-essential and forced to close.
In contrast, balances among high-tech manufactures, health care service providers, real estate firms, and metal and machinery manufacturers were largely stable and even increased towards the end of April.
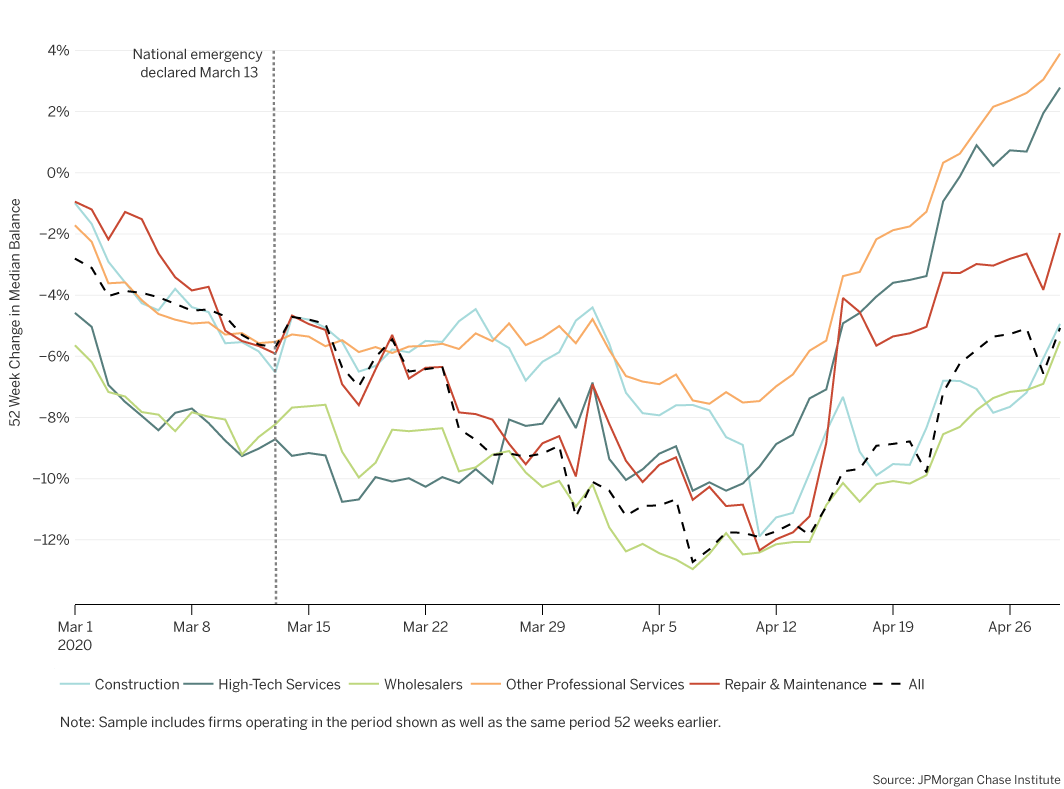
Figure 6: By mid-April, revenue had declined over 80 percent for the typical personal services firm
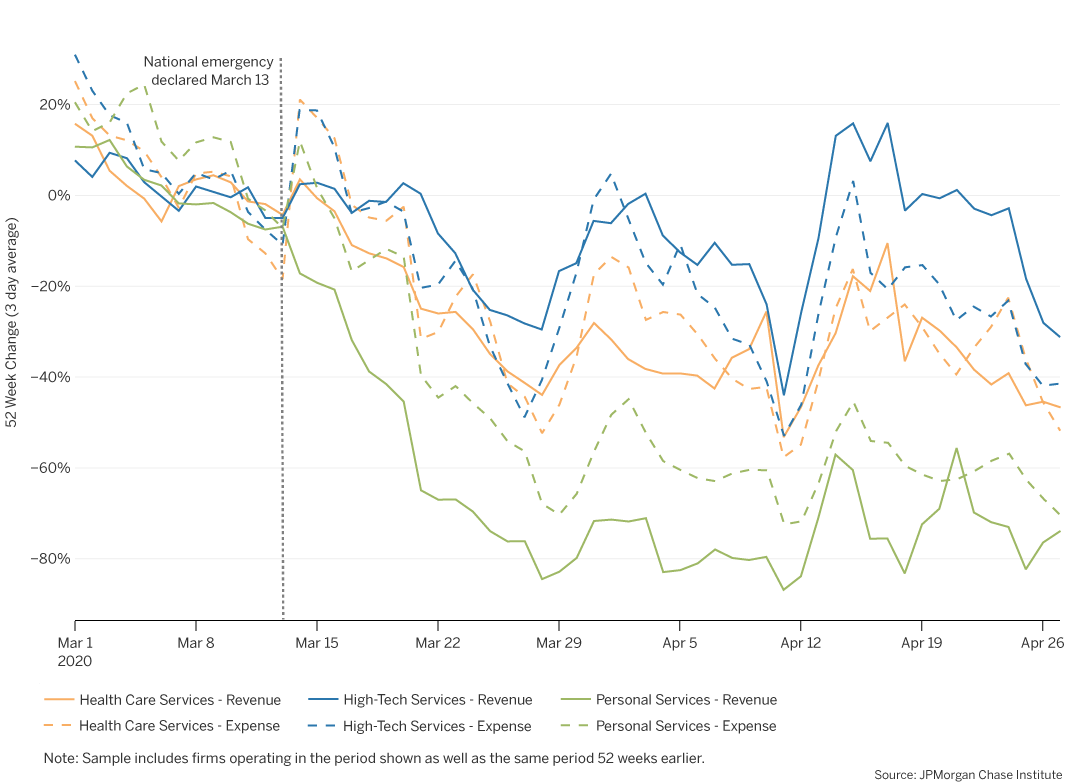
The change in cash balances reflects changes in both revenues and expenses. Corresponding declines in expenses can help firms maintain their balances as revenues decrease, a more feasible practice in some industries. For example, typical high-tech services firms were often able to cut their expenses by more than the decline in revenue. Revenues in high-tech services were also not as adversely affected as in other industries. In contrast, the typical personal services firm lost about 80 percent of its revenue without being able to cut expenses to the same degree. Although cash balances of health care services firms appear to have recovered, their revenues were nevertheless nearly 40 percent lower than they were a year ago.
It is not surprising that small businesses in some industries were more severely affected by the economic downturn related to COVID-19. Some were restricted based on local policies defining essential services, and all were affected by their customers’ restricted movements. Personal services firms, restaurants, and retail have been most severely affected, and recovery for them may be the most difficult.
The public health and economic crises related to COVID-19 have affected Black and Hispanic Americans disproportionately: They are not only more likely to experience job or income losses, but they are also more likely to die from complications due to the virus (Gould and Wilson 2020). Their small businesses, along with Asian-owned businesses, have also been more severely affected by closures and the economic downturn (Fairlie 2020).
Black- and Hispanic-owned businesses are particularly vulnerable in this downturn in part because of the industries in which they are concentrated and in part because they were already in a weaker financial position prior to the pandemic. Minority-owned businesses comprise a majority of personal services firms (McManus 2016), a sector that has been particularly hard hit in the current economic environment. Small businesses in majority Black and Hispanic communities also have less cash liquidity (Farrell, Wheat and Grandet 2019) and therefore have fewer resources with which to withstand adverse revenue shocks.
In forthcoming research (Farrell, Wheat and Mac 2020), we examine small business financial outcomes by owner race using our de-identified sample of small firms matched to owner race data obtained from publicly available voter registration records. (See Farrell, Greig, et al. (2020b) for details about the matching algorithm.) Out of the states in which race/ethnicity data is collected in voter registration records, Chase had a footprint in three as of 2018: Florida, Georgia, and Louisiana. For this subset of nearly 95,000 small businesses in those three states, we can provide insight on the differential impact of COVID-19 on minority-owned small businesses.4
Figure 7: Cash balances of Black-owned firms were down 26 percent in March compared to the prior year
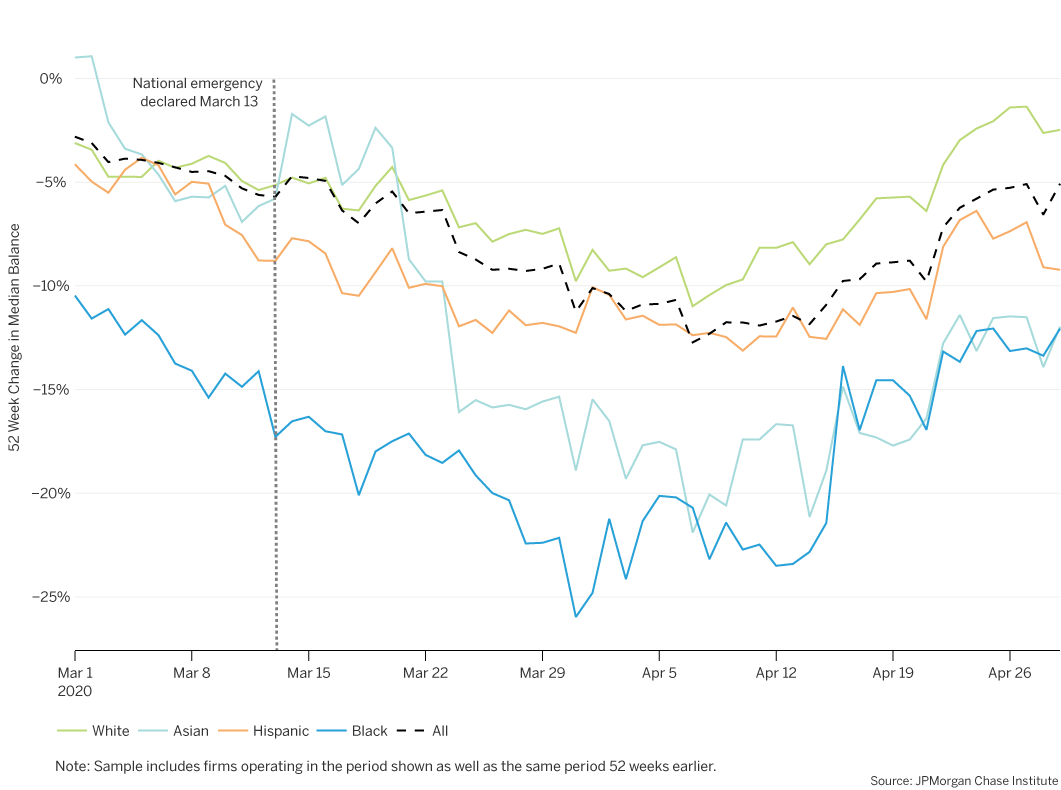
Figure 7 shows the median cash balances, relative to the same period in the prior year, by owner race. At the beginning of March, balances of Black-owned businesses were already over 10 percent lower than the prior year, compared to a decline of about 3 percent overall. By the end of March, cash balances were 26 percent lower, compared to a 12 percent decrease across all firms.
Among Asian-owned firms, balances declined nearly 22 percent in early April despite starting at a relatively strong position at the beginning of March. The Asian American population in Florida, Georgia, and Louisiana is not large, and Asian-owned businesses in these states may not be representative of Asian-owned firms nationwide.5 However, in light reported discrimination of Asian American businesses due to COVID-19,6; their financial outcomes may nevertheless be a relevant small business indicator. By the end of April, balances experienced some recovery, although Asian-, Black-, and Hispanic-owned businesses lagged behind White-owned ones.
Figure 8: Revenues of Asian-owned businesses declined by more than 60 percent
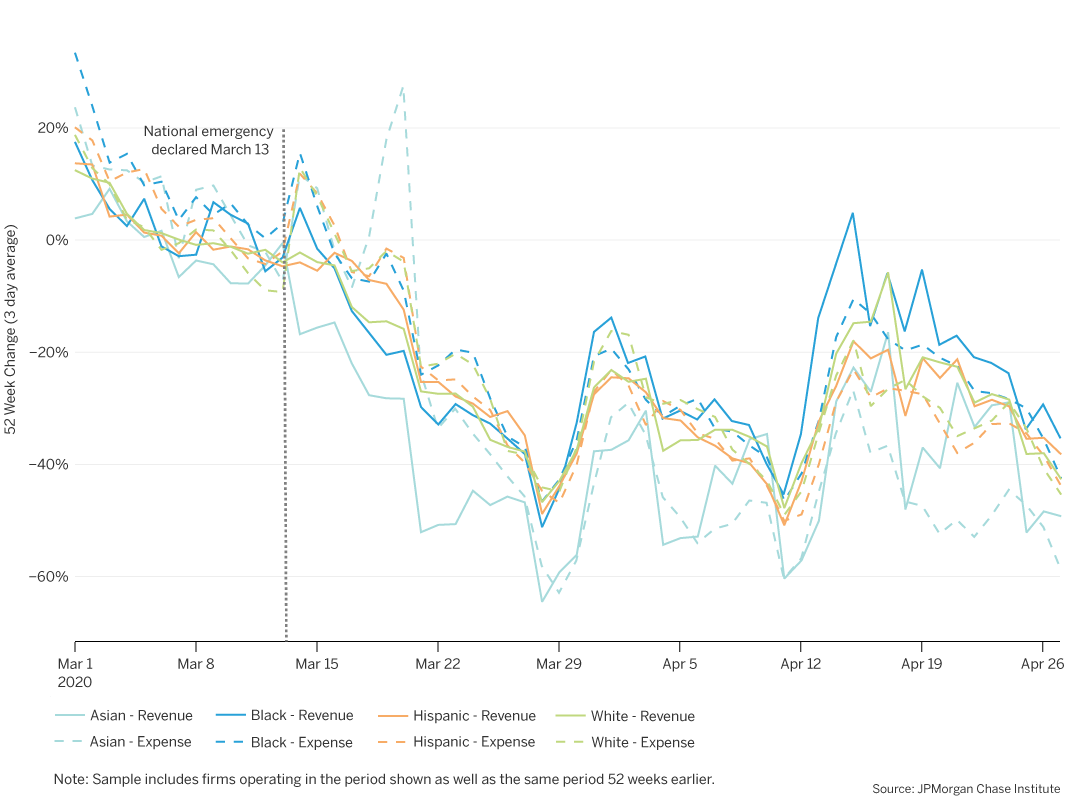
The median changes in revenues and expenses are shown in Figure 8 by owner race. At the beginning of March, revenues were higher than they were at the same time last year. However, in mid-March, revenues began declining, particularly for Asian-owned businesses. At the end of March, revenues for the typical Asian-owned business was over 60 percent lower than they were in the prior year. Although there was some recovery in April, revenues at the end of April were still substantively lower than they were at the same time last year. The reduction in expenses by more than the decrease in revenues mitigated the effect on cash balances.
The economic downturn precipitated by the COVID-19 public health emergency has been an adverse shock for many, if not most, small businesses and the effect on Black- and Asian-owned businesses was particularly severe. That may be the result of concentration in certain industries or a weaker initial financial position before the pandemic. Programs supporting small businesses should be aware of the differential impacts and needs across owner demographic groups.
We provide a recent snapshot of small business financial outcomes at the onset of COVID-19 using administrative banking data. Policies and programs providing relief to affected small businesses or support as they rebuild can use this research to target sectors that have been more adversely affected by the public health emergency. With these objectives in mind, we offer the following implications for leaders and decision makers:
Median Revenue and Expense Estimates
Even in a strong economy, small business revenues are irregular and heterogeneous . On a given day, many small businesses do not receive any revenue at all, and the level of these revenues varies widely across small businesses when they do receive them. This structure held both before and during the onset of the COVID-19 pandemic. Figure A1 shows the share of firms that received any revenue into their accounts on a given day, as well as the median dollar value of those revenues among the firms that received revenue that day.
Figure A1: The typical small business received revenue less often and at lower levels after the national emergency was declared
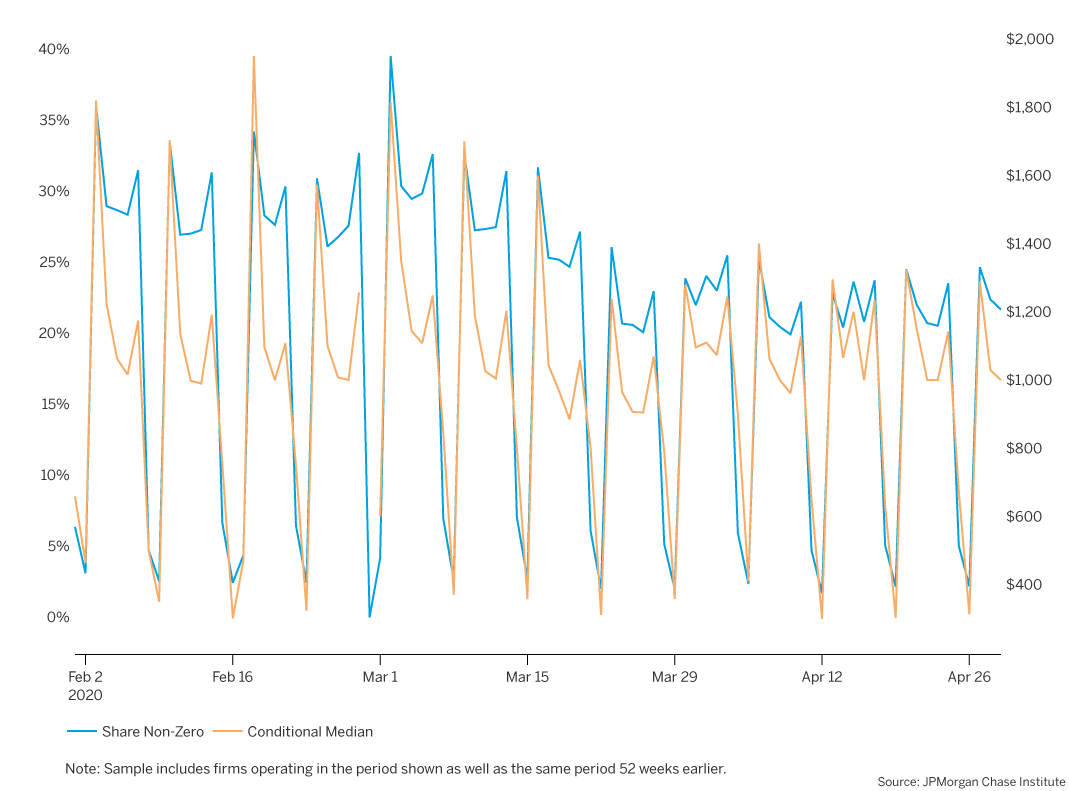
Figure A1 illustrates a general and consistent pattern throughout most of the period—with few exceptions, revenues post to firm accounts on weekdays, with slightly higher likelihood and level on Mondays, Fridays, and on the weekday closest to the beginning of a calendar month. Additionally, there were two substantial changes after the national COVID-19 emergency was declared on March 13, 2020. First, the share of firms receiving revenue on a typical weekday fell from approximately 30 percent to about 23 percent in April. Second, the median daily revenue on a typical day fell as well, though less sharply, and mostly in revenues posting on Mondays (typically reflecting weekend transactions).
Figure A2: Estimated median daily revenue fell from $555 On Monday, March 9th to $295 on Monday, April 13th
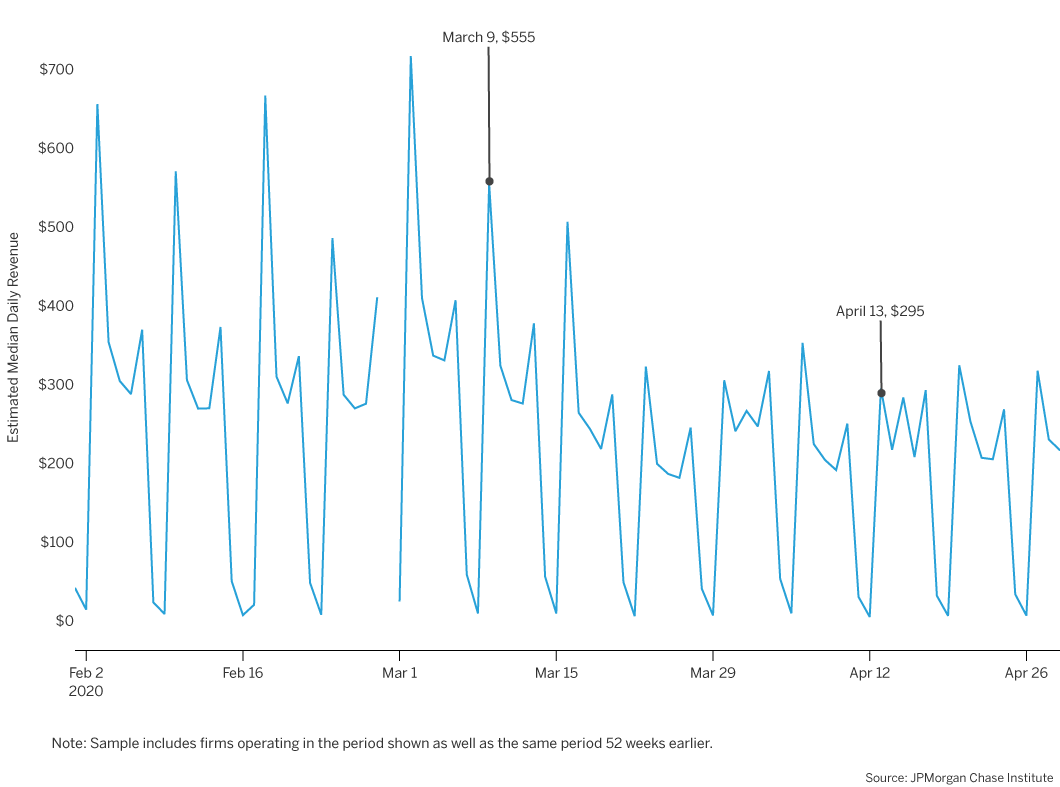
We combined these series in order to estimate the revenue the typical firm received on each day. Figure A2 shows the result of this estimation. For example, on Monday, March 9th, the typical firm received $555 in revenues. A Monday about a month later, on April 13th, daily revenue had decreased to $295. We then compared estimates year-over-year to estimate the extent to which the typical firm saw increased or decreased revenue each of these days.
Bartik, Alexander, Marianne Bertrand, Zoe Cullen, Edward L. Glaeser, Michael Luca, and Christopher Stanton. 2020. "How are Small Businesses Adjusting to COVID-19? Early Evidence from a Survey." National Bureau of Economic Research.
Fairlie, Robert W. 2020. “The Impact of Covid-19 on Small Business Owners: Evidence of Early-Stage Losses from the April 2020 Current Population Survey.” National Bureau of Economic Research.
Farrell, Diana and Chris Wheat. 2018. “Bend, Don’t Break: Small Business Financial Resilience After Hurricanes Harvey and Irma.” JPMorgan Chase Institute.
Farrell, Diana, Chris Wheat, and Carlos Grandet. 2019. "Place Matters: Small Business Financial Health Urban Communities." JPMorgan Chase Institute.
Farrell, Diana, Chris Wheat, and Chi Mac. Forthcoming. “Small Business Owner Race, Liquidity, and Survival.” JPMorgan Chase Institute.
Farrell, Diana, Chris Wheat, and Chi Mac. 2018. "Growth, Vitality, and Cash Flows: High-Frequency Evidence from 1 Million Small Businesses." JPMorgan Chase Institute,
Farrell, Diana, Chris Wheat, Marvin Ward Jr., and Lindsay Relihan. 2020. “The Early Impact of COVID-19 on Local Commerce: Changes in Spend Across Neighborhoods and Online.” JPMorgan Chase Institute.
Farrell, Diana, Fiona Greig, Natalie Cox, Peter Ganong, and Pascal Noel. 2020a. “The Initial Household Spending Response to COVID-19: Evidence from Credit Card Transactions.” JPMorgan Chase Institute.
Farrell, Diana, Fiona Greig, Chris Wheat, Max Liebeskind, Peter Ganong, Damon Jones, and Pascal Noel. 2020b. "Racial Gaps in Financial Outcomes: Big Data Evidence." JPMorgan Chase Institute.
Gould, Elise and Valerie Wilson. 2020. “Black workers face two of the most lethal preexisting conditions for coronavirus—racism and economic inequality.” Economic Policy Institute.
McManus, Michael. 2016. "Minority Business Owners: Data from the 2012 Survey of Business Owners." SBA Issue Brief (202): 1-13.
Our sample is comprised of firms that hold Chase Business Banking deposit accounts and meet our criteria for small operating businesses in core metropolitan areas. These firms hold at most two business deposit accounts with combined balances not exceeding $20 million. They operate in one of the twelve industries that are characteristic of the small business sector: Construction, health care services, metals and machinery manufacturing, real estate, repair and maintenance, restaurants, retail, personal services (e.g. dry cleaning, beauty salons, etc.), other professional services (e.g. lawyers, accountants, consultants, marketing, media, and design), wholesalers, high-tech manufacturing, and high-tech services and show no evidence of operating in more than a single location or industry. They must also satisfy criteria indicating that they are operating businesses by having, in at least one consecutive 12 month period, three months with at least $500 in outflows and at least 10 transactions.
The U.S. Small Business Administration noted that in 2016, there were 30.7 million small businesses, 24.8 million of which had no employees.
For example, the U.S. Census Bureau’s Small Business Pulse Survey measures changes in business conditions during the pandemic. https://www.census.gov/data/experimental-data-products/small-business-pulse-survey.html.
Our forthcoming report includes analyses that compares our sample to available state and national benchmarks.
For this reason, our forthcoming report limits the analyses to Black-, Hispanic-, and White-owned firms.
Knowles, Hannah and Kim Bellware, “Fear sent her Chinatown restaurant spiraling. The challenges to reopening feel ‘just impossible.’” The Washington Post (Washington, DC), May 16, 2020.
We thank our research team, specifically Bryan Kim, Olivia Kim, Anu Raghuram, and Nicholas Tremper for their hard work and contributions to this research.
This effort would not have been possible without the critical support of our partners from the JPMorgan Chase Consumer & Community Bank and Corporate Technology Solutions teams of data experts, including Michael Aguilar, Kyung Cho-Miller, Anoop Deshpande, Andrew Goldberg, Melissa Goldman, Senthilkumar Gurusamy, Derek Jean-Baptiste, Brian Maddox, Albert Raymond, Anthony Ruiz, Subhankar Sarkar, Breann Zickafoose, and from our internal partners and JPMorgan Chase Institute team members including Haley Dorgan, James Duguid, Elizabeth Ellis, Alyssa Flaschner, Fiona Greig, Courtney Hacker, Chris Knouss, Sarah Kuehl, Sruthi Rao, Parita Shah, Tremayne Smith, Gena Stern, Preeti Vaidya, and Marvin Ward.
We would like to acknowledge Jamie Dimon, CEO of JPMorgan Chase & Co., for his vision and leadership in establishing the Institute and enabling the ongoing research agenda. Along with support from across the Firm—notably from Peter Scher, Max Neukirchen, Joyce Chang, Marianne Lake, Jennifer Piepszak, Lori Beer, Derek Waldron, and Judy Miller—the Institute has had the resources and support to pioneer a new approach to contribute to global economic analysis and insight.
Authors

Diana Farrell
Founding and Former President & CEO

Chris Wheat
President, JPMorganChase Institute

Chi Mac
Business Research Director