
Figure 1: Health insurance premiums as a share of expenses have increased for nonemployers.
Latest news

An Ohio-based company is protecting first responders around the world
With support from JPMorganChase, Fire-Dex is providing protective equipment to firefighters in 100 countries and all 50 states.
Learn moreLatest news

Nationwide decline in housing affordability hits lower-income areas of Columbus
Learn moreLatest news

Veteran’s Unconventional Path to Landing her Dream Job in Tech
U.S. Army Veteran Ashley Wigfall transitioned to a civilian role and charted her path to technologist through mentorship and skills training at the JPMorgan Chase tech hub in Plano, Texas.
Learn more
Research
June 26, 2024
The growing cost of healthcare is often cited as a concern both for owners of small businesses and their employees, with potential implications for the sector to contribute to the growth of the U.S. economy. For small businesses that provide health insurance benefits, insurance premiums may be a material portion of their cost of conducting business. Among small employers that do not offer health insurance, 65 percent cited cost as the most important reason (Wade and Oldstone 2023). Health insurance premiums may also be of particular concern to the majority of U.S. workers—54.5 percent—that are covered through employer-sponsored health plans (Keisler-Starkey, Bunch, and Lindstrom 2023). Many of these workers are employed at small businesses—over 27 percent of private sector employees in 2023 were employed in firms with 1 to 49 employees.1
Concerns about the impact of healthcare costs on the small business sector may be grounded in assessments of the size and growth of overall healthcare expenditures. Health care spending was an estimated 18.3 percent of the U.S. gross domestic product (GDP) in 2021 and is projected to grow to 19.6 percent of GDP in 2031 (Keehan et al. 2023). However, these aggregate analyses may not reflect the financial outcomes of individual small businesses and their owners making dynamic choices in the health insurance market.
To better document these outcomes, we analyzed small businesses health insurance premium payments, focusing on the five years from 2018 to 2023. Our unique data asset allowed us to follow cohorts of firms over time, providing insights into the small business experience of paying for health insurance relative to other costs. Over the last five years, nonemployer health insurance premiums payments have increased by 19 percent, and employer payments have increased by 33 percent, implying compound annual growth rates of 3.5 percent and 5.9 percent, respectively. We also used cross-sectional samples to illustrate the range of premium payments. Together, these data reflect how firms adapted to their changing prices and workforces, experiences which are not necessarily captured by benchmarks alone. Our findings:
We designed our research samples to analyze small business owners who purchase health insurance for themselves and small businesses that provide health insurance benefits to their employees. As in much of our small business research, the de-identified firms in our sample all had Chase Business Banking deposit accounts that met our criteria for being active and small. In addition, we required evidence of regular electronic health insurance premium payments. We used payroll activity and estimated operating expenses to classify firms as nonemployers or employers.
Our nonemployer sample included small business owners who paid health insurance premiums for themselves and their families. Our employer sample included small businesses who made both health insurance and payroll payments. While businesses with 50 or more employees face penalties if they do not offer health insurance benefits, smaller businesses do not.2 As a result, the typical firm in our employer sample may be larger than those in samples unrelated to health insurance. The Appendix provides additional details about our sample construction.
The vast majority—over 81 percent of 33 million—small businesses in the U.S. have no employees (SBA 2023). Nonemployer small business owners must purchase health insurance for themselves and their families on the individual market if they do not have coverage through another source, such as a family member’s plan. In 2023, an estimated 18.2 million people were enrolled in the individual market (Ortaliza, Amin, and Cox 2023). They may enroll in a plan through one of the Affordable Care Act (ACA) marketplaces3 or buy directly from an insurer. For these small business owners, health insurance is one of the many expenses they face.
We analyzed nonemployer health insurance costs by (1) calculating the median health insurance burden for a cohort of firms that paid premiums over five years; and (2) looking at the range of health insurance payments made by nonemployers since 2014. Each method illustrates the experiences of business owners purchasing health insurance and how those experiences are not completely captured by statistics on average premiums, which we also show for context.
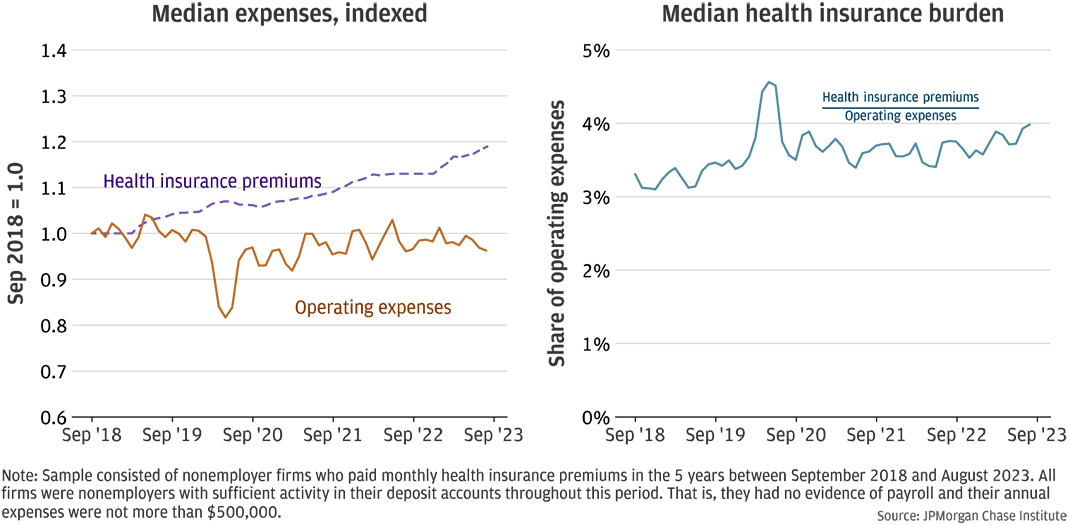
Health insurance premiums are an increasing share of operating expenses among firms that continue to hold health insurance. First, we considered a longitudinal panel of firms that consistently paid health insurance premiums over five years, in order to assess the changes experienced by individual firms. In prior research, we noted that the typical health insurance burden—the share of operating expenses devoted to health insurance premiums—increased for a longitudinal panel from 2014 and 2017 (Farrell, Wheat, and Mac 2017). Health insurance premiums grew faster than other expenses, leading to increasing health insurance burdens.
Figure 1: Health insurance premiums as a share of expenses have increased for nonemployers.
We updated this analysis with a new longitudinal panel of 1,655 firms with health insurance payments in the last five years of our sample, ending in August 2023.4 Firms in this sample were actively operating and paid health insurance premiums in each month of the five-year period.
The left panel of Figure 1 shows the median indexed health insurance premiums and operating expenses for the firms in our panel. That is, each firm’s expenses and health insurance premiums were divided by their respective values at the beginning of the period so that the indexed values were 1.0 in September 2018. The values over time show the cumulative change in each series. Over the five-year period, health insurance expenses increased by about 19 percent for the median firm, or a compound annual growth rate (CAGR) of 3.5 percent. For a hypothetical firm that paid $400 a month in premiums in 2018, premiums in 2023 had increased to $476. Despite some fluctuations, operating expenses were relatively flat. This is somewhat surprising since the last five years included a period of materially higher inflation—one dollar in 2018 was equivalent to $1.22 in 2023, representing inflation of 22 percent.5 How firms managed their expenses in a period of historically high inflation is beyond the scope of this report, but our results suggest that they were able to find cost-saving measures as some expenses—such as health insurance premiums—were increasing.
The right panel of Figure 1 shows the median health insurance burden increased from over 3 percent of operating expenses to about 4 percent.6 This increase is not due to changes in the composition of firms—all firms in the sample are present for the entire duration of the analysis. The noticeable increased burden in early 2020 was likely not due to a marked increase in premiums but rather a decrease in overall expenses at the onset of the COVID-19 pandemic (Farrell, et al. 2020). These results are consistent with health insurance premiums increasing faster than other operating expenses for the typical nonemployer.
Typical premium payments have mostly been stable, but many small business owners are paying substantially higher premiums in 2024 as compared to 2014. While the consistent sample of firms in our longitudinal panel has advantages, it may not capture the full range of experiences that small business owners have in the individual health insurance market. We also used a cross-sectional sample of nonemployer firms that paid health insurance premiums between 2014 and 2023. Firms need not make premium payments throughout the period and may exit the sample. The resulting sample included approximately 15,000-26,000 firms each month. This larger sample allowed us to analyze how the distribution of health insurance premiums changed over time.
Figure 2: Median nonemployer health insurance premiums have remained stable, while the distribution of premium payments has widened.
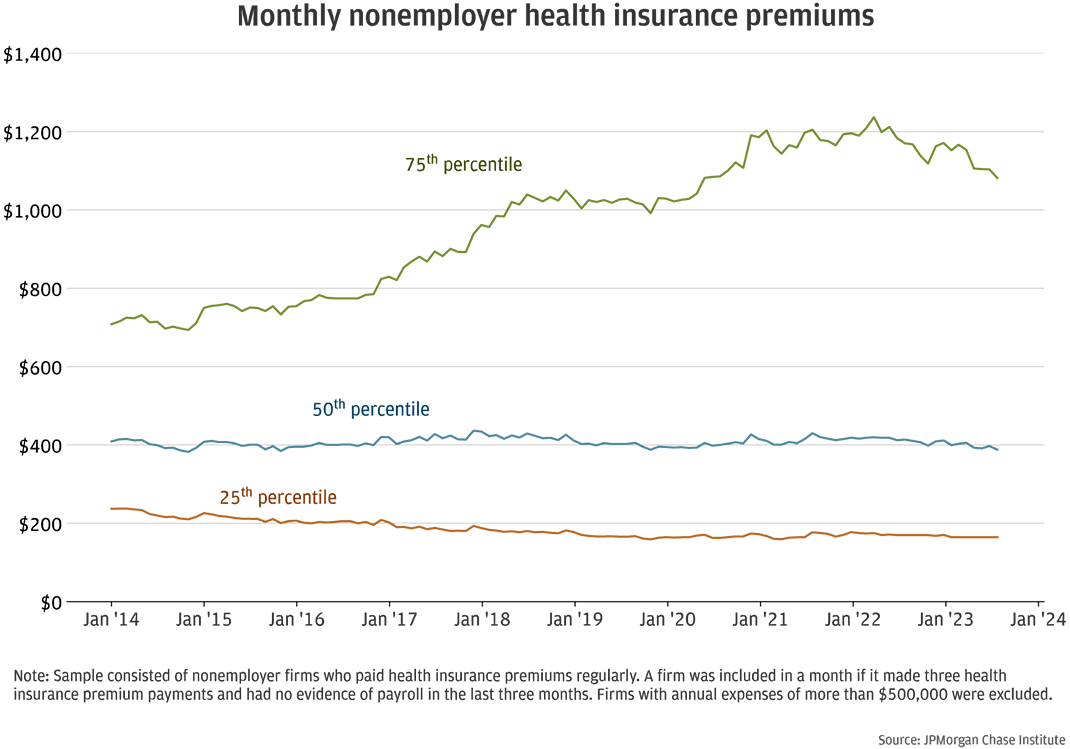
Figure 2 shows that while the median and 25th percentile payments have remained stable or decreased since 2014, the distribution of payment amounts has widened. The median payment in August 2023 was $389, very similar to the median payment of $409 in January 2014. The 25th percentile payment decreased from $237 to $165 over this same period. We did not inflation-adjust these amounts, suggesting at least a directional decrease in inflation-adjusted median payments. However, the lack of a clearly appropriate deflator limited our ability to size this decrease. The Appendix discusses two measures of health insurance costs and why we chose not to use them.
By contrast, the 75th percentile payment in August 2023 was $1,081—53 percent higher than the 75th percentile payment of $708 in 2014. Several forces could explain this pattern: The mix of individual and family plans in our sample could have changed; the mix of plan types (e.g., bronze, silver, gold, and platinum) could have changed; and subsidies could have kept payments from rising, particularly on the lower end of the distribution.
Changes in premium payments may reflect differences in product choices or differential use of subsidies over time. First, consider the differences between premiums for individuals and families. Family plans typically cost more since they cover two or more people, including dependents. In 2014, the average unsubsidized individual premium was $271, compared to $667 for a family plan (eHealth 2021).7 In 2014, the median payment of $406 in our sample would be consistent with a mix of individual and family plans. In 2021, the median in our sample was similar to the $450 average monthly individual unsubsidized premium among eHealth applications. Notwithstanding the differences between medians and averages,8 this could be consistent with a decrease in the share of small business owners in our sample who purchased family plans. Our sample may include fewer business owners with families over time, or their family members could have increasingly acquired health insurance through other means, such as employer-sponsored plans.
Second, the share of small business owners choosing lower-priced plans may have increased over time. Data from health insurance applications on the individual market showed a decrease in overall customers choosing platinum plans, from 6 percent in 2015 to 1 percent in 2021, and an increase in customers choosing gold plans, from 13 percent to 17 percent over the same years (eHealth 2021). Premiums are typically stratified by metal tiers, as shown in Figure 3. For example, the average lowest-cost gold plan premium was $526 in 2018, compared to $456 and $341 for lowest-cost silver and bronze plans, respectively (KFF State Health Facts9, 10).
Figure 3: Individual health plan premiums decreased or remained stable since 2018.
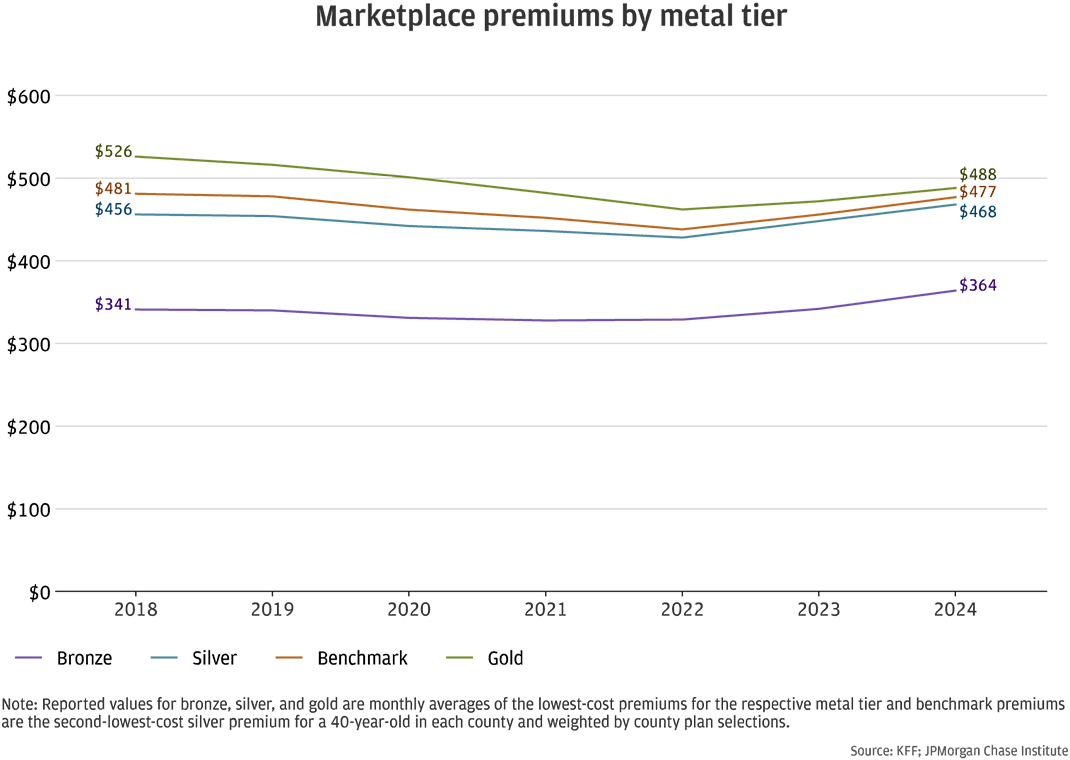
Moreover, average monthly premiums were stable or declined since 2018. Figure 3 shows average individual premiums between 2018 and 2024. The average benchmark premium, which represents the second-lowest-cost silver plan for a 40-year-old was $481 in 2018 and $438 in 2022. The benchmark premium increased to $477 in 2024 but was nevertheless lower than the average in 2018.
Third, subsidies could have kept premium payments stable, particularly at the lower end of the premium distribution. For those purchasing insurance from ACA marketplaces, advance premium tax credits (APTC) may lower the monthly premiums. Households are generally eligible if their income is between 100 and 400 percent of the Federal Poverty Level (FPL), although the criteria was expanded in to include incomes beyond 400 percent of the FPL with the passage of the American Rescue Plan Act (ARPA) in 2021. The ARPA provisions are currently scheduled to sunset at the end of 2025 (Fernandez 2024).
Figure 4: Advance premium tax credits reduced monthly health insurance payments.
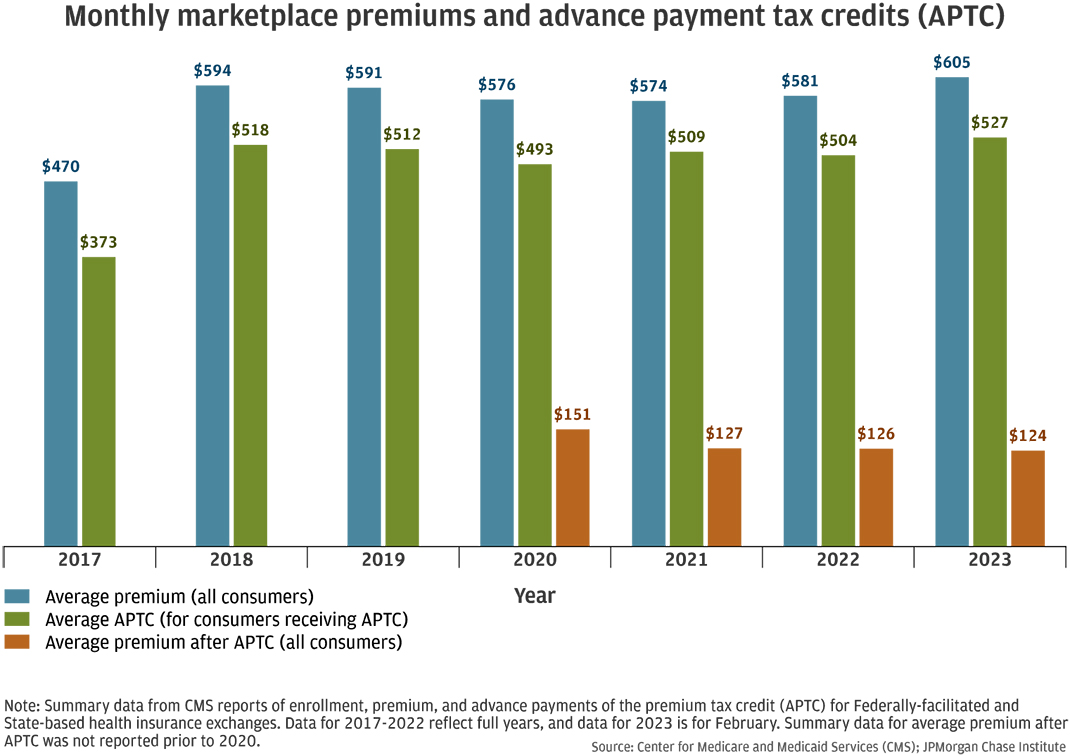
The Center for Medicare and Medicaid Services (CMS) reported that the vast majority of participants enrolled in ACA marketplace plans also received APTC. In 2017, 84 percent of the 9.7 million ACA marketplace enrollees were also enrolled in APTC. That share increased over time: in 2023, 91 percent of the 15.7 million marketplace enrollees qualified for APTC. The APTC substantially decreased the monthly premium. Figure 4 shows that in 2023, the average monthly premium for marketplace enrollees was $605, but the average premium after APTC for all consumers was $124, as not all marketplace enrollees qualified for APTC. Despite increasing average premiums since 2021, the average premium after APTC for all consumers has decreased since 2020.
We cannot observe whether premiums paid by small business owners in our sample benefited from APTC.11 However, the estimated business earnings among businesses with lower premium payments were conceivably associated with incomes that could qualify for the tax credits. The FPL for an individual in 2023 was $14,480 and $30,000 for a family of four.12 Incomes at 400 percent of FPL would be $57,920 and $120,000 for an individual and a family of four, respectively.
Among the business owners with health premiums below the 25th percentile in 2023, which was about $165 per month, the median annual business earnings (i.e., revenues less expenses, as estimated with deposit account transactions) was about $16,000. For business owners with premiums between the 25th and 50th percentiles, or about $165 to $400 per month, median business earnings in 2023 was about $20,000. These estimates may not reflect all the income that a business owner earned in a year: for example, owners could have taken draws from their business accounts or have other wage or investment income. Nevertheless, our estimates suggest that some business owners may have been eligible for APTC, lowering their premiums. That would be consistent with relatively little change in the lower end of the premium payment distribution while the upper end increases.
The typical nonemployer firm in our longitudinal panel experienced increasing health insurance premiums over the last five years (Figure 1), while the median firm in our cross-sectional sample did not (Figure 2), although the wide distribution illustrates that some firms experienced increasing premiums. These seemingly inconsistent trends could be reconciled by changes in plan types within each sample, as discussed above. The cross-sectional sample allows entry and exit, showing the choices made by varying sets of firms. However, the longitudinal panel of a fixed set of firms may better illustrate the experiences of small business owners over time. The panel may be capturing the increasing premiums of business owners who renew the same or similar insurance policy.
Although health insurance premiums have increased since 2014, evidence from our sample as well as average ACA marketplace premiums suggest that the increases have moderated since 2019. Moreover, some business owners may be able to use tax credits to reduce their monthly premiums or choose different plans. However, business owners may nevertheless experience increasing insurance premiums if they generally renew the same policy.
Businesses with less than 50 employees are not subject to penalties related to the employer shared responsibility provisions of the ACA (Whittaker 2016), but small employers may nevertheless choose to offer health insurance as part of competitive pay and benefits packages for their employees. More than 94 percent of employer establishments in the U.S. have 1-49 employees, and more than half (54 percent) have fewer than 5 employees13 (Hait 2021).
Although the total cost employers pay for health benefits would generally be expected to increase with the number of employees, the cost may vary based on several factors. For example, employers often do not offer coverage to part-time or temporary employees. Employers who offer health benefits may nevertheless cover only some eligible employees if some of them choose coverage elsewhere, such as through a family member’s plan. In 2023, an estimated 82 percent of employees at small firms14 offering health benefits were eligible for coverage, and 71 percent elected coverage (Claxton et al. 2023). The total cost could also vary based on the mix of individual and family plans selected by employees, as well as the employers’ policies on cost-sharing.
With so many variations in employer-sponsored health benefits, it can be difficult to discuss the typical experience of small employer businesses. To facilitate this discussion, we calculated a health insurance payroll burden for small employers in our sample. This measure is the monthly health insurance payment divided by the sum of monthly payroll and the health insurance payment. The denominator is a proxy for the monthly cost of payroll and benefits, and the ratio can be interpreted as the health insurance share of total compensation. This estimate would be closer to the upper bound of such a measure since we do not have data on the cost of other benefits.
Figure 5: Health insurance premiums were a larger share of compensation costs for smaller firms.
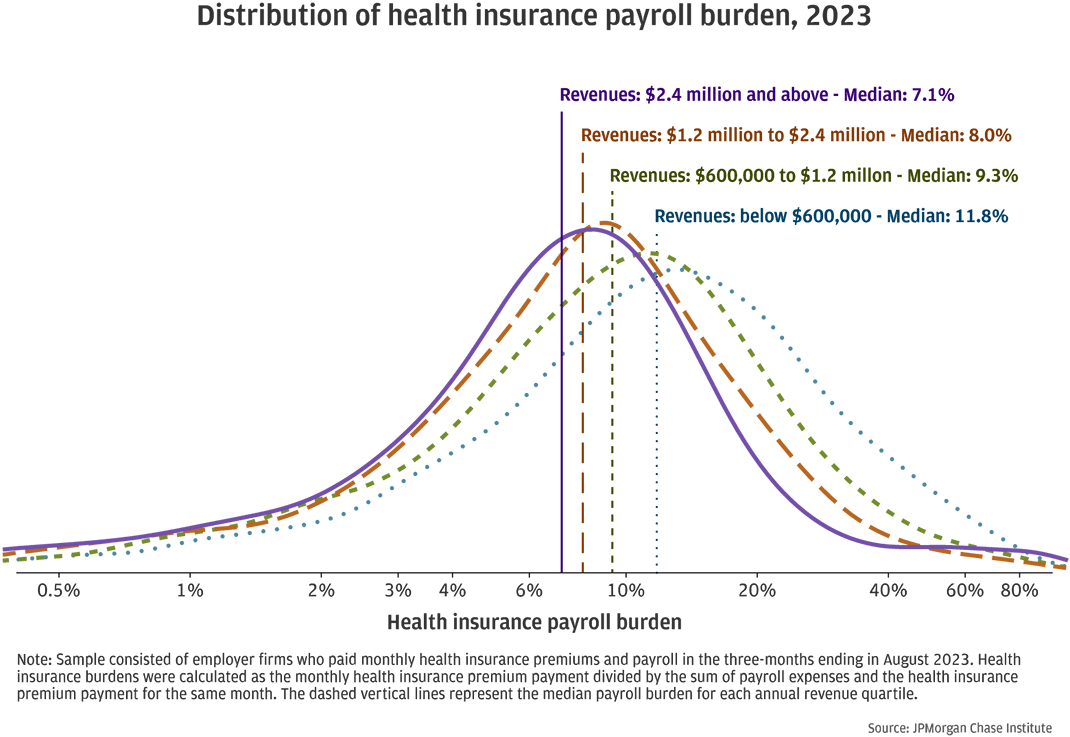
Smaller firms with fewer employees may be less able to negotiate favorable insurance premiums compared to their larger counterparts. Figure 5 shows the distributions of the health insurance payroll burden15 by revenue quartile. Among firms with less than $600,000 in annual revenues, the median health insurance payroll burden was nearly 12 percent, compared to 7 percent among firms with revenues greater than $2.4 million. The distributions also show that material shares of firms have higher burdens, implying that health insurance is a sizable cost for small employers.
In comparison, the U.S. Bureau of Labor Statistics reported that health insurance was 6.8 percent of total compensation for private industry workers in 2023 (BLS 2024). Their estimate of insurance costs (including health, life, and disability insurance benefits) for firms with 1-49 workers is 5.8 percent of total compensation and 7.1 percent for firms with 50-99 workers. Larger firms may be more likely to offer these benefits, which may result in higher estimated costs per worker because all workers are included in the cost estimates, including those that do not have access to those benefits. In contrast, our estimates in Figure 5 included only firms with health insurance. Each firm may have employees who cannot or do not participate in the health plan, but all firms in our sample made health insurance payments.
Figure 6: Businesses with fewer employees paid higher monthly premiums.
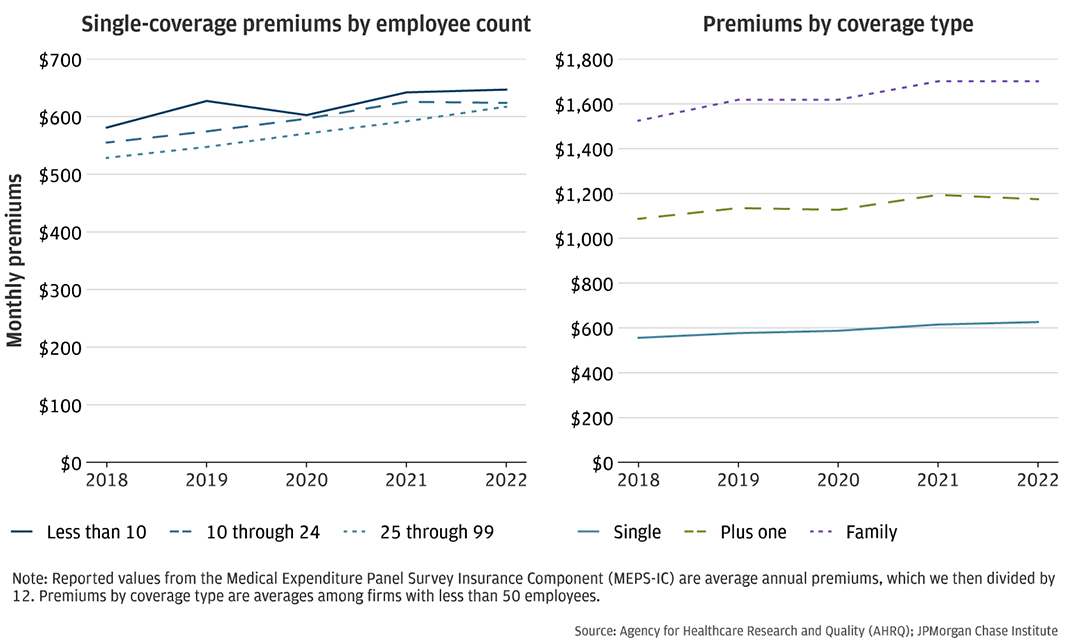
Other data sources also document higher health insurance premiums among smaller firms. The left panel of Figure 6 shows the average monthly premium for a single person plan among firms of different sizes. Firms with fewer than 10 employees paid the highest premiums. This is consistent with our finding that smaller firms, such as those with less than $600,000 in annual revenues, have higher health insurance burdens than their larger counterparts, such as those with more than $2.4 in annual revenues.
Figure 7: Health insurance premiums and payroll expenses both increased by more than 30 percent since 2018.
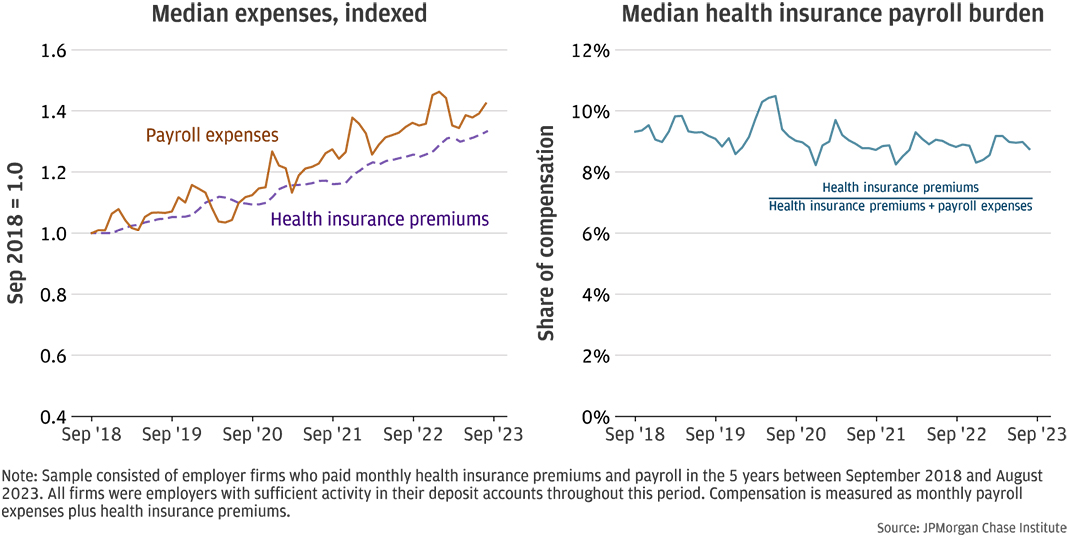
The health insurance payroll burden may vary across firms due to the mix of plans or the ability of firms to negotiate rates. However, as Figure 6 shows, average employer-sponsored health insurance premiums have increased over time for the same type of plan. Even absent premium changes, a firm’s health insurance payroll burden could vary over time as employees choose different plans or no longer choose to receive insurance through the employer, or as the workforce composition changes. Figure 7 shows how the median health insurance payroll burden changed over time for a sample of 1,863 employers that consistently made health insurance payments over five years.16
The left panel illustrates the median indexed firm-level health insurance premiums and payroll. That is, each firm’s payroll expenses and health insurance premiums were divided by their respective values at the beginning of the period so that the indexed values were 1.0 in September 2018. The values over time show the cumulative change in each series. Health insurance costs increased by 33 percent for the typical firm in the panel, while payroll increased by 42 percent, or CAGRs of 5.9 percent and 7.3 percent, respectively. For example, a hypothetical firm with monthly payroll expenses of $10,000 and health insurance premiums of $900 in 2018 would be paying $14,200 in monthly payroll and nearly $1,200 in monthly health insurance premiums in 2023. Consequently, the burden decreased slightly since 2018 and has remained relatively stable around 9 percent in the last three years. As with the health insurance expense burden for nonemployers shown in Figure 1, the payroll burden increased in early 2020 for employer firms. This may have been related to the reduction in payroll at the onset of the COVID-19 pandemic.
Increases in payroll expenses and health insurance premiums could result from increasing prices as well as quantities. For example, payroll expenses could increase as a firm raises wages or hires additional employees, or a combination of both. For context, the Employment Cost Index, which measures cost changes based on a fixed sample, showed an increase of 22 percent between 2018 and 2023.17 Similarly, health insurance payments could increase if plan premiums increase, different plans are selected, or more employees are covered. The right panel of Figure 6 shows how average monthly premiums for single, plus one, and family plans changed between 2018 and 2022. Family plans, which typically cover an employee and her family, cost about $1,700 a month in 2022, compared to about $600 for an employee-only single plan. KFF has also documented increases in both single and family plan premiums in employer-sponsored health benefits.18 For example, annual premiums for single coverage in 2023 was $8,435 and $6,896 in 2018, or $703 and $575 monthly, respectively.
Despite rising premiums, the typical firm in our longitudinal sample experienced declining health insurance payroll burdens in the last few years. This could be the result of payroll increasing at higher rates, changing workforce composition, changing plan selections, requiring workers to increase their contributions, or combinations of these and other factors that could mitigate costs.
Health insurance premiums are a material portion of total compensation expenses. Although small employers with fewer than 50 employees do not face penalties for not offering health benefits, those that do may find that the health insurance premiums are a larger share of compensation costs for the smallest firms.
In the U.S., health insurance is important for managing health care costs, and the majority of people—54.5 percent—get coverage through employer-sponsored plans (Keisler-Starkey, Bunch, and Lindstrom 2023). Small employers who want to offer health benefits to their employees may find it more burdensome compared to their larger counterparts. As policymakers and decision makers consider how to make health benefits accessible and affordable for over 9 million19 self-employed workers and the 66 million20 who work at small businesses, we offer the following implications of our findings:
Health insurance premiums are just one part of the total cost of health care.
In this report, we analyzed health insurance premiums relative to operating expenses and payroll, which are important measures of the burden small businesses face. For many small businesses and their employees, premiums may be the largest component of health care costs. However, the premium payments do not tell us about the plan deductibles or employee contributions, which are also part of the total health care costs that small businesses and their employees face, especially if some businesses manage their costs by shifting costs to their employees.
Cost is just one aspect of the health insurance burden small businesses face.
Health insurance premiums are material costs for both nonemployer and employer businesses. However, the value from these premiums, such as the quality of care received may be opaque. In addition, small businesses must navigate a complex health insurance market to find suitable health plans as well as a complex tax system of tax credits and potential penalties. Large businesses may have the staff to manage these issues, but small businesses may struggle to understand all their options. A combination of policy and product solutions could address these challenges.
Health insurance cost and availability may affect entrepreneurship and economic growth.
Lack of health insurance could dissuade potential entrepreneurs from starting businesses that could contribute to innovation and economic growth. For employer businesses, health insurance benefits are part of the total compensation required to recruit and retain the talent needed to grow their businesses. Moreover, both payroll and health insurance premium payments have grown substantially in recent years. While most small businesses may not grow large enough to impact economic growth, the business starts, growth, and exits are important for how the economy reallocates its resources. An economy without this business dynamism risks stagnation.
Our research sample included de-identified firms with Chase Business Banking deposit accounts who made regular health insurance premium payments and satisfied our activity filters. The activity criteria of at least $500 in outflows and 10 transactions in each month ensured that our analyses of health insurance payments relative to business expenses and payroll excluded dormant firms while allowing for variations of business activity.
To ensure that we were capturing regular health insurance payments, we examined firm activity using rolling three-month windows. A firm was included in the sample in a focal month if it made at least three health insurance premium payments during the last three months, and the amount of the payment was the average across the payments. This allowed for variation in timing that was still relatively consistent. For example, payments made towards the end of a short month such as February sometimes posted at the beginning of the next month, which made it appear as though the health insurance payment was twice as large in March and zero in February.
We divided our sample into nonemployers and employers based on evidence of electronic payroll and estimated annual expenses. Again, we employed rolling three-month windows to determine whether a firm had regular payroll. Firms in our employer sample showed evidence of payroll averaging at least $500 per month in at least three transactions during the three-month window. This relatively low threshold allowed for fluctuations in payroll among employers. Nonemployers did not have payroll in any of the three months and their annual expenses were under $500,000. Firms with relatively large expenses are likely employers even though we may not observe their payroll payments.
For both nonemployers and employers, we created a cross-sectional sample and a longitudinal panel of firms. Firms included in any given month in a cross-sectional sample met the criteria outlined above for the three months ending in the focal month. Firms entered and exited the sample as their circumstances changed. For example, a firm could exit the nonemployer sample if the firm began making payroll payments, if the business owner discontinued health insurance payments, or if the firm closed its deposit accounts. Consequently, the composition of the cross-sectional sample changes over time, although all included firms meet the outlined criteria.
Each longitudinal panel is a balanced panel: the sample consists of firms that meet the criteria in each month of the sample. These firms pay health insurance premiums consistently and do not transition between nonemployer and employer statuses. An advantage of these longitudinal panels is that the composition does not change over time; changes in the typical experience in these samples are not due to changes in the composition of the sample. Each firm may nevertheless undergo changes, such as increased revenue or adding more employees, but they continued to meet the criteria for paying health insurance premiums and remaining either a nonemployer or employer. Only a small fraction of nonemployers become employers (Farrell, Wheat, and Mac 2018).
The disadvantage of such panels is that relatively fewer firms can meet the criteria for every month in a period of several years. Our nonemployer panel included 1,655 firms, and our employer panel included 1,863 firms. About half of new establishments survive five to six years,21 so a five-year panel consists of firms that have survived longer than many of their counterparts. However, since businesses with fewer than 50 employees do not face penalties if they do not offer health insurance, it may be that the ones that do provide the benefit are also the ones that are more stable.
Table A1: Industry shares of each sample of small businesses paying health insurance premiums
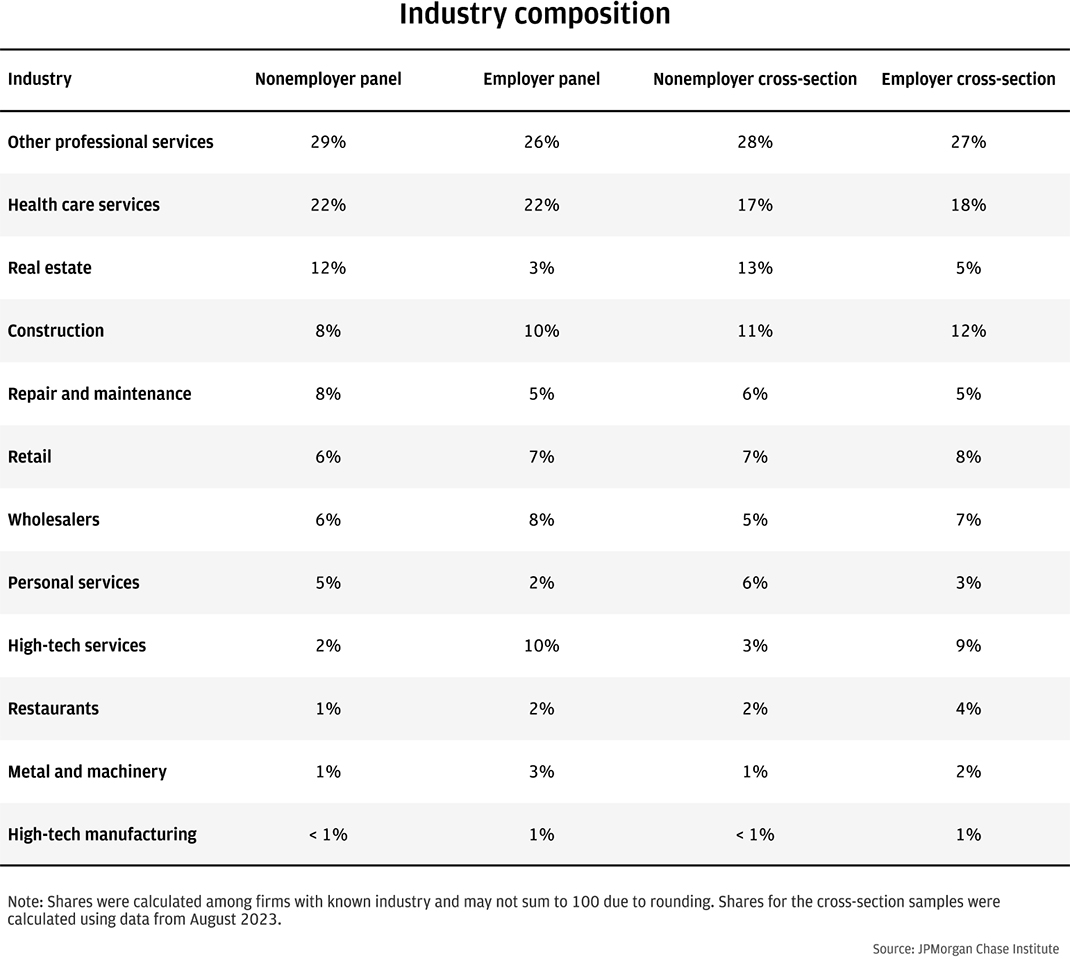
Table A1 shows the shares of each sample by industry. Professional services and health care services comprised material shares of each sample. Retail businesses and restaurants represented relatively small shares of each sample, perhaps reflecting industry practices.
The measures of health insurance payments documented in this report have not been adjusted for inflation. One reason why we chose not to do so is because it was not clear what an appropriate adjustment would be. We considered two measures: the health insurance component of the medical care Consumer Price Index (CPI) and the Employment Cost Index for health insurance. While each provides information on how health insurance has changed over time, we decided against using either for the following reasons.
Medical care index, health insurance component
The U.S. Bureau of Labor Statistics (BLS) divides the CPI into eight major groups, one of which is the medical care index, and medical care services is the largest component.22 Most of medical care services consists of hospital services and physicians’ services, and the remaining part represents health insurance. The BLS defines the health insurance CPI using a retained earnings methodology that accounts for the utilization of health benefits.23 It is not clear that this would be an appropriate deflator, and its volatility would make it difficult to interpret premiums deflated using this index.
Employment Cost Index, health insurance benefits
The BLS measures the changes in compensation with the Employment Cost Index (ECI). A health insurance benefits series shows 12-month percentage changes in health benefit costs for private industry workers. However, the BLS urges caution in using this series because of substantial nonresponse to these questions.24
“ACA Index Report on Unsubsidized Consumers.” eHealth. 2021. https://news.ehealthinsurance.com/_ir/68/20217/ACA_Unsubsidized_Index_Report_2021.pdf.
“ACA Index Report on Unsubsidized Consumers in the 2020 Open Enrollment Period.” eHealth. 2020. https://news.ehealthinsurance.com/_ir/68/20205/eHealth_2020_ACA_Index_Report_Unsubsidized_Consumers.pdf.
Claxton, Gary, Matthew Rae, Aubrey Winger, and Emma Wager. 2023. “Employer Health Benefits 2023 Annual Survey.” KFF. https://files.kff.org/attachment/Employer-Health-Benefits-Survey-2023-Annual-Survey.pdf.
“Early 2018 Effectuated Enrollment Snapshot.” Center for Medicare and Medicaid Services. 2018. https://www.cms.gov/CCIIO/Programs-and-Initiatives/Health-Insurance-Marketplaces/Downloads/2018-07-02-Trends-Report-1.pdf.
“Early 2019 Effectuated Enrollment Snapshot.” Center for Medicare and Medicaid Services. 2019. https://www.cms.gov/sites/default/files/2019-08/08-12-2019%20TABLE%20Early-2019-2018-Average-Effectuated-Enrollment.pdf.
“Early 2020 Effectuated Enrollment Snapshot.” Center for Medicare and Medicaid Services. 2020. https://www.cms.gov/CCIIO/Resources/Forms-Reports-and-Other-Resources/Downloads/Early-2020-2019-Effectuated-Enrollment-Report.pdf.
“Effectuated Enrollment: Early 2021 Snapshot and Full Year 2020 Average.” Center for Medicare and Medicaid Services. 2021. https://www.cms.gov/document/Early-2021-2020-Effectuated-Enrollment-Report.pdf.
“Effectuated Enrollment: Early 2023 Snapshot and Full Year 2022 Average.” Center for Medicare and Medicaid Services. 2023. https://www.cms.gov/files/document/early-2023-and-full-year-2022-effectuated-enrollment-report.pdf.
“Employer Costs for Employee Compensation – December 2023.” U.S. Bureau of Labor Statistics. 2024. U.S. Department of Labor News Release. https://www.bls.gov/news.release/pdf/ecec.pdf.
“Frequently Asked Questions, March 2023.” U.S. Small Business Administration. 2023. https://advocacy.sba.gov/wp-content/uploads/2023/03/Frequently-Asked-Questions-About-Small-Business-March-2023-508c.pdf.
Farrell, Diana, Christopher Wheat, and Chi Mac. 2017. “Paying a Premium: Dynamics of the Small Business Owner Health Insurance Market.” https://www.jpmorganchase.com/content/dam/jpmc/jpmorgan-chase-and-co/institute/pdf/institute-smb-health-insurance.pdf.
Farrell, Diana, Christopher Wheat, and Chi Mac. 2018. “Growth, Vitality, and Cash Flows: High-Frequency Evidence from 1 Million Small Businesses.” JPMorgan Chase Institute. https://www.jpmorganchase.com/content/dam/jpmc/jpmorgan-chase-and-co/institute/pdf/institute-growth-vitality-cash-flows.pdf.
Farrell, Diana, Christopher Wheat, Chi Mac, and Bryan Kim. 2020. “Small Business Expenses during COVID-19.” JPMorgan Chase Institute. https://www.jpmorganchase.com/institute/research/small-business/report-small-business-expenses-during-COVID-19.
Fernandez, Bernadette. 2024. “Health Insurance Premium Tax Credit and Cost-Sharing Reductions.” Congressional Research Service report R44425. https://crsreports.congress.gov/product/pdf/R/R44425.
Hait, Andrew W. 2021. “The Majority of U.S. Businesses Have Fewer Than Five Employees.” U.S. Census Bureau. https://www.census.gov/library/stories/2021/01/what-is-a-small-business.html.
Keehan, Sean P., Jacqueline A. Fiore, John A. Poisal, Gigi A. Cuckler, Andrea M. Sisko, Sheila D. Smith, Andrew J. Madison, and Kathryn E. Rennie. 2023. “National Health Expenditure Projections, 2022-31: Growth To Stabilize Once the COVID-19 Public Health Emergency Ends.” Health Affairs, Vol. 42 No. 7. https://doi.org/10.1377/hlthaff.2023.00403.
Keisler-Starkey, Katherine, Lisa N. Bunch, and Rachel A. Lindstrom. 2023. “Health Insurance Coverage in the United States: 2022.” U.S. Census Bureau. https://www.census.gov/content/dam/Census/library/publications/2023/demo/p60-281.pdf.
Ortaliza, Jared, Krutika Amin, and Cynthia Cox. 2023. “As ACA Marketplace Enrollment Reaches Record High, Fewer Are Buying Individual Market Coverage Elsewhere.” KFF. https://www.kff.org/private-insurance/issue-brief/as-aca-marketplace-enrollment-reaches-record-high-fewer-are-buying-individual-market-coverage-elsewhere/.
Wade, Holly and Madeleine Oldstone. 2023. “Small Business Health Insurance Survey.” NFIB Research Center. https://strgnfibcom.blob.core.windows.net/nfibcom/Health-insurance-survey-NFIB.pdf.
Whittaker, Julie M. 2016. “The Affordable Care Act’s (ACA) Employer Shared Responsibility Determination and the Potential Employer Penalty.” Congressional Research Service report R43981. https://crsreports.congress.gov/product/pdf/R/R43981.
We thank Lucas Nathe and Karmen Hutchinson for their hard work and vital contributions to this research, and the Morgan Health team for their partnership in the work. Additionally, we thank Oscar Cruz, Annabel Jouard, and Alfonso Zenteno for their support. We are indebted to our internal partners and colleagues, who support delivery of our agenda in a myriad of ways and acknowledge their contributions to each and all releases.
We would like to acknowledge Jamie Dimon, CEO of JPMorgan Chase & Co., for his vision and leadership in establishing the Institute and enabling the ongoing research agenda. We remain deeply grateful to Peter Scher, Vice Chairman; Tim Berry, Head of Corporate Responsibility; Heather Higginbottom, Head of Research, Policy, and Insights and others across the firm for the resources and support to pioneer a new approach to contribute to global economic analysis and insight.
This material is a product of JPMorgan Chase Institute and is provided to you solely for general information purposes. Unless otherwise specifically stated, any views or opinions expressed herein are solely those of the authors listed and may differ from the views and opinions expressed by J.P. Morgan Securities LLC (JPMS) Research Department or other departments or divisions of JPMorgan Chase & Co. or its affiliates. This material is not a product of the Research Department of JPMS. Information has been obtained from sources believed to be reliable, but JPMorgan Chase & Co. or its affiliates and/or subsidiaries (collectively J.P. Morgan) do not warrant its completeness or accuracy. Opinions and estimates constitute our judgment as of the date of this material and are subject to change without notice. No representation or warranty should be made with regard to any computations, graphs, tables, diagrams or commentary in this material, which is provided for illustration/reference purposes only. The data relied on for this report are based on past transactions and may not be indicative of future results. J.P. Morgan assumes no duty to update any information in this material in the event that such information changes. The opinion herein should not be construed as an individual recommendation for any particular client and is not intended as advice or recommendations of particular securities, financial instruments, or strategies for a particular client. This material does not constitute a solicitation or offer in any jurisdiction where such a solicitation is unlawful.
Wheat, Chris and Chi Mac. 2024. “The Burden of Health Insurance Premiums on Small Business.” JPMorgan Chase Institute. https://www.jpmorganchase.com/institute/all-topics/business-growth-and-entrepreneurship/small-business-health-insurance-burdens
See https://www.irs.gov/affordable-care-act/employers/employer-shared-responsibility-provisions for details on the ACA’s employer shared responsibility provisions.
The ACA required each state to have a health insurance exchange. Most states use the Federal marketplace at Healthcare.gov. For the 2024 plan year, there were 19 state-based exchanges and three states exchanges that used the Federal platform (https://www.cms.gov/CCIIO/Resources/Fact-Sheets-and-FAQs/state-marketplaces). We use the term “ACA marketplaces” to refer to the Federal and state-based exchanges collectively.
The median burdens of this longitudinal panel should not be directly compared to that of our 2018 report. This panel covers a longer period and includes a different set of firms. Moreover, we have improved our algorithm for estimating operating expenses based on deposit transaction outflows.
Based on the BLS Consumer Price Index inflation calculator (https://data.bls.gov/cgi-bin/cpicalc.pl?cost1=1&year1=201809&year2=202308).
We also analyzed the burdens for three- and four-year panels ending in August 2023. The sample sizes were larger, with 3,045 and 2,298 firms, respectively, but the median health insurance expense burdens were very similar during the overlapping time periods.
Based on rates quoted for health insurance for unsubsidized customers at eHealth, a health insurance broker. https://news.ehealthinsurance.com/_ir/68/20217/ACA_Unsubsidized_Index_Report_2021.pdf.
Outliers can have large effects on averages. Medians are not affected by outliers; by definition, half the values are above the median, and half are below.
KFF analysis of ACA Marketplace premiums. Data from “Average Marketplace Premiums by Metal Tier, 2018-2024,” are available at https://www.kff.org/affordable-care-act/state-indicator/average-marketplace-premiums-by-metal-tier/?activeTab=graph¤tTimeframe=0&startTimeframe=6&selectedRows=%7B%22wrapups%22:%7B%22united-states%22:%7B%7D%7D%7D&sortModel=%7B%22colId%22:%22Location%22,%22sort%22:%22asc%22%7D.
The data in Figure 3 are from KFF and presented without alteration. The data are based on KFF analysis of data from Healthcare.gov, state rate review websites, state plan finder tools, and CMS analysis of rate changes in the benchmark silver plan, October 2023. KFF’s website content is licensed under a Creative Commons Attribution-NonCommercial-NoDerivatives 4.0 International (CC BY-NC-ND 4.0) license (https://www.kff.org/permissions-citations-reprints/:~:text=Learn%20more%20about%20us.,proper%20attribution%20and%20without%20alteration).
Advance premium tax credits are based on estimated household income. Recipients must later reconcile the advance tax credits with the amount allowed based on actual income (https://www.irs.gov/affordable-care-act/individuals-and-families/premium-tax-credit-claiming-the-credit-and-reconciling-advance-credit-payments). We do not observe this reconciliation.
“Income” is based on modified adjusted gross income, which is similar to adjusted gross income for most people. The FPL amounts are higher in Alaska and Hawaii. https://www.healthcare.gov/glossary/federal-poverty-level-fpl/.
Based on data from 2018 County Business Patterns, which includes only employer businesses and is not limited to small businesses.
In the KFF survey, small firms have 3-199 employees.
The distributions shown are for the natural log of the health insurance payroll burden. The health insurance payroll burden is always greater than zero by construction.
We also analyzed the burdens for three- and four-year employer panels ending in August 2023. The sample sizes were larger, with 4,541 and 3,134 firms, respectively, but the median health insurance payroll burdens were very similar during the overlapping time periods.
The Employment Cost Index (ECI) “uses a fixed ‘basket’ of labor to produce a pure cost change, free from the effects of workers moving between occupations and industries” (https://www.bls.gov/eci/home.htm). The 22 percent growth in ECI wages and salaries represents the change between Q4 2018 and Q4 2023 (https://fred.stlouisfed.org/series/ECIWAG).
In February 2024, the BLS reported nearly 9.4 million self-employed workers in unincorporated businesses in nonagricultural industries. Self-employed workers in incorporated businesses are included in wage and salary workers. https://www.bls.gov/web/empsit/cpseea07.htm.
In 2023, 66 million were employed in firms with 1 to 499 employees in the private sector, representing 51 percent of private sector employment. Nearly 35 million, or 27 percent of private sector employment, were employed in firms with 1 to 49 employees. https://www.bls.gov/web/cewbd/table_f.txt.
For example, the BLS estimated that among the private sector establishments opened in 2018, 52 percent survived through 2023 (https://www.bls.gov/bdm/us_age_naics_00_table7.txt).
See https://www.bls.gov/cpi/factsheets/medical-care.htm for a full description of the medical care index.
See https://www.bls.gov/cpi/additional-resources/improvements-cpi-health-insurance-index.htm for details on the health insurance index.
See https://www.bls.gov/eci/factsheets/eci-health-benefits-factsheet.htm for more details.
Authors

Chris Wheat
President, JPMorganChase Institute

Chi Mac
Business Research Director