
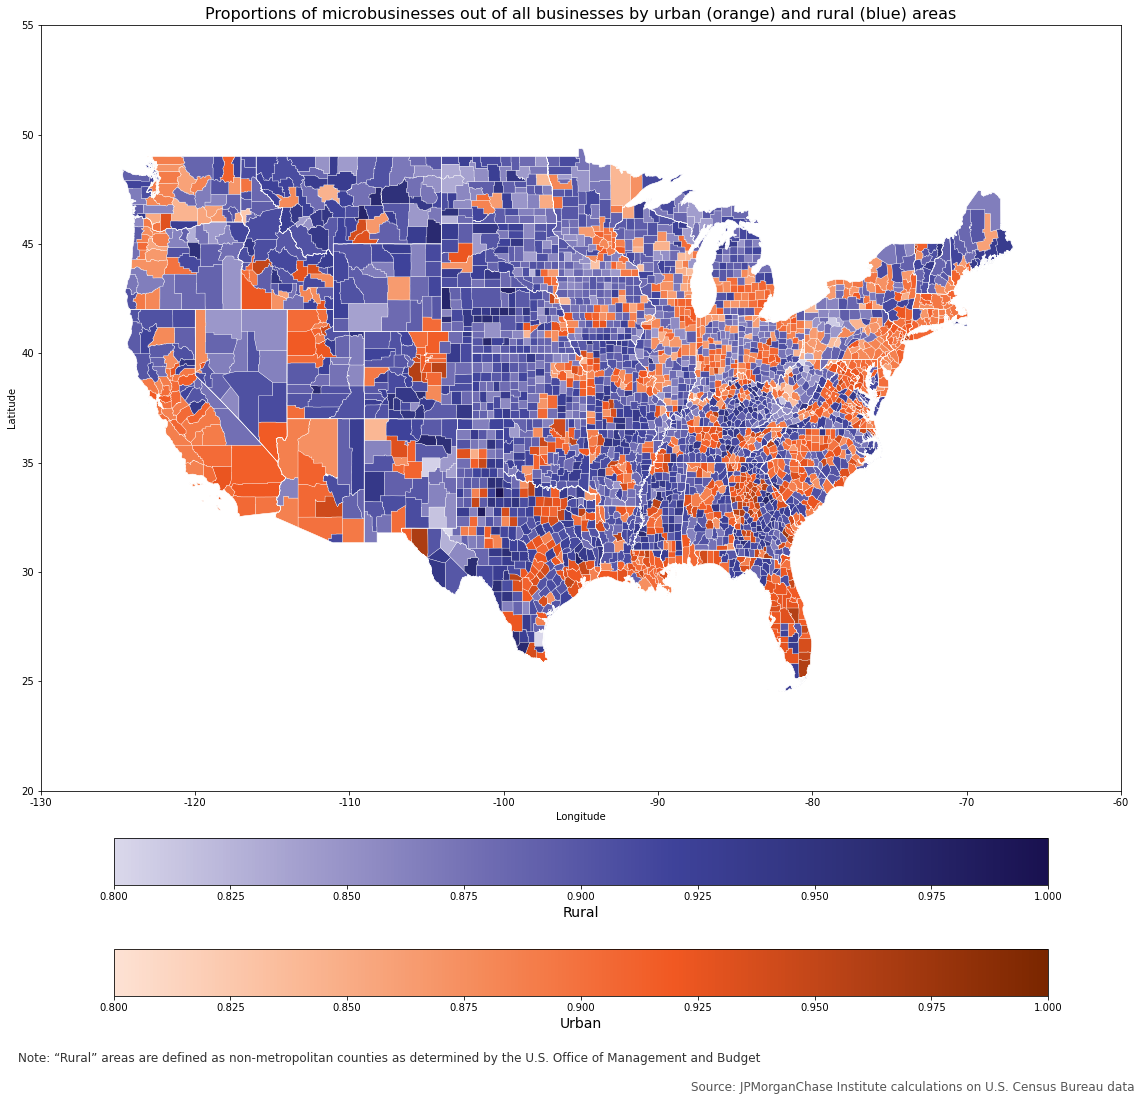
Figure 1. Microbusinesses comprise a larger share of firms in the South and Southeast.

Creating thriving communities together
See how our clients and partners—from small business owners to workforce training leaders—work with JPMorganChase to drive meaningful impact and economic growth where they live and work.
Learn moreLatest news

Veteran’s Unconventional Path to Landing her Dream Job in Tech
U.S. Army Veteran Ashley Wigfall transitioned to a civilian role and charted her path to technologist through mentorship and skills training at the JPMorgan Chase tech hub in Plano, Texas.
Learn more
Research
February 5, 2025
Rural areas depend on small businesses, which contribute significantly to local economic activity and employment, while also being involved civic actors that invest money back into the community.1 As an important component of rural life, policy makers pay particular attention to small business successes and challenges.
Healthy small business ecosystems attract and encourage entrepreneurship and support business growth. As small businesses grow, their impact on the local economy expands as they provide additional financial support and spending in the community, innovation, and new jobs. This paper focuses on how nascent small businesses in rural areas fared scaling revenues toward the often-cited milestone of $1 million in annual revenues during 2011−2020.2
Key Findings
While we did not specifically evaluate economic or policy explanations, we note our findings exist within the context of an economically challenging period for rural areas during our analytical window. In this report, we discuss policy challenges facing rural areas that may be reflected in our results after first providing an overview of where rural small businesses operate geographically and by industry, describing the unique administrative data we used to analyze revenues. We then discuss possible implications of our findings.
We first look at small business distribution and industry make-up in the U.S. Figure 1 shows the geographic location of rural (blue) and urban (orange) counties and the concentration of small businesses in those counties (depicted using a color shading scale). Due to the nature of our research question, we focused on microbusinesses (non-employer firms and small employers with fewer than five employees). We define rural areas as non-metropolitan counties as determined by the U.S. Office of Management and Budget (OMB).3
Rural areas cover a wide swath of the country, present in nearly every state, and consequently represent geographically, economically, culturally, and demographically diverse communities. These areas account for approximately 70 percent of the U.S. land mass and 14 percent of the population (as of 2020).4 Microbusinesses constitute a large share of firms in both rural and urban counties, making up 85 to 95 percent of businesses in most places.5
Figure 1. Microbusinesses comprise a larger share of firms in the South and Southeast.
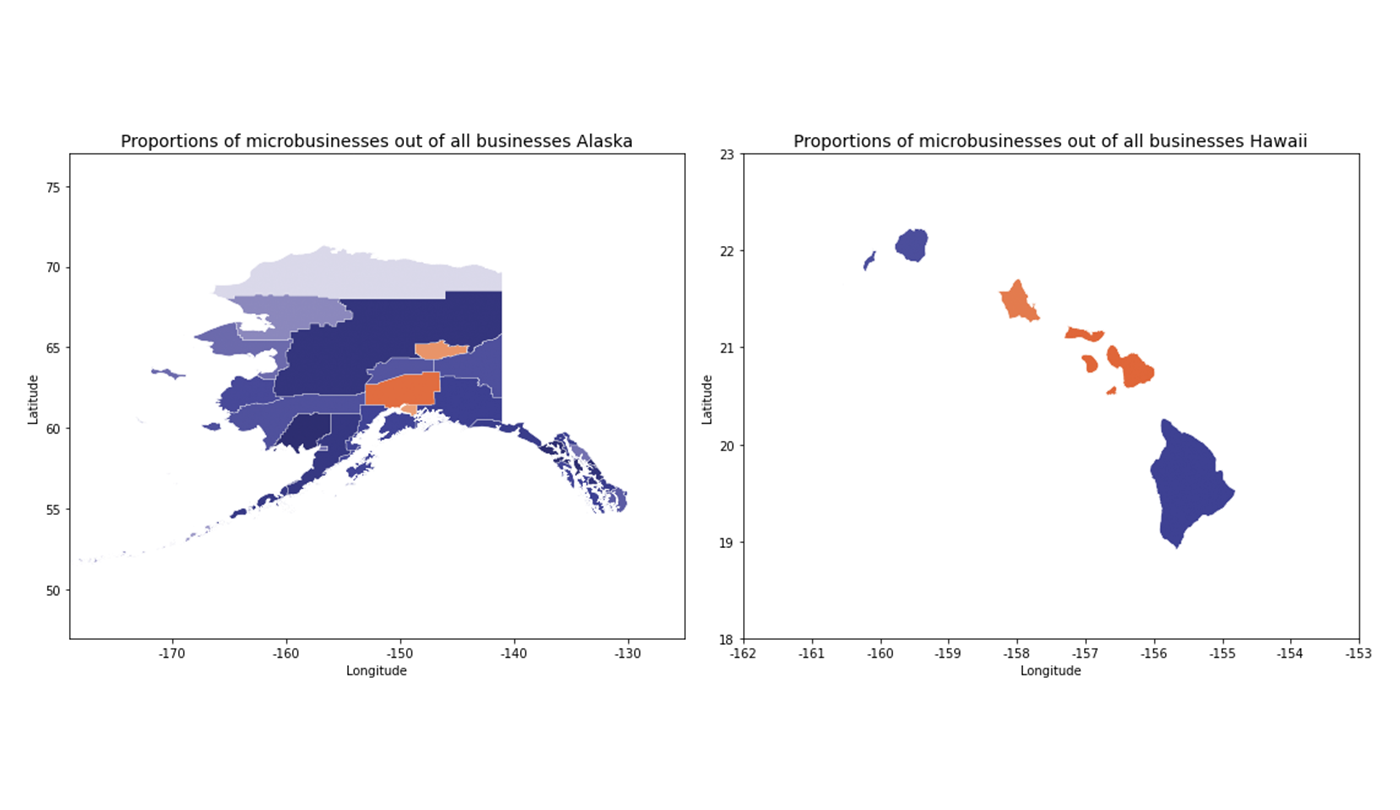
Microbusiness concentration is not uniformly distributed across the country. In fact, the presence of microbusinesses varies less across the rural-urban distinction than across states, which may be suggestive of how state-level policy variation (or other state-level characteristics) interact with microbusiness creation and/or activity relative to larger businesses.6 States in the south and southeast tend to have higher microbusiness concentration counties (visible in Figure 1 as a denser presence of darkly shaded counties), while lower microbusiness concentration counties generally are seen in states surrounding the Great Lakes and some western areas (visible in Figure 1 as a denser presence of lightly shaded counties). Microbusinesses also tend to account for larger shares of employment in rural counties than urban counties.7
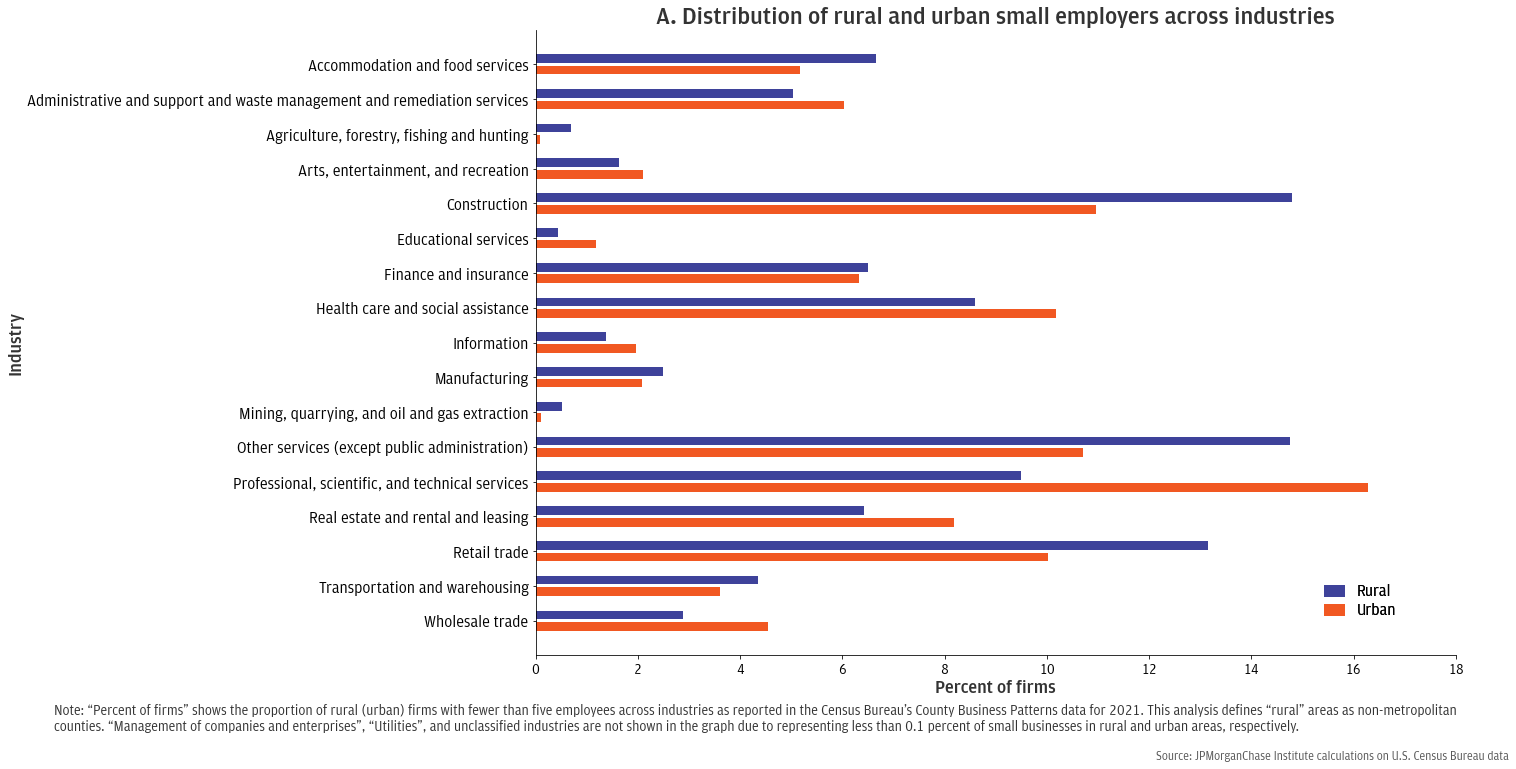
Figure 2, Panels A and B show that most microbusinesses in both rural and urban places operate in similar industries, though at slightly different concentrations. This likely reflects a combination of low barriers to entry in certain industries and differences in rural and urban labor and market demand. For example, Panel A shows that Construction, Other services excluding public administration (e.g., personal services, repair and maintenance), Retail, Professional, scientific and technical services, and Health care and social services are the most common industries of operation among small employer firms (those with fewer than five employees) in both rural and urban areas, plausibly reflecting low costs of entry in those fields. However, Construction, Other services, and Retail are more common in rural than urban areas, while Professional, scientific and technical services are more common in urban than rural areas. The latter may be the case, because there is more ample labor supply for Professional, scientific and technical services in urban areas: higher shares of the working-age adult population in urban areas have at least some post-secondary education than in rural areas, a prerequisite for many occupations in that industry.8
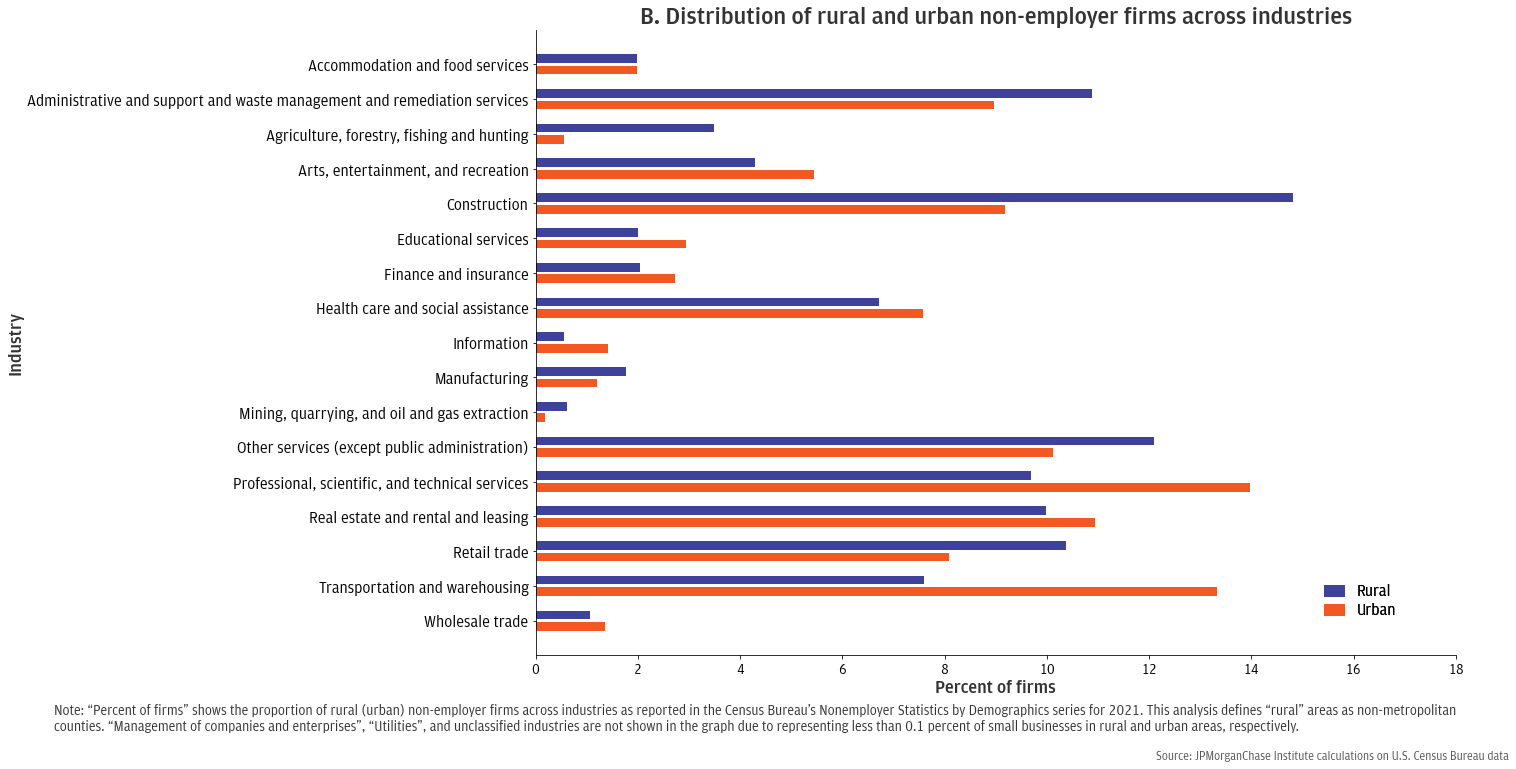
Among non-employer firms (Panel B), differences in the prevalence of industries may again highlight differences in the local labor markets and demand for different types of services. For example, urban non-employer firms are notably more concentrated in Professional, scientific, and technical services and Transportation and warehousing than rural non-employers, the latter possibly reflecting differences in market demand (e.g., higher demand for ride/transportation services in dense urban areas).
While rural areas are known for historically having more employment in industries such as Agriculture, forestry, fishing and hunting, Manufacturing, and Mining, quarrying and oil and gas extraction, Figure 2 demonstrates that regional specialization in those industries has less of an influence on the operation of microbusinesses, which necessarily operate in industries where fewer employees are necessary and barriers to entry are limited.9
Figure 2. Microbusinesses tend toward certain industries, though differences in industry shares between rural and urban areas may reflect differences in labor and/or market demand.
For our revenue analysis, we leveraged de-identified business banking administrative data to track the annual revenues of nascent small businesses from the beginning of their business banking activity (we treated this as a firm’s start of business) through the first five years (or total years, for firms that did not survive five years). We required firms to show a certain amount of financial activity to qualify for our sample and removed firms that had industry or financial characteristics that suggested they were not small businesses.10 Further, to allow us to identify whether firms operated in rural or urban areas, we required businesses in our data to operate only in either rural or urban areas. During the relatively stable U.S. business environment of January 2011 through February 2020 that followed the Great Financial Crisis and preceded the COVID-19 pandemic, this resulted in a sample of nearly 810,000 firms.
We defined “rural” areas as economically distinct from urban areas based on the combination of non-metropolitan counties as determined by the U.S. OMB, and non-metropolitan rural-urban commuting areas as determined from the U.S. Department of Agriculture’s Economic Research Service (ERS).11 This resulted in designating roughly 784,000 firms in our data as urban microbusinesses and 25,000 as rural microbusinesses.
Due to the nature of our sample’s design, our data are rich, but should not be considered nationally or regionally representative. Especially in the case of rural firms, which are known to predominantly bank with community and local banks, there may be aspects of self-selection into our sample that cause it to be non-representative.12 Despite this shortcoming, we believe our unique lens on revenue performance still provides a valuable first look at young rural businesses. Analyses accounting for geographic region and industry of operation also help explain some potential selection bias sources in our sample.
The share of rural firms that reached $1 million in revenues during their first five years was lower than urban firms.
Figure 3 shows rural firms in our sample had lower incidence of reaching $1 million in revenues than firms located in urban areas during each of the first five years of business, with a total of 6.0 percent of rural firms and 8.6 percent of urban firms in our sample reaching that milestone over the time period.13
Figure 3. Rural microbusinesses reached $1 million in revenues at lower rates than urban firms during each of the first five years.

It could be the case that the rural firms in our sample achieved similar levels of complexity and maturity as urban firms, but their revenues appear smaller due to differences in the prices of goods and services that rural firms transact relative to urban firms. For example, regional differences in purchasing power combined with differences in the regional distributions of rural and urban firms in our sample may create differences in the incidence of $1 million revenues. Alternatively, differences in the industrial composition of rural and urban firms in our sample could combine with inter-industry revenue to result in rural-urban differences in the incidence of $1 million revenues. We investigated each of these possibilities in turn.
Rural firms reached $1 million in revenues at lower rates than urban firms across each region of the country.
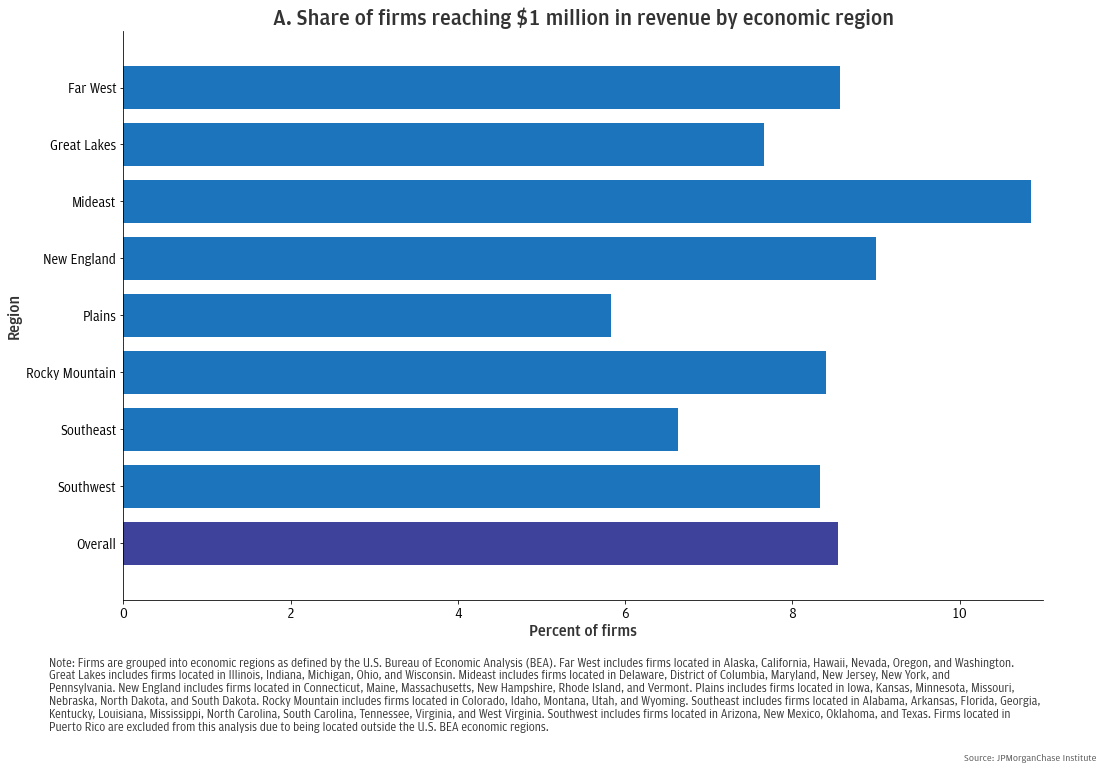
Figure 1 shows rural and urban areas distributed differently across the U.S., and the regional distributions of rural and urban small businesses also differ.14 Given differences in price levels across states and other geographies, accounting for a firm’s regional economy may help explain some of the rural-urban differences observed in Figure 3.15 Indeed, Figure 4 shows the variation in the share of firms in our sample that reached $1 million in revenues across different economic regions of the country (as defined by the U.S. Bureau of Economic Analysis or “U.S. BEA,” see Figure 4, Panel A). The share of firms in each economic region that reached $1 million in revenues was highly correlated with an approximation of a regional price index, suggesting that local prices may be an important factor in explaining our results.16
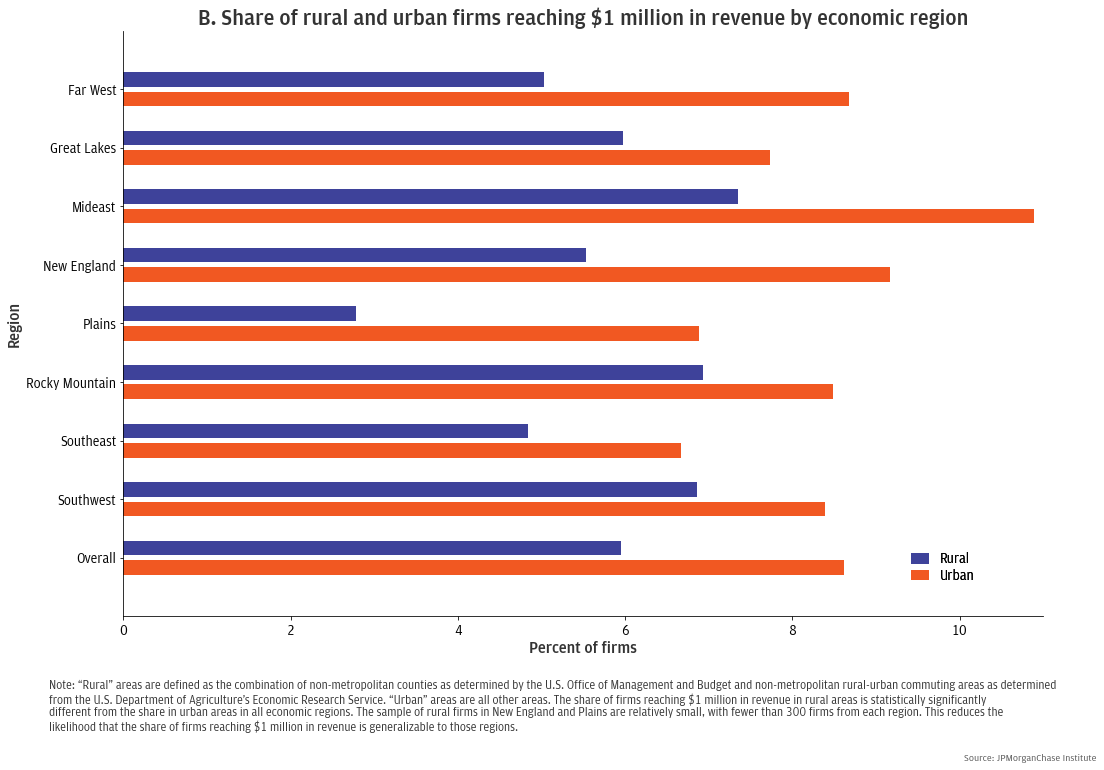
Comparing rural and urban firms within economic regions, Panel B, Figure 4 maintains that a smaller share of rural firms than urban firms in our sample reached $1 million in revenues. Given that rural prices tend to be lower than urban prices, we cannot entirely rule out the role of price levels in attaining $1 million revenues, although there was only a weak correlation between regional rural/urban price parities and the share of regional rural/urban firms reaching $1 million in revenues in our sample.17
Figure 4. A smaller share of rural firms reached $1 million revenues than urban firms, even as the share of firms reaching $1 million in revenue varied by economic region.
Within industries, the share of rural firms that reached $1 million in revenues was smaller than urban firms.
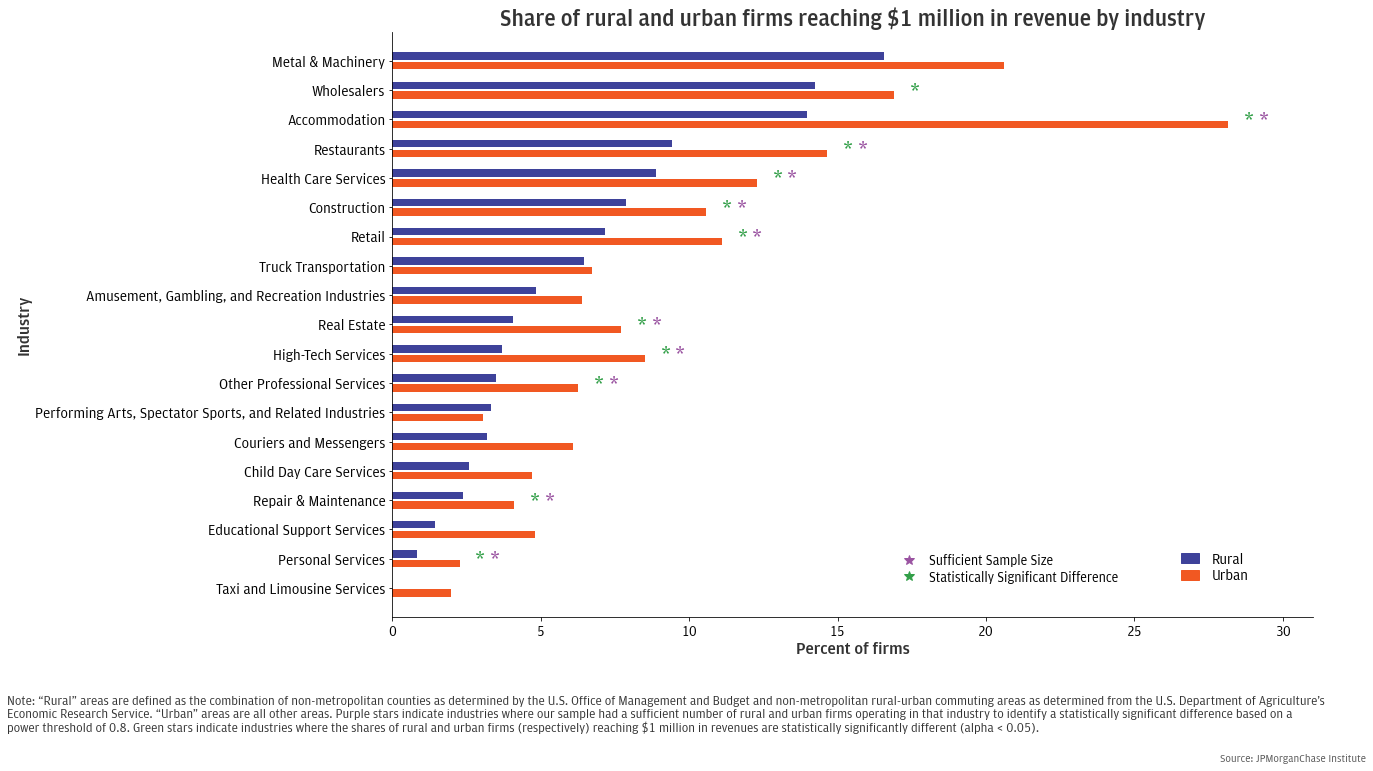
Figure 2 shows that although rural and urban microbusinesses generally operate in the same industries, there are some differences in how concentrated small businesses are across those industries. Figure 5 demonstrates that rural firms reached $1 million in revenues less frequently than urban firms in almost every industry represented. Not all industries had sufficient representation of rural firms to confirm that the share of rural firms reaching $1 million in revenues was significantly, statistically different from the share of urban firms. However, we found that the difference in the share of rural and urban firms reaching $1 million in revenues was statistically significant in all industries where sufficient test power was present, as well as among wholesalers.18 This suggests that rural and urban firms would have different incidence of reaching $1 million in revenues, even if the industry composition of firms in both types of markets was the same.19
Figure 5. Rural firms reached $1 million in revenues at lower rates than urban firms operating in the same industries.
Rural firms generally saw less revenue growth during the first five years than urban firms.
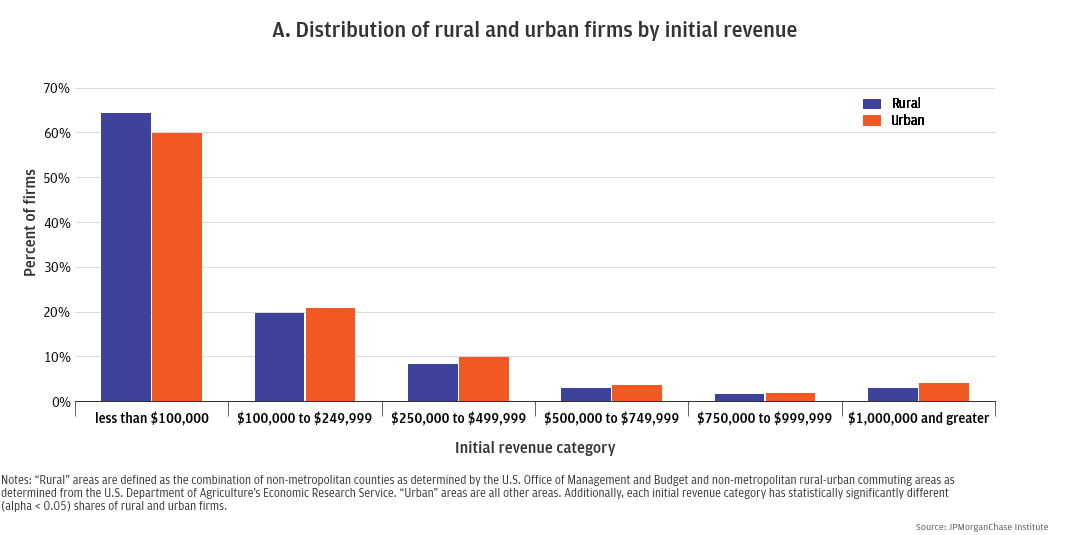
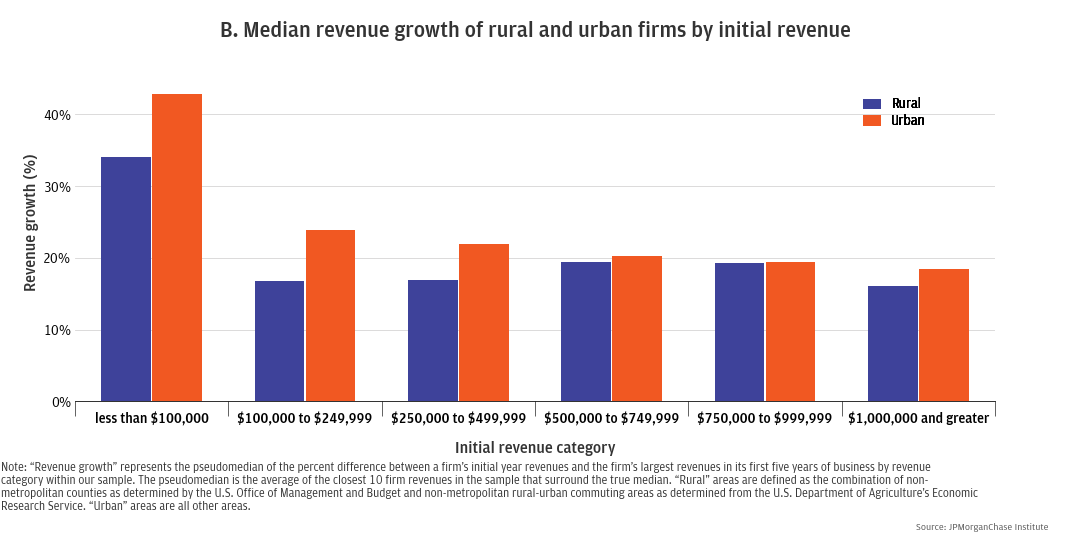
While the above analyses show that a smaller share of rural firms reached $1 million revenues than urban firms in our sample across economic regions and industries, they do not address revenue growth. To investigate this question, we calculated the maximum growth in revenue for each of the firms in our sample as the percent difference between the firm’s initial revenues and its largest annual revenues during the first five years of business. Figure 6 shows that rural microbusinesses tended to start with smaller revenues in their first year than urban firms (Panel A) and also tended to have smaller changes in their annual revenues during the first five years in business (Panel B).20
Figure 6. Rural firm revenues tended to start smaller and grow less than urban firm revenues.
Taken together, our findings reveal a tendency toward lower revenues and lower revenue growth among rural firms when compared to urban firms within the same economic region and industry. While our analysis covered January 2011 through February 2020, analyses of the most recent available data from the Small Business Credit Survey (2023) suggests similar trends: in those data, a smaller share of small rural employer firms had revenues greater than $1 million (23 percent) than urban small employers (33 percent), and the rural-urban difference was larger than during our analysis period.21
While beyond the scope of this paper to identify the economic and policy explanations for our results, we note our findings occurred within the context of an economically challenging period for rural areas relative to urban areas. During that time, rural areas saw a decline of working-age adults in response to reductions in labor demand from industries previously important to rural employment such as agriculture, manufacturing, and natural resource extraction.22 The decline of the working-age population in a community can challenge small business growth in multiple ways: a smaller labor force can make it difficult for microbusinesses seeking to expand to find suitable workers, smaller market demand creates sales challenges, and a smaller tax base can weaken local government financing for community infrastructure (as a result of reduced tax revenues), creating challenges for the entire business ecosystem. In addition, during that time period, rural adoption of broadband lagged behind urban areas, even as economic activity increasingly became intertwined with internet connectivity and technology.23
Many of the above challenges regarding population shifts in rural areas persist today: although rural areas saw net population growth in recent years, this was largely driven by the movement of older adults to communities with recreation and retirement amenities, accelerating the trend of aging demographics in rural areas relative to the working population.24 However, recent improvements in rural broadband access also point to opportunity. Improving access to broadband resources can strengthen the local labor force available to employers by providing access to educational and professional skills training and providing opportunities to attract a larger talent pool, can connect rural small businesses to markets beyond their immediate communities, and can help small businesses leverage technological resources to support their business operations.25 Broadband connectivity may also support rural small business start-up rates.26
Other place-based policies can help policymakers support rural communities in ways that will, in turn, benefit rural small businesses. Investments in affordable housing, community infrastructure and resources, educational and professional skills training, and broadband connectivity can help rural communities incentivize and retain working-age adults. Affordable housing and community amenities can attract young adults to rural communities and support residential stability.
Additionally, policymakers may consider interventions and resources that will help support the coming wave of small business ownership transitions in rural economies. As discussed, rural small businesses are important institutions in their communities, and many are more than 20 years old (e.g., 32 percent of rural small employer firms).27 Policies that support ownership transitions and allow small businesses to remain in their communities under local ownership can help support stability for the small business ecosystem and the community at large.
While succession planning is an important issue for small businesses across the country (55 percent of small employer primary owners are 55 years old or older), it is especially pressing for rural areas, where a larger share of owners are 65 years old or older (25 percent of rural small employer firms versus 21 percent of urban small employer firms).28
Last, policymakers should monitor access to rural small business financing, as many small banks—historically a primary financing source—have consolidated.29 While there is mixed evidence regarding the impact of bank consolidation on credit availability for rural small businesses, research does show that small businesses are more likely to receive funding from small banks.30 If the trend of bank consolidation and branch closure continues in rural areas, it will be important for policymakers to evaluate how small business financing is impacted.
While the above policy areas should not be considered an exhaustive set for policymakers to consider when contemplating how to support small business growth in rural areas, it is important to note that the above discussion generalizes the condition and changes faced by rural communities. Rural communities are diverse and deserve solutions customized to local needs. Localized solutions should tailor interventions to meet the needs of each community and help identify opportunities for small businesses to leverage local assets and resources to succeed.
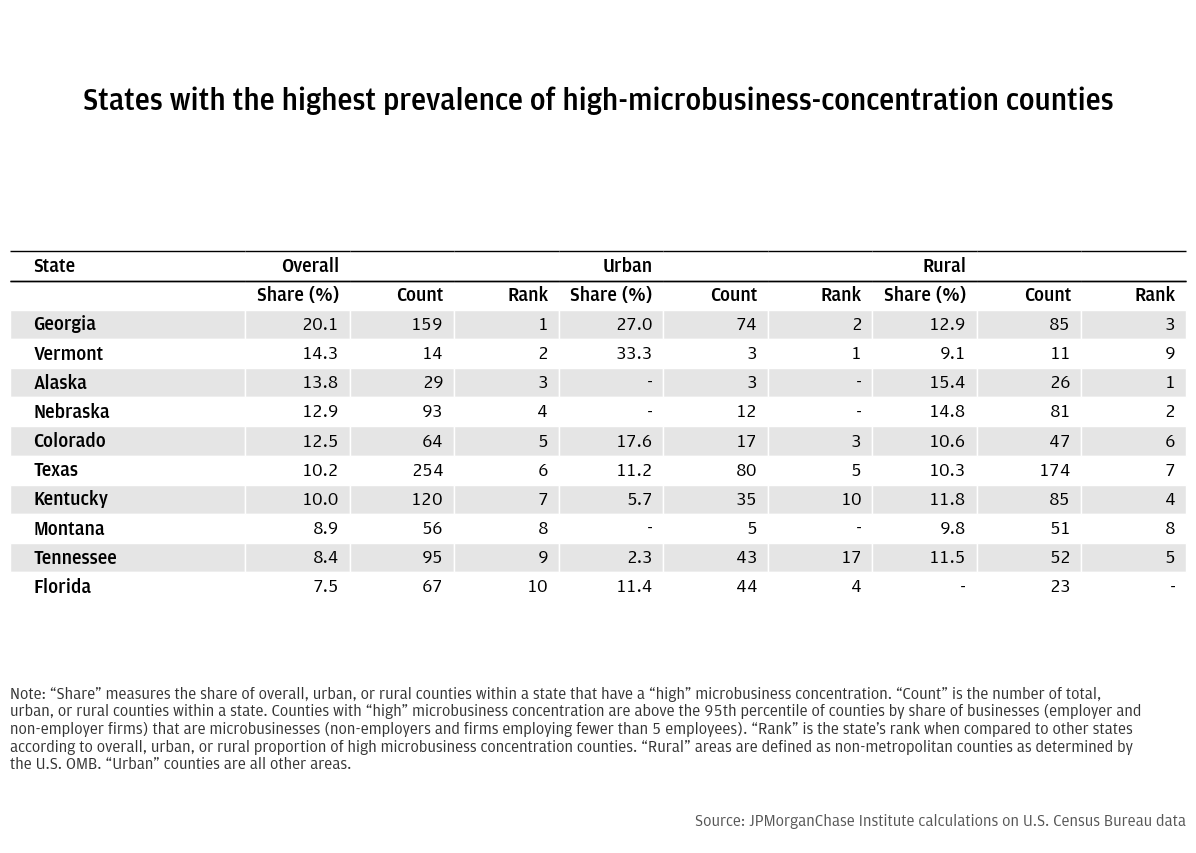
Appendix Table 1. The 10 states where microbusinesses most strongly dominate county markets have a dominant presence in both urban and rural areas.
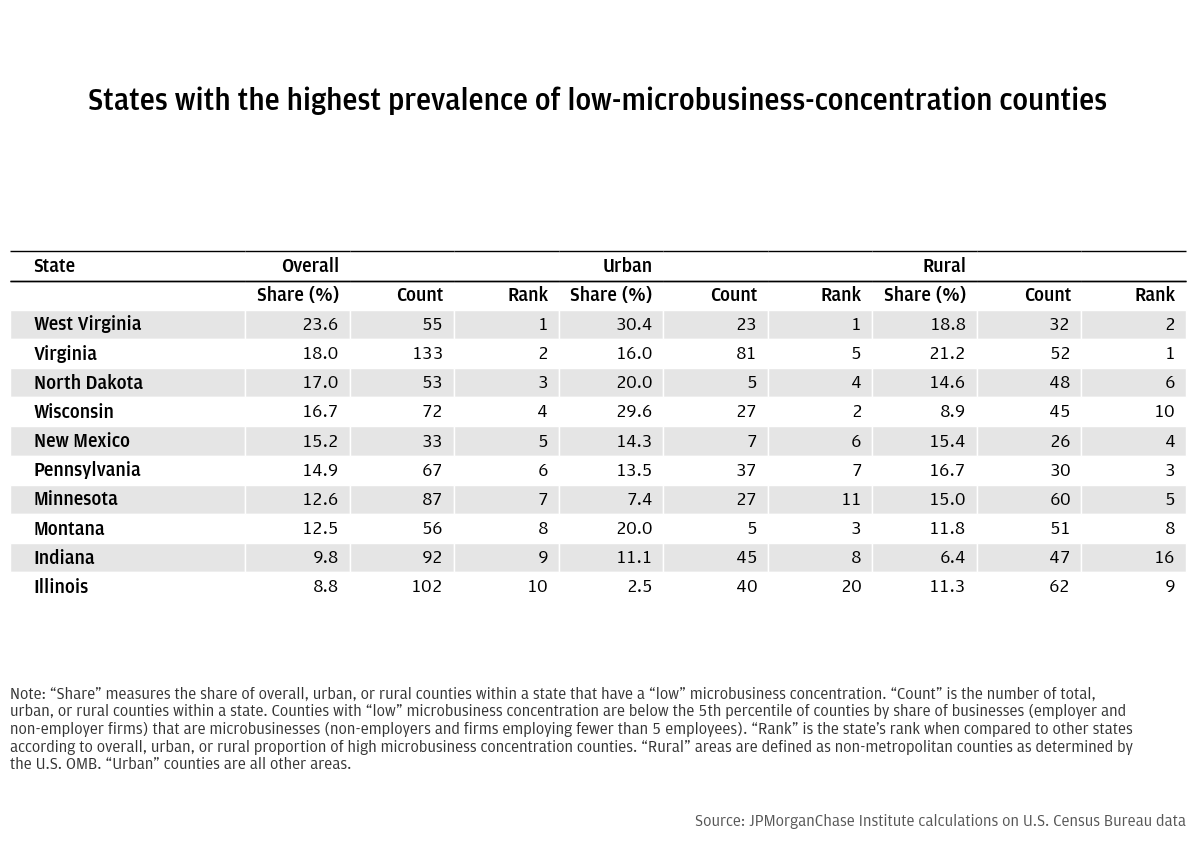
Appendix Table 2. The 10 states where microbusinesses are the least dominant in county markets have low presence in both rural and urban areas.
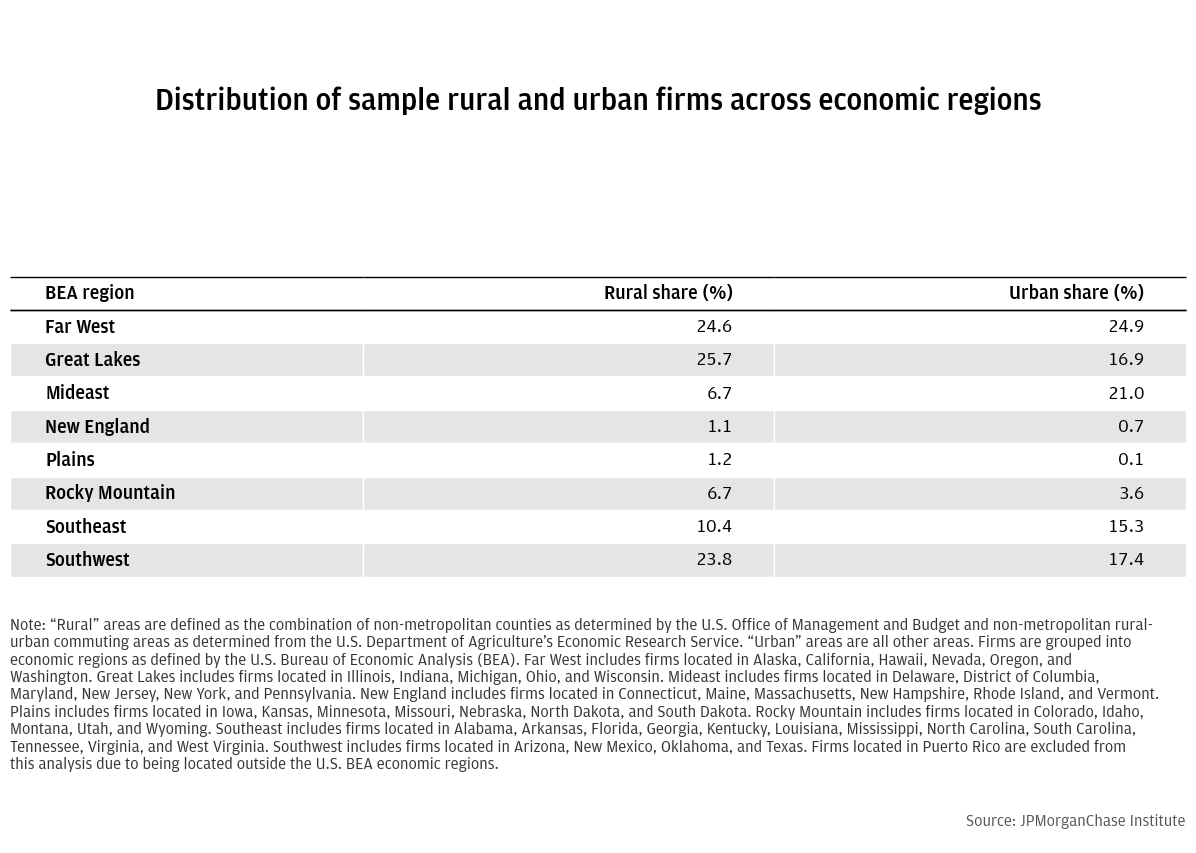
Appendix Table 3. Rural firms in our sample were less concentrated in the Mideast than urban firms.
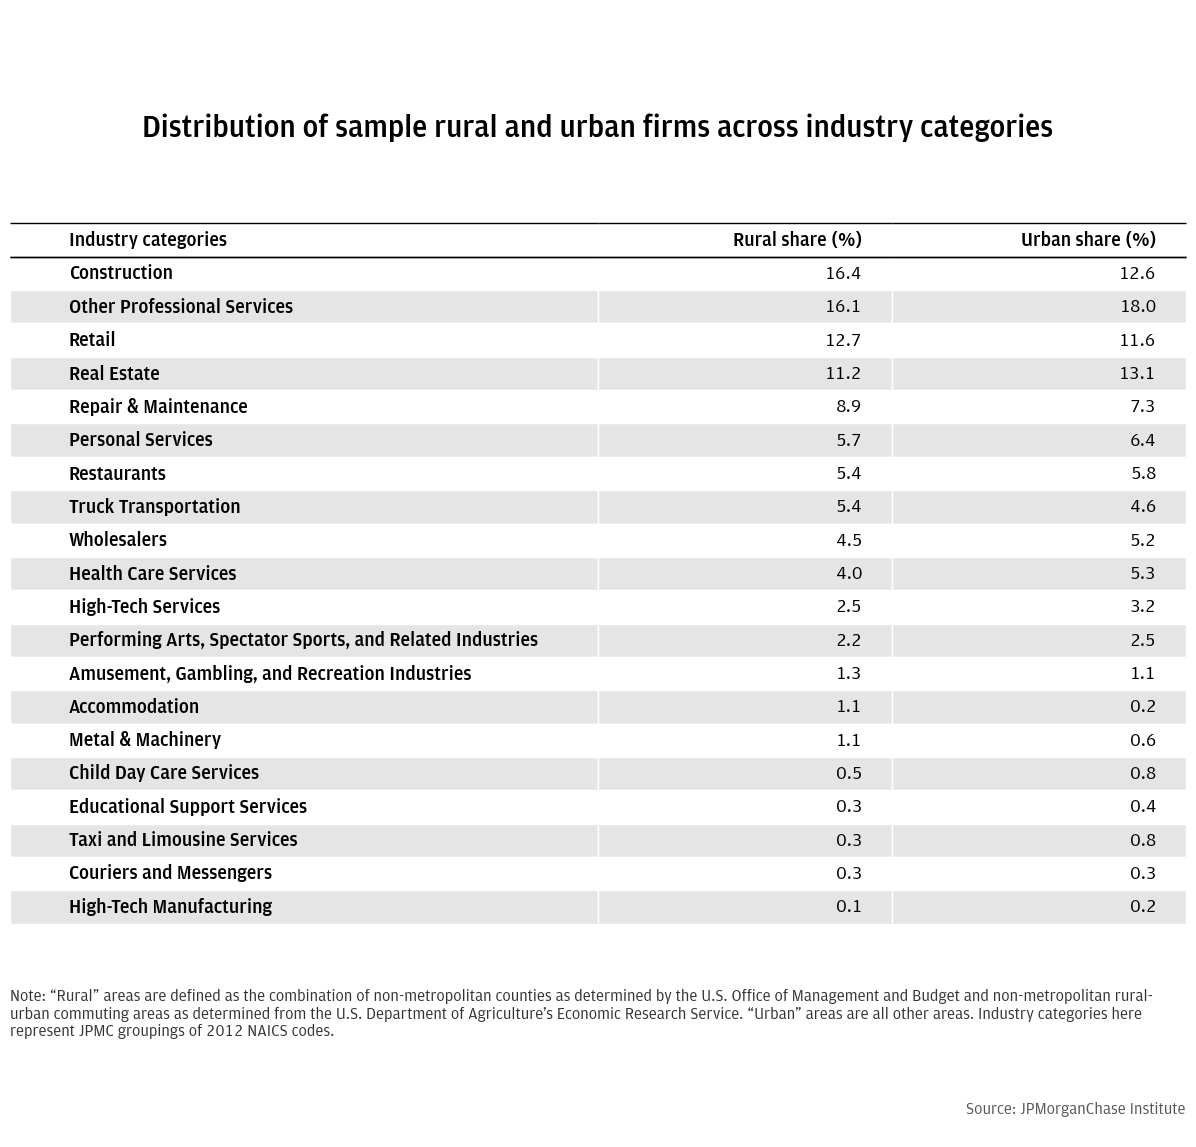
Appendix Table 4. Prevalence of industries of operation among firms in our sample generally mimic those in national data.
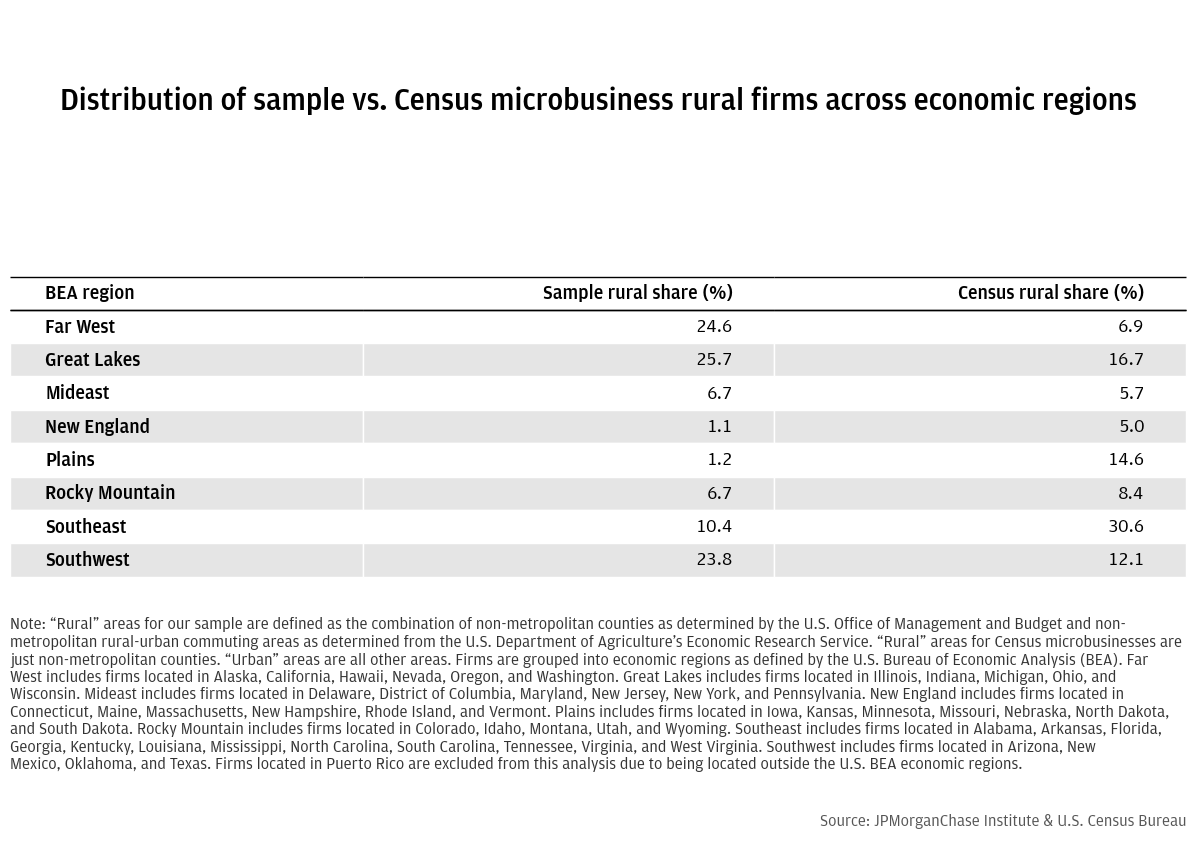
Appendix Table 5. Rural firms in our sample were more heavily distributed in the Far West, Great Lakes, and Southwest U.S. BEA regions than in the Census.
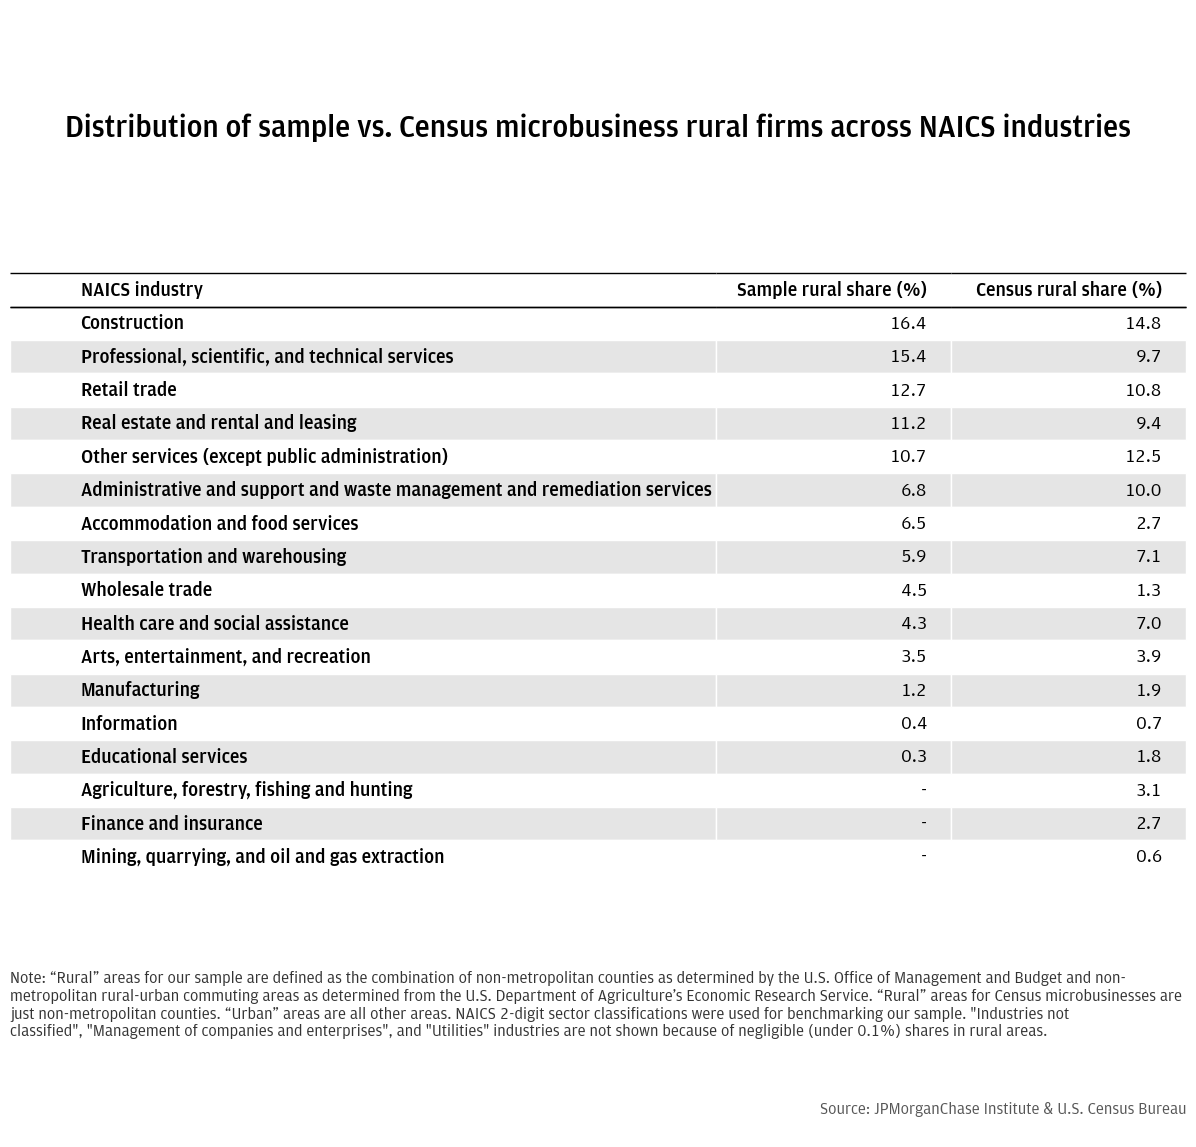
Appendix Table 6. Rural firms in our sample were more heavily distributed in Real estate and Professional scientific and technical services industries than in the Census.
We thank fellow JPMorganChase Institute researchers, especially Michael Vaden and Laura Wilcox for their hard work and contributions to this research. We also thank Alfonso Zenteno, Julia Decerega, Chris Crossen, and Chris Wong for their support. We are indebted to our internal partners and colleagues, who support delivery of our agenda in a myriad of ways, and acknowledge their contributions to each and all releases. We would like to acknowledge Jamie Dimon, CEO of JPMorganChase & Co., for his vision and leadership in establishing the Institute and enabling the ongoing research agenda. We remain deeply grateful to Peter Scher, Vice Chairman, Tim Berry, Head of Corporate Responsibility, Heather Higginbottom, Head of Research, Policy, and Insights, and others across the firm for the resources and support to pioneer a new approach to contribute to global economic analysis and insight.
“Table of Small Business Size Standards.” Small Business Administration, March 2017. https://www.sba.gov/sites/sbagov/files/2023-06/Table%20of%20Size%20Standards_Effective%20March%2017%2C%202023%20%282%29.pdf.
Beiseitov, E. 2023. Small banks, big impact: Community banks and their role in small business lending. Federal Reserve Bank of St. Louis. October 2023. https://www.stlouisfed.org/publications/regional-economist/2023/oct/small-banks-big-impact-community-banks-small-business-lending
Board of Governors of the Federal Reserve System. 2019. Perspectives from main street: Bank branch access in rural communities. November 2019. https://www.federalreserve.gov/publications/files/bank-branch-access-in-rural-communities.pdf
Conroy, T. and S. A. Low. (2021). Entrepreneurship, broadband, and gender: Evidence from establishment births in rural America. International Regional Science Review. Vol. 45: 1. https://doi.org/10.1177/016001762110187
Deller, S., B. Whitacre, T., and T. Conroy (2021). Rural broadband speeds and business startup rates. American Journal of Agricultural Economics. Vol. 104:3, 999-1025. https://doi.org/10.1111/ajae.12259
Dumont, A. 2024. Changes in the U.S. Economy and Rural-Urban Employment Disparities. FEDS Notes. Board of Governors of the Federal Reserve System. January 2024. https://www.federalreserve.gov/econres/notes/feds-notes/changes-in-the-us-economy-and-rural-urban-employment-disparities-20240119.html#:~:text=In%20the%20United%20States%2C%20long,nonmetro%20communities%20than%20metro%20ones.
Farrigan, T., Genetin, B., Sanders, A., Pender, J. ,Thomas, K. L., Winkler, R., & Cromartie, J. (2024). Rural America at a glance: 2024 edition (Report No. EIB-282). U.S. Department of Agriculture, Economic Research Service.
Federal Reserve Banks, 2016 Small Business Credit Survey. Report on Rural Employer Firms. December 2017. Retrieved from https://www.richmondfed.org/-/media/richmondfedorg/community_development/resource_centers/small_business/pdf/credit_survey/sbcs_report_rural_employer_firms_2016.pdf.
Federal Reserve Banks, Small Business Credit Survey. 2024 Firms in Focus: Chartbook on Rural and Urban Firms. Retrieved from https://fedsmallbusiness.org. 10.55350/sbcs-20240531.
Fikri, Kenan (2021). Resorting well-being and entrepreneurship in rural America. Investing in Rural Prosperity, edited by Andrew Dumont and Daniel Paul Davis. Federal Reserve Bank of St. Louis, Board of Governors of the Federal Reserve System. Chapter 6. https://www.stlouisfed.org/-/media/project/frbstl/stlouisfed/files/pdfs/community-development/investing-rural/chapters/chapter06.pdf
Johnson, K. (2022). Rural America lost population over the past decade for the first time in history. University of New Hampshire. February 22, 2022. https://carsey.unh.edu/publication/rural-america-lost-population-over-past-decade-first-time-history
Suutari, et al. (2023) “Doing well and doing good? Small rural businesses’ performance and responsibility towards local communities.” Journal of Rural Studies. Vol. 102: August 2023. https://www.sciencedirect.com/science/article/pii/S0743016723001638.
Symens Smith, Amy and Edward Trevelyan. 2019. The older population in Rural America: 2012-2016. American Community Survey Reports ACS-41. U.S. Census Bureau. December 2019. https://www.census.gov/content/dam/Census/library/publications/2019/acs/acs-41.pdf
U.S. Department of Agriculture, Economic Research Service. Educational attainment improved in rural America but educational gap with urban areas grew for bachelor’s degrees and higher. March 2023. https://www.ers.usda.gov/data-products/chart-gallery/gallery/chart-detail/?chartId=106147
U.S. Department of Agriculture, Economic Research Service. What is Rural? March 2024. https://www.ers.usda.gov/topics/rural-economy-population/rural-classifications/what-is-rural/
U.S. Department of Health & Human Services. Defining rural population. June 2020. https://www.hhs.gov/guidance/document/defining-rural-population
Wilmoth, D. 2023. Small business facts: Small businesses in rural areas. U.S. Small Business Administration. August 2023. https://advocacy.sba.gov/wp-content/uploads/2023/08/Fact-Sheet-Small-Business-in-Rural-Areas-508c.pdf
Zhao, Lorien (2023). How the digital divide affects America’s rural small businesses. Federal Reserve Bank of Cleveland. Notes from the Field. September 2023. https://www.clevelandfed.org/publications/notes-from-the-field/2023/nftf-20230907-how-the-digital-divide-affects-americas-rural-small-businesses
Footnotes
The U.S. Small Business Administration found that businesses with fewer than 500 employees accounted for approximately 85 percent of establishments in rural counties and over 50 percent of employment (Wilmoth 2023). Suutari, et al. (2023) describes the role that small businesses play in rural areas.
See, e.g., Aspen Institute (2017), Stanford Latino Entrepreneurship Initiative (2016). While this report focusses on firm size measured by revenues, the analyses presented here should be considered only one dimension of business health and potential. For example, our metric of firm scale focusses on revenue size but disregards stability of revenues and business sustainability, which are additional dimensions of business growth and health. Small business health is a multidimensional concept and may include metrics of liquidity and financial management, access to credit and insurance, and debt management, among other things.
The publicly-available data used for this analysis did not allow us to differentiate firms by business age, so we approximated early stages businesses by focusing on non-employer and small employer firms.
https://www.hhs.gov/guidance/document/defining-rural-population, https://www.ers.usda.gov/topics/rural-economy-population/rural-classifications/what-is-rural/.
We calculated the county-level concentration of microbusinesses as the share of all employer and non-employer firms that are either non-employers or employ fewer than 5 employees.
To assess what areas of the country have “high” and “low” microbusiness concentration, we defined “high” microbusiness concentration by the 95th percentile of microbusiness concentration in rural and urban counties (94 percent, respectively) and the 5th percentile of microbusiness concentration (approximately 5 percent in rural and urban counties, respectively) to represent a “low” level of concentration. We then ranked states according to the share of rural and urban counties, respectively, that had a high or low level of microbusiness concentration. Microbusiness concentration does not vary greatly within states: states that had the highest shares of high microbusiness concentration rural counties also tended to have the highest shares of high microbusiness concentration urban counties, with a similar consistency among states with low microbusiness concentration counties. See Appendix Tables 1 and 2 for details.
Figure 1 does not depict our employment analysis. We estimated the total number of jobs in a county by summing the total number of employees reported in the U.S. Census Bureau’s County Business Patterns (CBP) series with the number of employer firms in County Business Patterns and the number of non-employer firms as reported in the U.S. Census Bureau’s Non-employer Statistics by Demographics (NES-D) series. This essentially includes firm ownership among jobs, assuming that all firms (non-employer and employer) have one owner. We estimated the number of jobs in a county attributable to microbusinesses as the total number of employees working for employer firms with fewer than five employees as reported in the U.S. Census Bureau’s CBP series added to the number of microbusinesses in that county (again assuming one owner per firm).
Dumont (2024), https://www.ers.usda.gov/data-products/chart-gallery/gallery/chart-detail/?chartId=106147.
Farrigan, et al. (2024).
We required firms to 1) survive for at least one full year, 2) have at least 10 total transactions (inflows or outflows) and $500 total outflows in at least three months in any 12-month period during our analytical window, 3) not have operated in more than one industry during any given month or in an industry suggestive of a not-for-profit business, 4) have opened its first account with Chase between January 1, 2011 and February 28, 2015, and 5) never have had an end-of-month balance greater than $20 million during our analytical window.
We considered any ZIP-code tabulation area (ZCTA) within a non-Metropolitan county as determined by the OMB to be rural. The OMB delineates Core-Based Statistical Areas (CBSAs) as Metropolitan if they contain an urban area with at least 50,000 inhabitants. Additionally, we used rural-urban commuting area (RUCA) codes from the U.S. Department of Agriculture ERS to designate any ZCTA with no primary commuting pattern to a Metropolitan area as rural (i.e., ZCTAs with an RUCA code of four or higher).
See the Appendix for more detail on how our sample benchmarks to the regional and industry distribution of microbusinesses in rural areas.
In the first two years of business, this result is not explained by differential year-to-year survival rates of rural and urban firms: the survival rates of firms in rural and urban areas were the same in those initial years (approximately 75 percent of firms survived into a third year), even while the rates of reaching $1 million in revenue differed in those years. In later years, rural firms began to drop out of the sample at a slightly higher rate than urban firms (e.g., 11.6 percent of two-year-old rural firms did not survive their third year, while that was true for only 10.7 percent of two-year-old urban firms).
As shown in the Appendix, this was also true among firms in our sample.
We approximated the regional price parities of U.S. BEA economic regions as the average of the 2015 state-level price parities calculated by the U.S. BEA. The correlation between our approximate regional price parities and the regional share of firms in our sample that reached $1 million in revenues was 0.87.
In all but two states (and the District of Columbia), the U.S. BEA’s rural regional price parity was lower than the urban regional price parity in 2015 (the year we utilized for this analysis). The correlation between the share of rural and urban firms reaching $1 million in revenues and approximate regional price parities for rural and urban areas was 0.37, although the correlation for urban areas remained strong (0.84), while rural areas were weaker and negative (-0.34). Low correlation in rural areas may be affected by the limited representation in our sample of rural firms in some economic regions, particularly in New England and the Plains, where fewer than 300 rural firms are present in our sample for each of those regions.
Purple stars in Figure 5 indicate industries where our sample size was sufficient to test for a statistically significant difference, based on a power of threshold of 80 percent, between the share of firms reaching $1 million in revenues in rural and urban areas. Green stars indicate a statistically significant difference.
We note again, our sample was not representative of the industry composition of rural and urban microbusinesses. Different correlations between selection into our sample and the likelihood that a firm reaches $1 million in revenues among rural and urban firms limited our ability to draw strong inference from these analyses.
Figure 6, Panel B shows a pseudo-median percent difference between initial and peak revenues for rural and urban firms within each range of initial revenues, which approximates the median growth in our sample for firms in each initial revenue category. Other points along the distribution of revenue change were also lower among rural firms than urban firms. In some cases (39 percent of rural firms, 37 percent of urban firms), initial year revenues were a firm’s largest annual revenues.
Federal Reserve Banks, 2023 Small Business Credit Survey (2024). Federal Reserve Banks, 2016 Small Business Credit Survey (2017) found that the share of rural small employers reporting 2016 revenues greater than $1 million (27 percent) was much more similar to that of urban firms (30 percent). Though the Small Business Credit Survey sample includes firms not included in our study (the survey covers employer firms with fewer than 500 employees of any business age) and excludes non-employer firms, the general comparison between rural and urban firms may still be informative for understanding smaller (micro) businesses. The Small Business Credit Survey considers ZIP-code-level RUCA codes of four or higher to be “rural.”
Johnson (2022), Fikri (2021), Dumont (2024). In recent years, net migration to rural areas has been positive, providing some slight reversal of the previous trend (Farrigan, et al. 2024).
Farrigan, et al. (2024).
Farrigan, et al. (2024).
See, e.g., Zhao (2023).
Deller, et al. (2021) and Conroy and Low. (2021).
Federal Reserve Banks, 2023 Small Business Credit Survey (2024).
Federal Reserve Banks, 2023 Small Business Credit Survey (2024).
Federal Reserve Banks, 2023 Small Business Credit Survey (2024). Federal Reserve Banks, 2016 Small Business Credit Survey (2017).
Board of Governors of the Federal Reserve System (2019) discusses research and small business owner testimonials on small business reliance on bank branches and the impact of bank branch closure. See Beiseitov (2023) for a discussion of the importance of small banks to small business lending.