


Figure 1 : Percent change (relative to reference year) in median monthly real cash balances
Latest news

An Ohio-based company is protecting first responders around the world
With support from JPMorganChase, Fire-Dex is providing protective equipment to firefighters in 100 countries and all 50 states.
Learn moreLatest news

Veteran’s Unconventional Path to Landing her Dream Job in Tech
U.S. Army Veteran Ashley Wigfall transitioned to a civilian role and charted her path to technologist through mentorship and skills training at the JPMorgan Chase tech hub in Plano, Texas.
Learn moreFindings
Following fiscal policy interventions and limited spending opportunities during the COVID-19 pandemic, households built up large reserves of excess savings and maintained those excess savings well into 2023.1 Publicly available metrics showed that households held $500 billion more in savings in March 2023 than pre-pandemic (Abdelrahman and Oliveira 2023).
In this release of the JPMC Institute Household Finances Pulse, we continue to track how much households’ real cash reserves have returned to historical trends. Our prior release described the cash balances held by different kinds of households and provided additional context to describe the state of available cash liquidity for American households. Specifically, we highlighted the importance of considering both inflation—which erodes the purchasing power of household’s cash reserves—and expected changes in behavior that comes from households aging. We use de-identified administrative banking data to examine the path of household cash balances from January 2020 through February 2024 for 8.3 million Chase customers.2 To address inflation and an associated decrease in the purchasing power of households’ cash reserves, we report real cash balances rather than nominal cash balances.3
We find that median balances and cash buffers—balances scaled to spending—have returned to alignment with historical expectations. Historical trends show that as households age, they tend to increase their cash reserves, and these trends suggest that households would have increased their real cash reserves by about 15 percent since 2019 if pandemic disruptions had not happened. So while balances remain elevated relative to 2019, they are in line with expected increases over a period of more than four years.
We also find that balance trends by income and race have leveled off for many groups. For our two lowest income groups, balances have been following an upward trend since the middle of 2023. Balances for the highest income households in our sample continue to decline, which may reflect holding a smaller portion of liquid assets in cash balances in favor of reallocating to higher-interest options.
Together, these two findings suggest that many consumers have depleted their excess savings and are returning to more routine saving behavior. This is in line with research showing that individuals tend to maintain relatively stable cash buffer levels over time, spending down excess cash when balances are elevated until they return to their usual cash buffer level, at which point they stop dissaving (Wheat and Eckerd 2023).
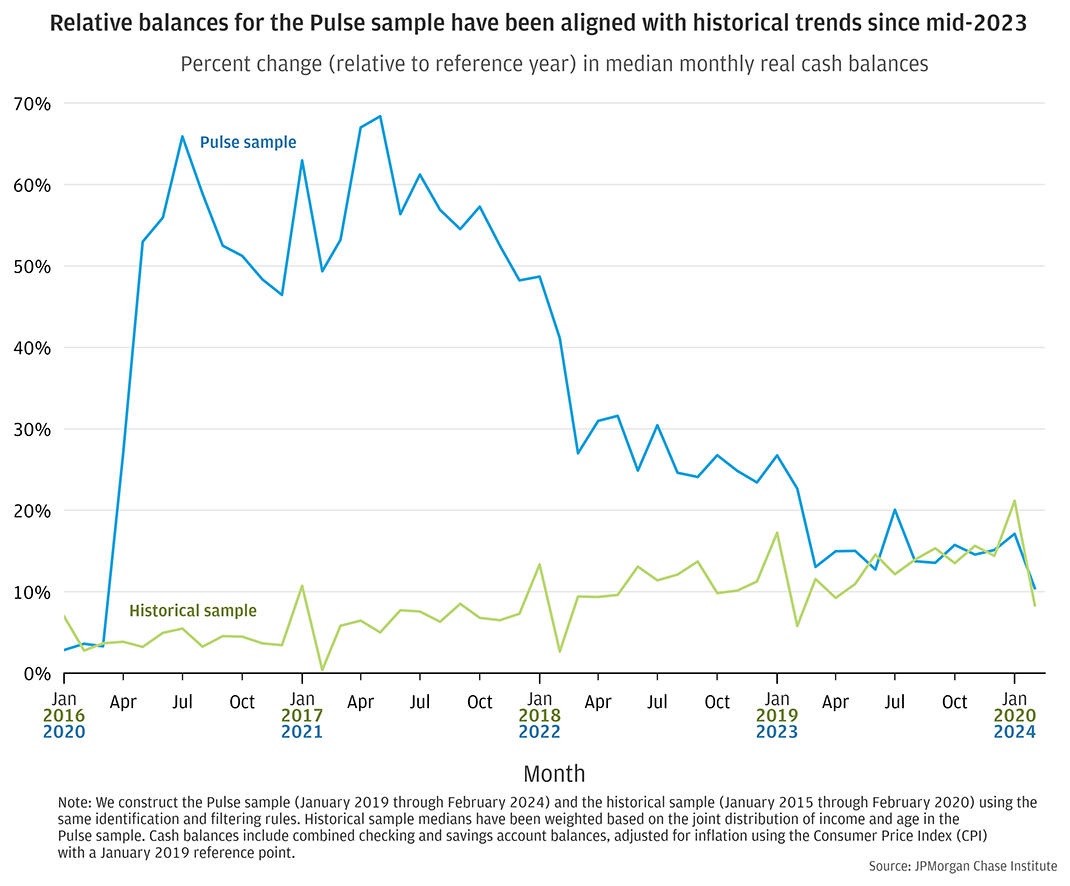
To understand current balances in the context of households’ expected life-cycle growth, we examine real balance changes for a pre-pandemic sample in comparison with our Household Pulse sample.4 This comparison sample demonstrates the impact of the aging dynamics of a balanced panel outside of the context of the COVID pandemic and its associated policy responses, helping to put recent balance results into perspective.
Figure 1 shows relative balance growth—percent change in monthly median balance relative to the same month in each sample’s reference year—for the Pulse sample and the historical comparison sample. In both samples, balances were around 15 percent elevated during the last year of our samples (2023 for the Pulse sample; 2019 for the historical sample). In other words, the amount of balance elevation that we observe in the Pulse sample has come back into alignment with historical trends. This suggests that 15 percent elevation in savings relative to 2019 may not represent “excess” cash.
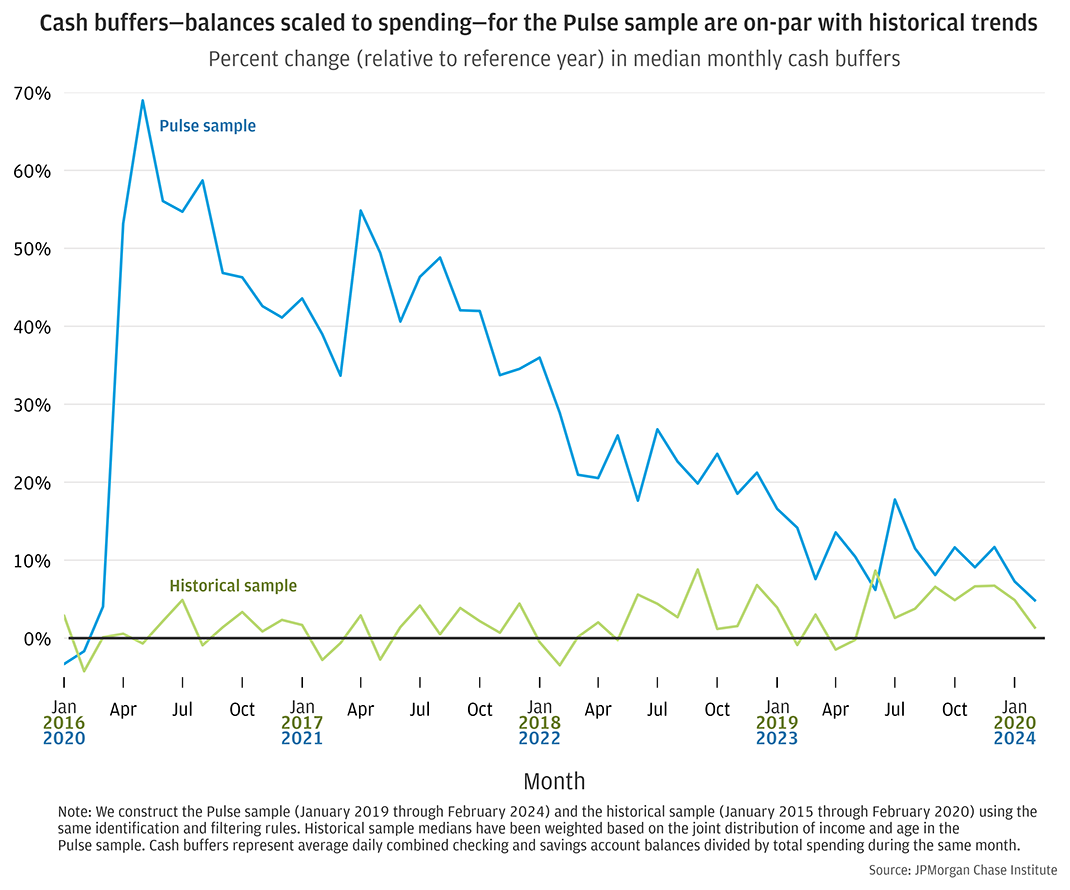
For additional perspective on household cash balances, we also track cash buffers, which measure balances scaled to spending. Figure 2 shows that relative cash buffer growth is nearly on par with historical trends as of February 2024. In January 2024, five years after our pre-pandemic reference year, cash buffers in the Pulse sample were 7 percent elevated relative to 2019. To put that into perspective, we note that the historical sample was 5 percent elevated after five years. Put differently, cash buffers in February 2024 are approaching parity with pre-pandemic conditions, rather than notably elevated above expectations.
Figure 1 : Percent change (relative to reference year) in median monthly real cash balances
Figure 2 : Percent change (relative to reference year) in median monthly cash buffers
Balance levels continued to decline into early 2024 for high-income households, as did balance growth relative to 2019.5 In February 2024, households in the highest income quartile had median real balances around $6,600, down from $7,600 in February 2023 (Figure 3). In contrast, balances have been relatively steady for households in the lowest income quartile: $1,000 in February 2023 and $940 February 2024.
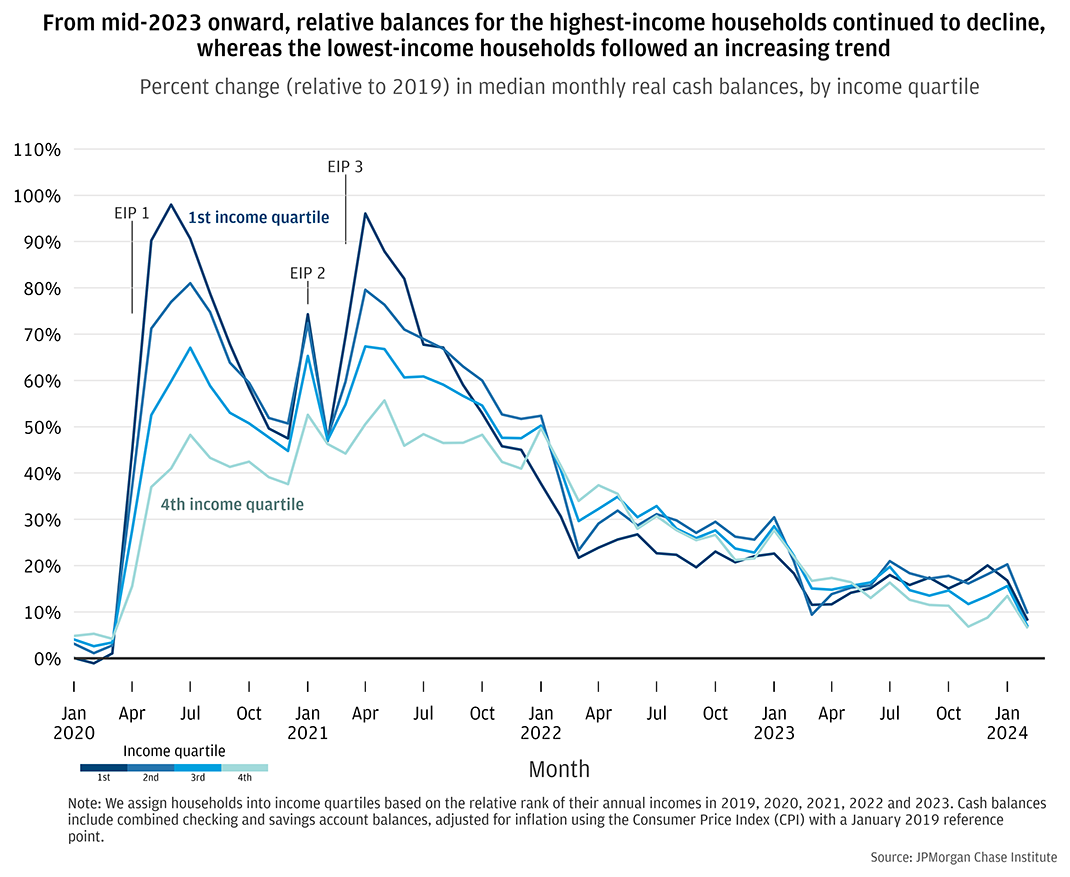
Figure 4 shows the change in median monthly balances compared to the same months in 2019. In the previous Pulse release with data through the end of October 2023, the distribution of relative balances had diverged by income level, with relative balances continuing to decline for high-income households but leveling off or slightly increasing for low-income households. With additional data through February 2024, relative balances have been following an upward trend for low-income households since the middle of 2023, while continuing to exhibit a slight downward trend for high-income households. As discussed in our prior release, this declining trend for high-income households could reflect the lower share of liquid wealth that they hold in checking and savings accounts, reallocating a portion of liquid assets to higher interest-bearing accounts. In contrast, households in the lower half of the income distribution have returned to a typical trend of gradually increasing incomes that we expect to see, following the unusual trends of the immediate post-COVID timeframe. In other words, relative balance trends for lower-income households have begun to look similar to historical balance trends (see Figure 1).
Figure 3 : Median monthly real cash balances, by income quartile
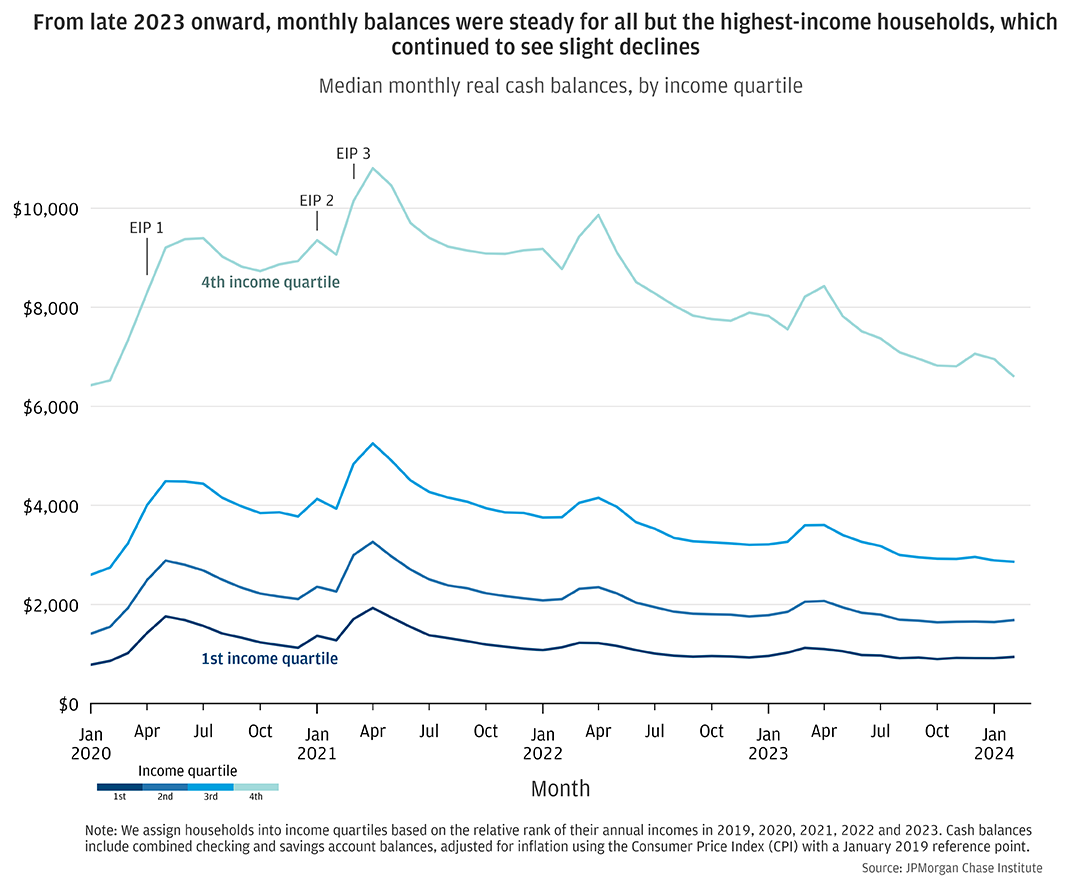
Figure 4 : Percent change (relative to 2019) in median monthly real cash balances, by income quartile
Balance trajectories in late 2023 into 2024 look similar across race and ethnicity groups, mirroring the trajectories of the middle of the income distribution (Figure 5).6 We weight median balances to account for differences in income, age, and gender across race groups, and continue to see clear level differences in weighted medians, with Asian and White households having notably higher balances than Hispanic and Black households.7 Despite level differences, balances remained roughly parallel across all race and ethnicity groups, declining slightly between February 2023 and February 2024—by $280 to $350 for each group.
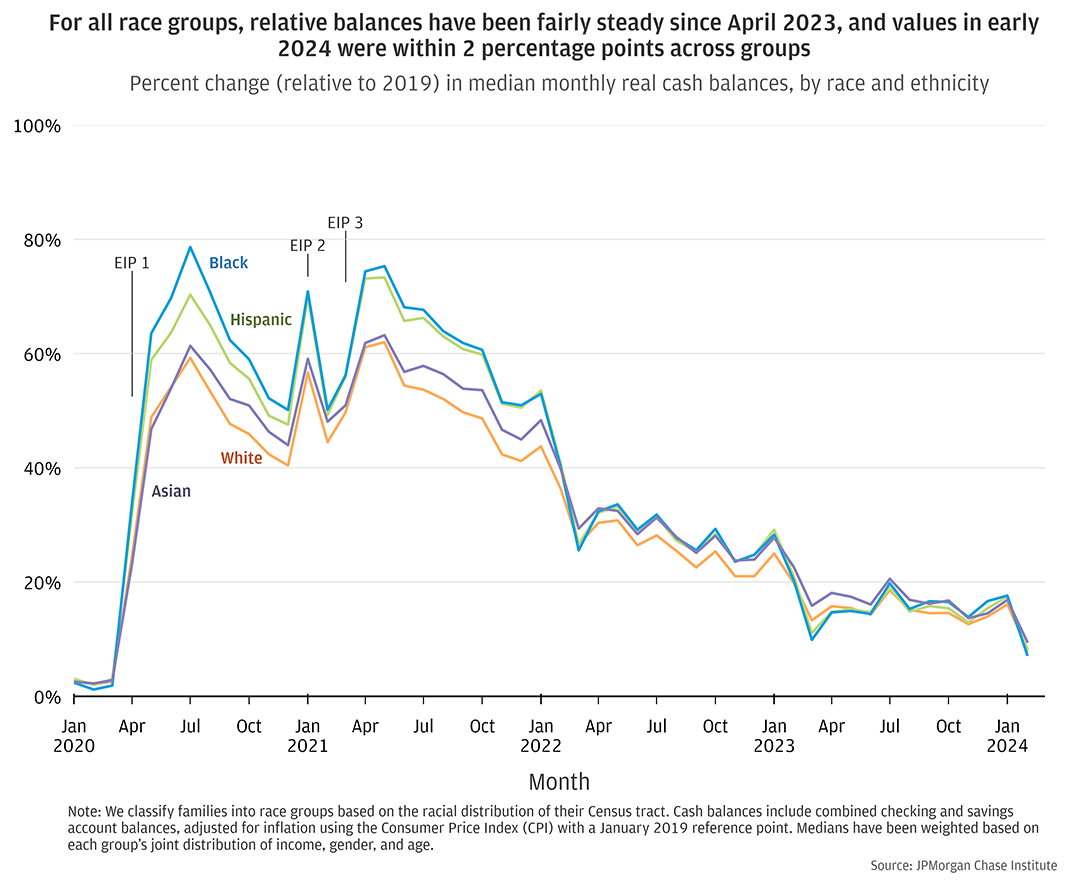
On a relative basis (Figure 6) balances have been fairly consistent in late 2023 into 2024, with a slight decrease in February. As noted in the previous Pulse release, relative balance elevation levels converged by the second quarter of 2022, and that continues to be the case, with very little differentiation across race and ethnicity groups. In January 2024, relative balance values were within 1.5 percentage points across groups, ranging from 16 to 17.5 percent elevated relative to 2019.
Figure 5 : Median monthly real cash balances, by race and ethnicity
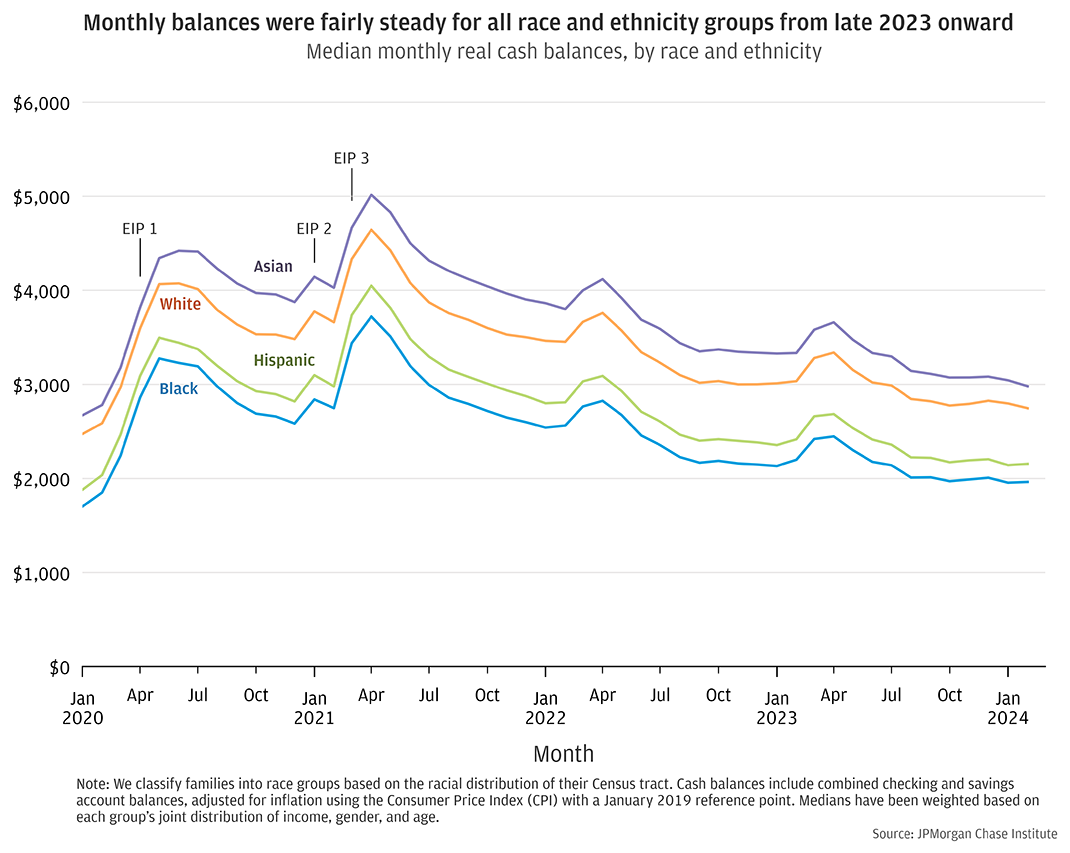
Figure 6 : Percent change (relative to 2019) in median monthly real cash balances, by race and ethnicity
Appendix
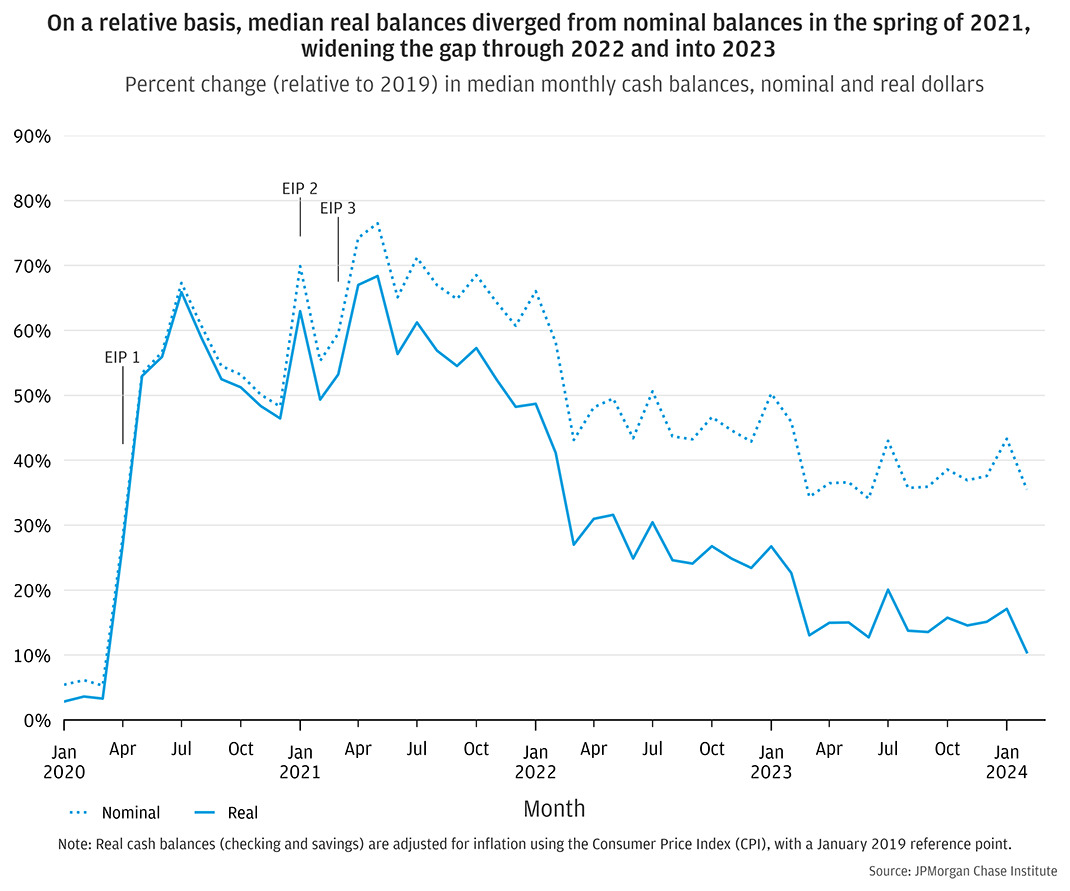
Figure A1 : Percent change (relative to 2019) in median monthly cash balances, nominal and real dollars
Abdelrahman, Hamza, Luiz E. Oliveira. 2023. “The Rise and Fall of Pandemic Excess Savings.” FRBSF Economic Letter. https://www.frbsf.org/economic-research/publications/economic-letter/2023/may/rise-and-fall-of-pandemic-excess-savings/
Wheat, Chris, George Eckerd. 2023. “Household Cash Buffer Management from the Great Recession through COVID-19.” JPMorgan Chase Institute. https://www.jpmorganchase.com/institute/research/household-income-spending/household-cash-buffer-management-from-the-great-recession-through-covid-19
During the pandemic, the federal government provided cash assistance and relief to households through a range of fiscal interventions. Three rounds of stimulus, or Economic Impact Payments (EIP) provided cash benefits to households earning below specified income thresholds, with payments landing in April 2020, January 2021, and March 2021. Throughout this time, expanded unemployment insurance delivered payments to jobless workers, including gig workers and self-employed workers, with weekly supplements to typical benefits which were phased out in 2021. Finally, the American Rescue Plan increased the dollar amount of Child Tax Credit (CTC) payments and disbursed half of the credit via monthly advance payments from July through December 2021.
https://home.treasury.gov/policy-issues/coronavirus/assistance-for-american-families-and-workers/economic-impact-payments
https://tcf.org/content/report/7-5-million-workers-face-devastating-unemployment-benefits-cliff-labor-day/
Our Household Pulse data asset covers 8.3 million families who were active checking account users between January 2019 and February 2024 and had at least $12,000 in annual adjusted income—non-transfer inflows into the checking accounts, minus Economic Impact Payments (EIP) and Unemployment Insurance (UI)—deposited to their Chase checking accounts every year in 2019 through 2023.
We compute real cash balances by deflating nominal cash balances by the Consumer Price Index (CPI), with January 2019 as our reference point.
https://fred.stlouisfed.org/series/CPIAUCSL
Sample filters are applied to ensure the households in our sample use their Chase accounts as primary vehicles for managing their finances. See details in End Note 2. Our Pulse sample is constructed from households that were active Chase accountholders between January 2019 and February 2024. We apply the same identification and filtering rules to construct the comparison sample to analyze data for January 2015 through February 2020. To account for differences in sample composition, historical sample medians have been weighted based on the joint distribution of income and age in the Pulse sample.
We assign households to income quartiles using the methodology introduced in the June 2022 Pulse release (see “Box: Our updated income metrics”). This method uses our adjusted income metric—non-transfer inflows into the checking accounts, minus Economic Impact Payments (EIP) and Unemployment Insurance (UI)—and calculates each household’s relative rank across income for each year in our sample, averaging ranks to determine final quartile.
We use a modeled race metric, classifying households into race groups based on the racial distribution of their Census tract.
Income disparities by race are large and persistent in the U.S., where Asian and White households have notably higher incomes than Hispanic and Black households. Because higher incomes often result in higher cash balances, we facilitate comparisons between race groups by weighting the medians we report based on each group’s joint distribution of income, gender, and age. https://www.census.gov/content/dam/Census/library/visualizations/2021/demo/p60-273/figure1.pdf
We thank our research team, specifically Peichen Li and Carolyn Gorman, for their hard work and contribution to this research. Additionally, we thank Alfonso Zenteno for his support. We are indebted to our internal partners and colleagues, who support delivery of our agenda in a myriad of ways and acknowledge their contributions to each and all releases.
We are also grateful for the invaluable constructive feedback we received from external experts and partners. We are deeply grateful for their generosity of time, insight, and support.
We would like to acknowledge Jamie Dimon, CEO of JPMorgan Chase & Co., for his vision and leadership in establishing the Institute and enabling the ongoing research agenda. We remain deeply grateful to Peter Scher, Vice Chairman, Tim Berry, Head of Corporate Responsibility, Heather Higginbottom, Head of Research & Policy, and others across the firm for the resources and support to pioneer a new approach to contribute to global economic analysis and insight.
This material is a product of JPMorgan Chase Institute and is provided to you solely for general information purposes. Unless otherwise specifically stated, any views or opinions expressed herein are solely those of the authors listed and may differ from the views and opinions expressed by J.P. Morgan Securities LLC (JPMS) Research Department or other departments or divisions of JPMorgan Chase & Co. or its affiliates. This material is not a product of the Research Department of JPMS. Information has been obtained from sources believed to be reliable, but JPMorgan Chase & Co. or its affiliates and/or subsidiaries (collectively J.P. Morgan) do not warrant its completeness or accuracy. Opinions and estimates constitute our judgment as of the date of this material and are subject to change without notice. No representation or warranty should be made with regard to any computations, graphs, tables, diagrams or commentary in this material, which is provided for illustration/reference purposes only. The data relied on for this report are based on past transactions and may not be indicative of future results. J.P. Morgan assumes no duty to update any information in this material in the event that such information changes. The opinion herein should not be construed as an individual recommendation for any particular client and is not intended as advice or recommendations of particular securities, financial instruments, or strategies for a particular client. This material does not constitute a solicitation or offer in any jurisdiction where such a solicitation is unlawful.
Wheat, Chris, Erica Deadman, Daniel M. Sullivan. 2024. “Household Pulse: Balances through February 2024.” JPMorgan Chase Institute. https://www.jpmorganchase.com/institute/research/household-income-spending/household-pulse-balances-through-february-2024

Chris Wheat
President, JPMorganChase Institute

Erica Deadman
Consumer Research Lead, JPMorganChase Institute

Daniel M. Sullivan
Consumer Research Director, JPMorganChase Institute