Findings

The COVID-19 pandemic resulted in an unprecedented recession that impacted families’ financial positions. Based on recent JPMorgan Chase Institute research, our Household Finances Pulse leverages de-identified administrative banking data to analyze changes in cash balances during the COVID-19 pandemic and ongoing recovery.

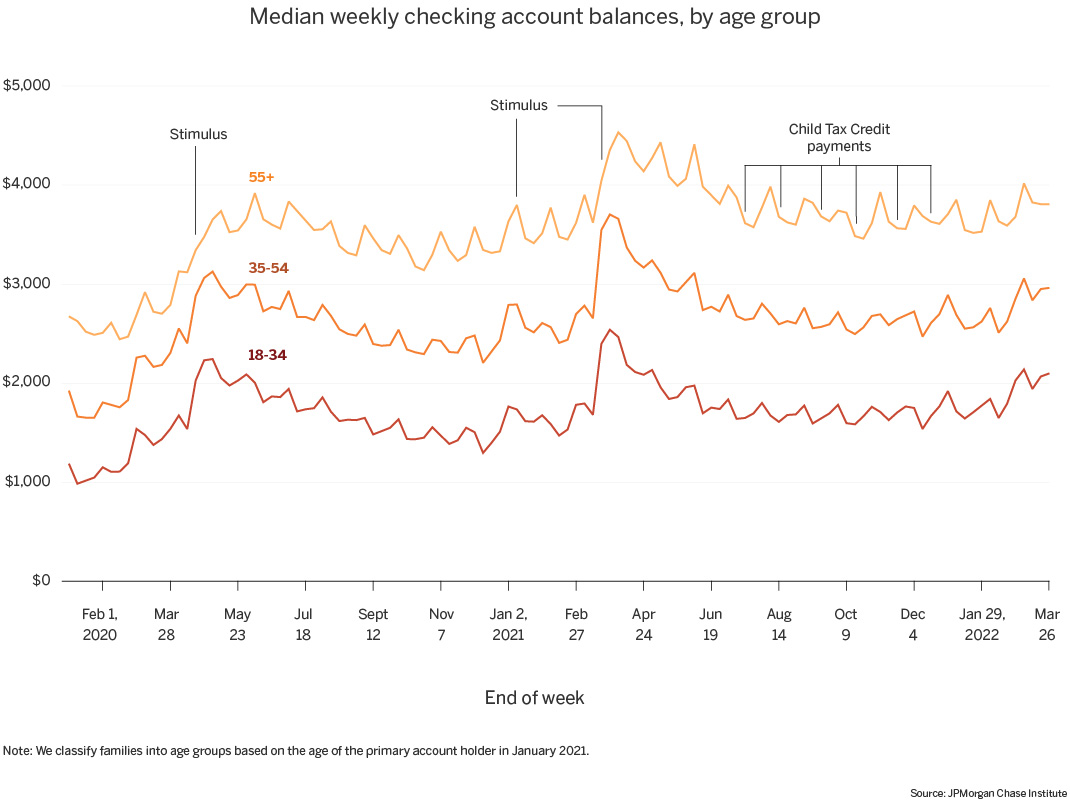
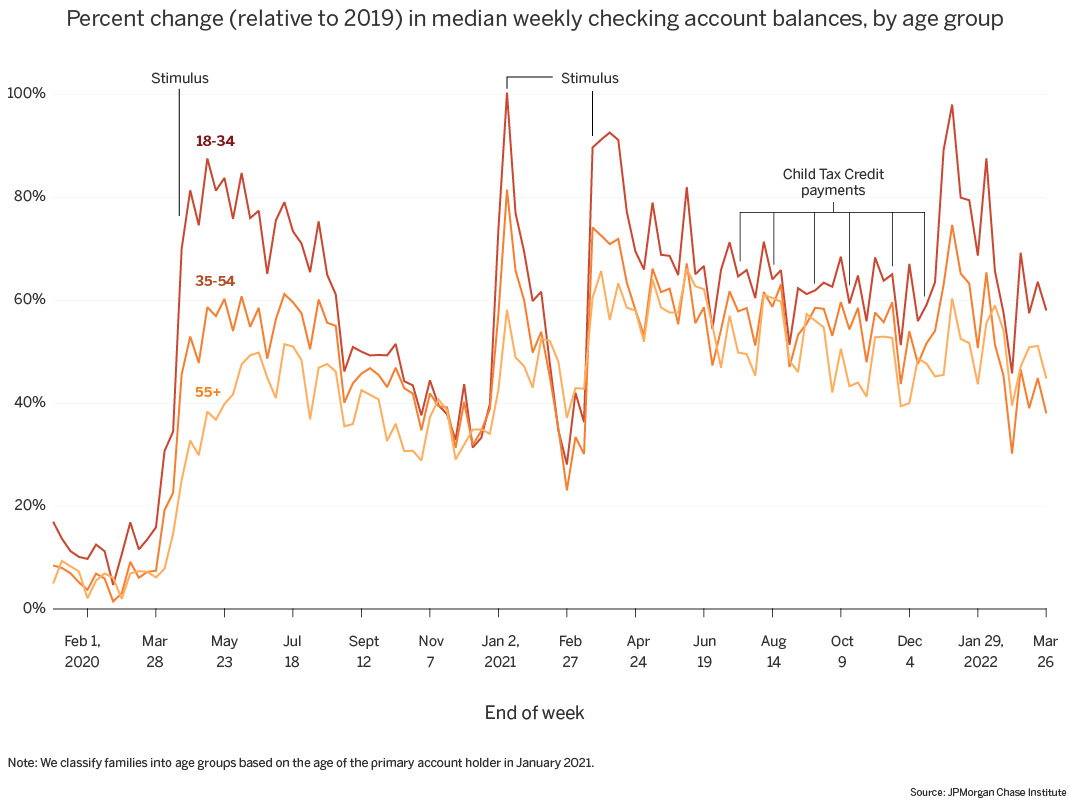
This release examines the path of household cash balances through the end of March 2022, giving us a look at liquid asset trends during the months following the expiration of advanced Child Tax Credit (CTC) payments. We compare cash balance trends across income and age distributions, and between families who did and did not receive advanced CTC payments.

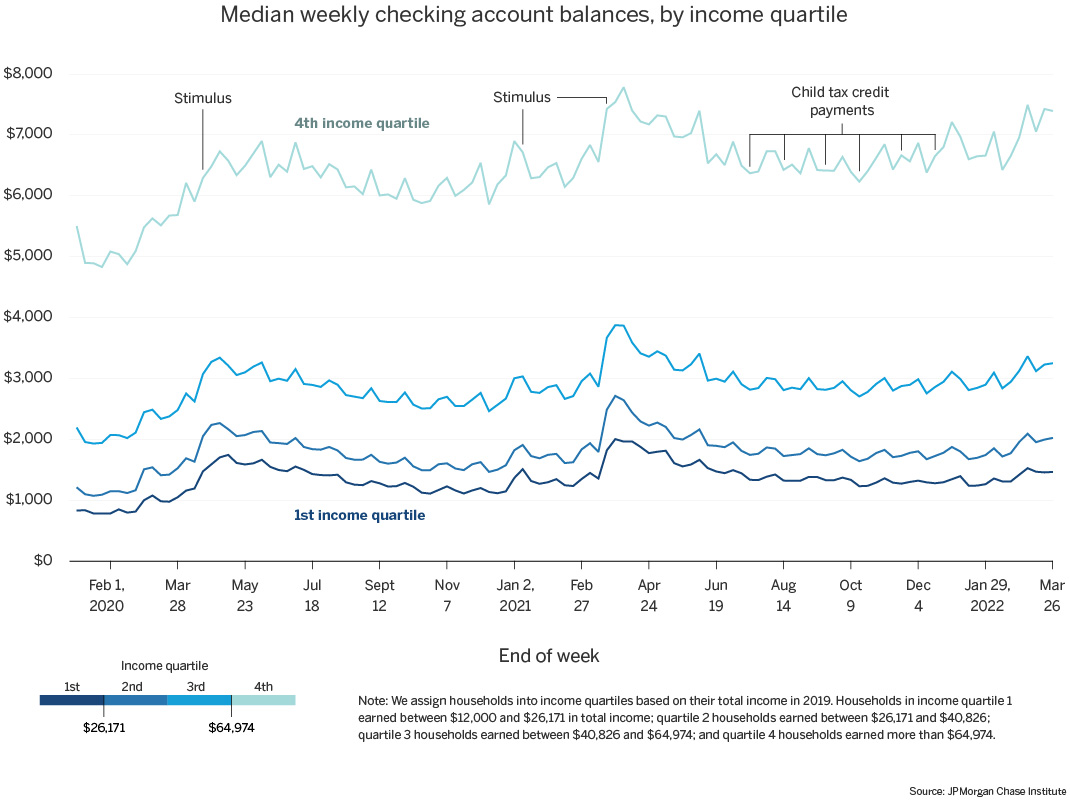
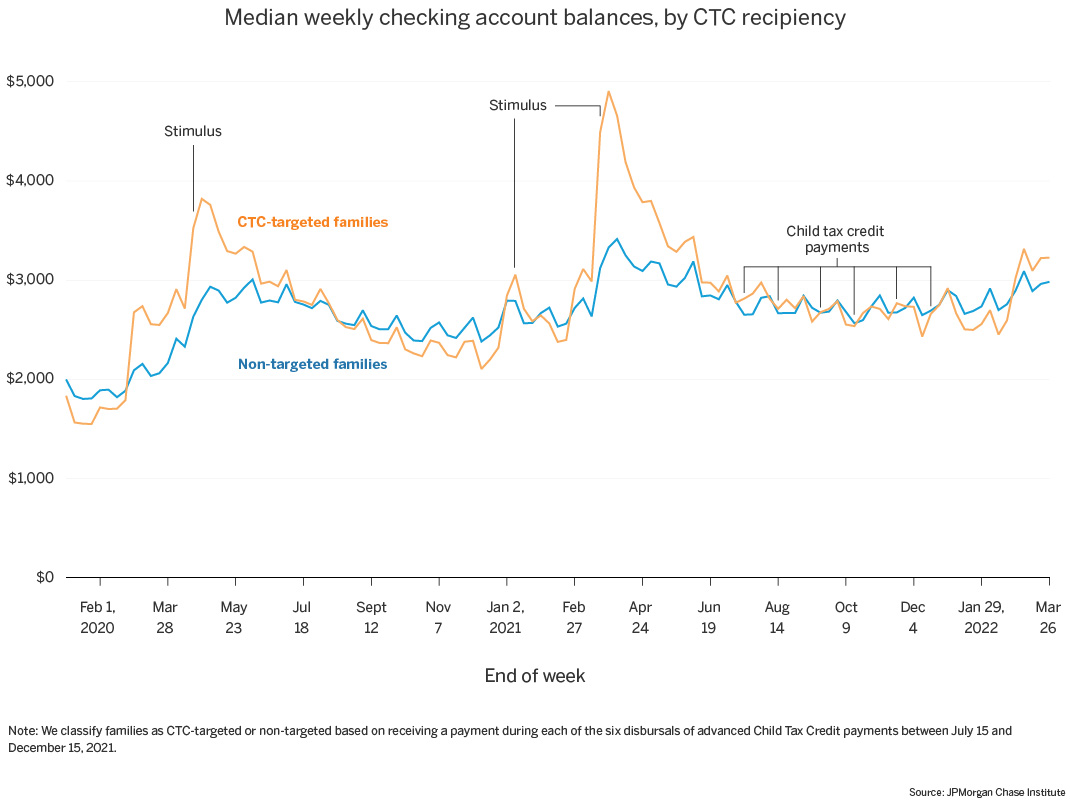
During the pandemic, the federal government provided cash assistance and relief to families through a range of fiscal interventions. Three rounds of stimulus, or Economic Impact Payments (EIP) provided cash benefits to families earning below specified income thresholds, with the dollar amount of the benefit determined by the size of the family, and progressively more paid per child in each round.1 Stimulus payments landed in April 2020, January 2021, and March 2021. Throughout this time, expanded unemployment insurance delivered payments to jobless workers, including gig workers and self-employed workers, with weekly supplements to typical benefits which were phased out in 2021.2 Finally, the American Rescue Plan increased the dollar amount of CTC payments and expanded eligibility for families in the 2021 fiscal year. Monthly advanced CTC payments were disbursed from July through December 2021, covering half of the total tax credit3; the remainder will arrive when families file tax returns for the 2021 fiscal year.

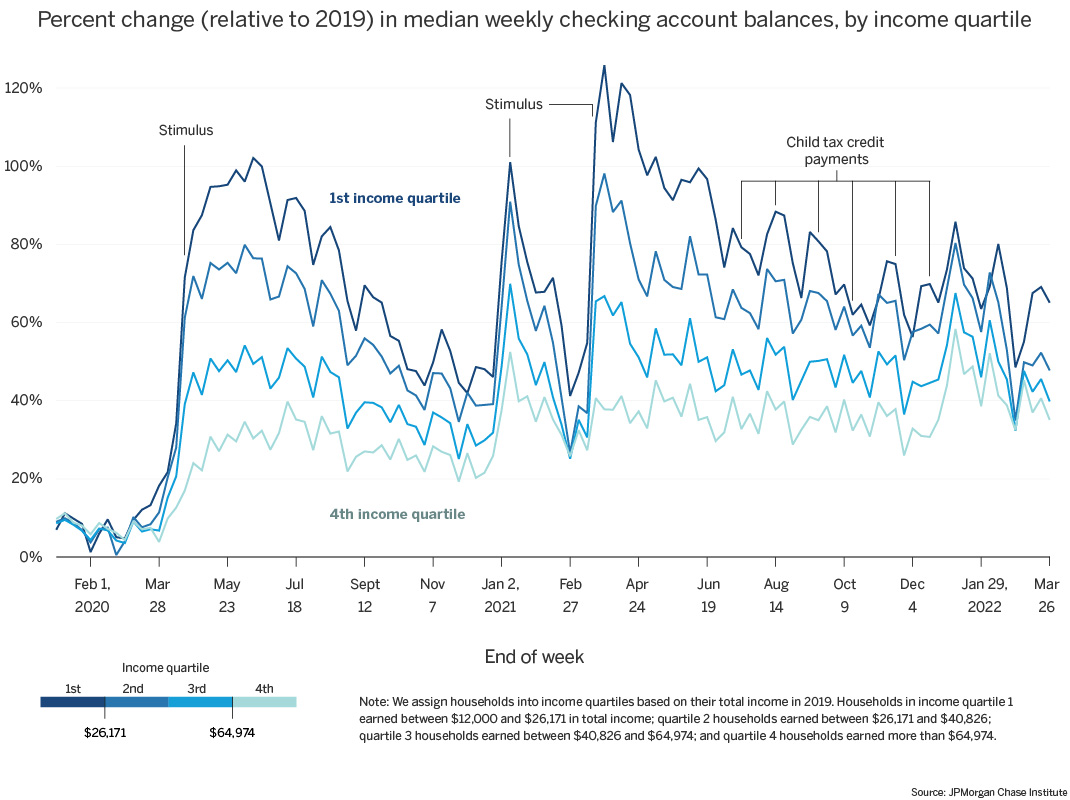
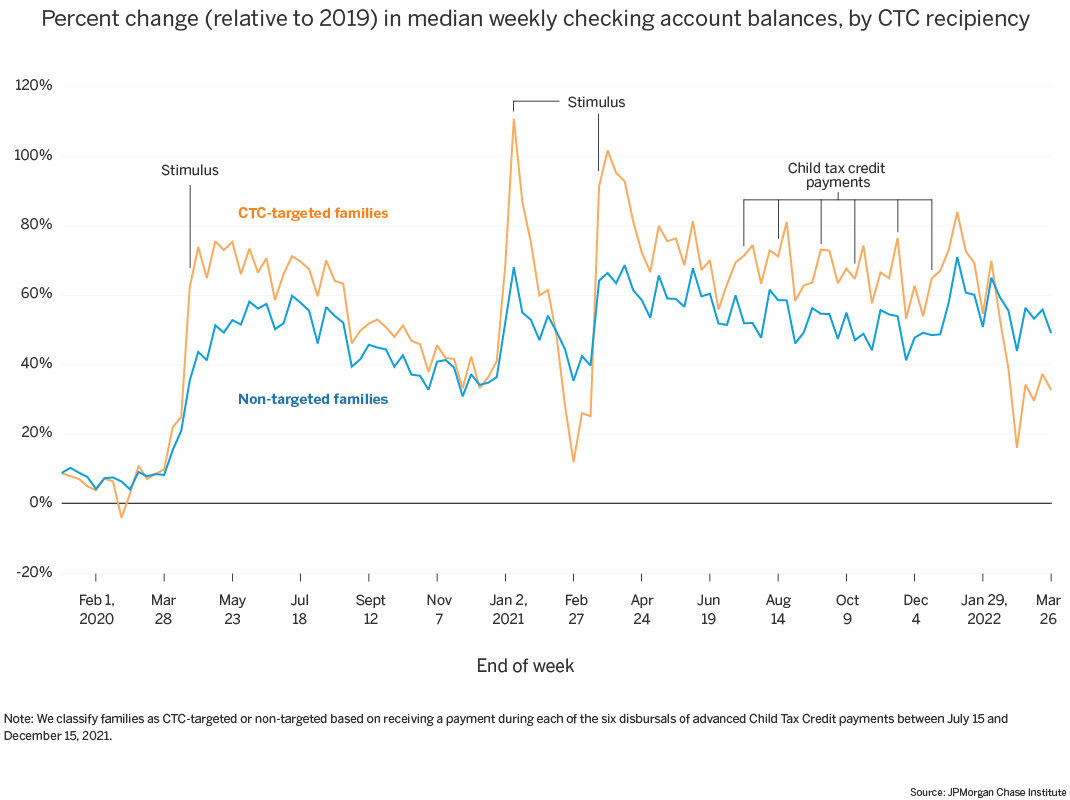
To put our measures of family checking account balances into perspective with other household finance metrics, there are three important considerations to keep in mind. First, our balance growth numbers are based on nominal dollars, not adjusted for inflation. This is especially noteworthy given the high rate of inflation in the economy: inflation rose by 8.5 percent in for the year ending March 2022, the fastest pace in four decades.4 Second, the charts below do not account for the secular upwards trend of liquid balances prior to the pandemic. For our sample, cash balances in the first two months of 2020 had grown by roughly 7 percent on a year-over-year basis, implying that early 2022 cash balances could have been up by 23 percent compared to 2019 levels, independent of the pandemic and corresponding government interventions. Finally, there is significant heterogeneity in asset allocations for different groups of households.5 Families that hold a larger share of their financial wealth in checking accounts may have maintained a larger proportion of their balance increases from government intervention in their checking accounts. Thus, other cash balance metrics may differ from ours in amount or trend, based on these or other differences in measurement.

01

We observe the beginning of tax return up-ticks in balances in March 2022, enabling families across the income distribution to maintain elevated cash balances, particularly low-income families.

As of February 2022, balances were holding steady at elevated late-2021 levels across the income spectrum (Figure 1). In typical years, January and February often represent slightly depressed balances relative to the end of the prior year, so maintaining somewhat steady levels from late 2021 through February 2022 resulted in upticks on a balance percent-change basis, which we observe for all income groups (Figure 2). Balance increases began in March 2022, as tax return payments ramped up for the year.6 Because this is in line with previous years’ March balance patterns, percent-change metrics returned roughly to parity with late-2021 levels in March. The second income quartile deviated from this pattern slightly, falling below late-2021 percent-change values with its March decline—while families in this group maintain balances 50 percent higher in March 2022 than March 2019, their December 2021 balances were nearly 60 percent elevated relative to 2019.

Figure 1: Median checking account balances remained boosted across the income distribution with slight up-ticks in March 2022, though the lowest-income families had less than $1,500 in their checking accounts.

Line graph: Median weekly checking account balances, by income quartile

Source: JPMorgan Chase Institute

Line chart showing the median weekly checking account balances by income quartile. Balance levels are higher for higher earners. Balances increased after each round of stimulus payments and remain elevated at the end of March 2022 compared to pre-pandemic levels.

Figure 2: In March 2022, median cash balances were up to 70 percent elevated for low-income families.

Line graph: Percent change in median weekly checking account balances, by income quartile

Source: JPMorgan Chase Institute

Line chart showing the percent change, relative to 2019, in median weekly checking account balances by income quartile. After each round of stimulus payments, balances increased the most for the lowest earners, in percent change terms. In contrast, the highest earners had the lowest percent gains in balances. At the end of March 2022, balances among low-income families were still 70 percent elevated compared to 2019 levels.

01

Prime working aged adults (35-54) saw the steepest declines in their balance gains.

Overall, checking account balances by age follow the same patterns discussed in the previous section by income: median balances remained steady through February 2022 and increased with tax time in March; corresponding percent-change upticks in the first two months of the year leveled out in March, returning to late-2021 values. These trends held across age groups, though the middle group (aged 35 to 54 years) experienced a larger dip in percent-change: in late 2021 their balances were 50 percent elevated relative to 2019, which decreased to 42 percent elevation in March 2022. As we discuss below, this could be due to CTC-recipient families—concentrated in the 35-54 year age range—receiving smaller tax refunds in 2022 as a result of the advanced CTC payments.

These balance trends are interesting in light of age differences in labor force participation trends. Labor force participation—the proportion of the civilian noninstitutional population currently in the labor force, measured by the Current Population Survey7—regained much of its pandemic decreases by March 2022. For 18- to 34-year-olds, labor force participation rates dropped from 76.1 percent in 2019 to a pandemic low of 74.3 percent in 2020, a drop of 1.9 percentage points. By March 2022, they had regained 1.7 percentage points, or 90 percent of their pandemic drop. 35 to 54 year-olds had a similar experience, regaining 83 percent of their pandemic drop in labor force participation by March 2022. The oldest group, those aged 55 years and over, had regained only 28 percent of their pandemic labor force participation decrease by March 2022. Despite lower than typical labor force participation rates, the 55 and older group continues to maintain elevated cash balances, ranging from 40 to 60 percent elevated relative to 2019 in recent months.

Figure 3: Median checking account balances remained boosted across age groups, with the youngest families maintaining the lowest cash balances.

Line graph: Median weekly checking account balances, by age group

Source: JPMorgan Chase Institute

Line chart showing the median weekly checking account balances by age group. The age groups are 18-34, 35-54, and 55+. Balance levels are higher for higher age groups. For all age groups, balances increased after each round of stimulus payments, particularly the last one, and remain elevated at the end of March 2022 compared to pre-pandemic levels.

Figure 4: In March 2022, median checking account balances were 60 percent elevated for the youngest families.

Line graph: Percent change in median weekly checking account balances, by age group

Source: JPMorgan Chase Institute

Line chart showing the percent change, relative to 2019, in median weekly checking account balances by age group. The age groups are 18-34, 35-54, and 55+. After each round of stimulus payments, balances increased the most for the youngest households, in percent change terms. In contrast, the oldest households had the lowest percent gains in balances. At the end of March 2022, balances among families in the 18-34 group were still 60 percent elevated compared to 2019 levels.

01

Balances began to diverge in early 2022 by advanced CTC recipient status, and by the end of March, cash balances among CTC recipients had fallen to 35 percent elevated compared to 50 percent among non-recipient families.

With the end of advanced CTC payments in 2021, balances among CTC-targeted families decreased slightly in early 2022. In late February, when many families receive their tax refunds each year (Farrell, Greig, Hamoudi, 2019), balances among CTC-targeted families increased. This tax-time related balance increase was smaller in 2022 than in 2019, however, as evident in Figure 6. This could be due to the fact that families receiving advanced CTC payments may have received a smaller tax refund at tax time, since they only received $1,500 or $1,800 per child at tax time (half of the max per child benefit of $3,000 or $3,600) in 2022 compared to the full $2,000 CTC per child in prior years. Thus on a percent basis CTC recipient families appear to be depleting gains after the expiration of advanced CTC payments, decreasing in February and March 2022 and falling below non-recipient families. Recipient families’ balances were roughly 60 to 75 percent elevated during advanced CTC payment distribution (July through December 2021) and into January 2022. This decreased to 35 percent elevated by the end of March 2022. It is unclear whether they will continue to deplete their balance gains in the coming months.

Meanwhile, the balances of families who did not receive advanced CTC payments continue to be elevated both in absolute and in percent terms. As of the end of March 2022, at $3,000 they were roughly 50 percent higher than their baseline level of $2,000 in 2019.

Figure 5: CTC-targeted families saw larger increases in cash balances with each round of stimulus, compared to non-targeted families.

Line graph describes about median weekly checking account balances, by CTC recipiency

Source: JPMorgan Chase Institute

Line chart showing the median weekly checking account balances from the beginning of 2020 through March 2022 for CTC-targeted families and non-targeted families. After each round of stimulus payments, CTC-targeted families saw larger increases in cash balances compared to non-targeted families. The balances of both CTC-targeted and non-targeted families remained elevated through March 2022, with a recent increase since the beginning of 2022, particularly for CTC-targeted families.

Figure 6: In March 2022, cash balances among advanced CTC recipients were roughly 35 percent elevated compared to 50 percent among families who did not receive advanced CTC.

Line graph: Percent change in median weekly checking account balances, by CTC recipiency

Source: JPMorgan Chase Institute

Line chart showing the percent change, relative to 2019, in median checking account balances for CTC-targeted families and non-targeted families. After each round of stimulus payments, the balances of CTC-targeted families rose more in percent terms, relative to non-targeted families. Starting around February 2022, CTC-targeted families dropped below non-targeted families in percent change terms.

Acknowledgements

We thank our research team, specifically Edward Biggs, for his hard work and contribution to this research. Additionally, we thank Stephen Harrington and Robert Caldwell for their support. We are indebted to our internal partners and colleagues, who support delivery of our agenda in a myriad of ways, and acknowledge their contributions to each and all releases.

We are also grateful for the invaluable constructive feedback we received from external experts and partners. We are deeply grateful for their generosity of time, insight, and support.

We would like to acknowledge Jamie Dimon, CEO of JPMorgan Chase & Co., for his vision and leadership in establishing the Institute and enabling the ongoing research agenda. We remain deeply grateful to Peter Scher, Vice Chairman, Demetrios Marantis, Head of Corporate Responsibility, Heather Higginbottom, Head of Research & Policy, and others across the firm for the resources and support to pioneer a new approach to contribute to global economic analysis and insight.

Disclaimer

This material is a product of JPMorgan Chase Institute and is provided to you solely for general information purposes. Unless otherwise specifically stated, any views or opinions expressed herein are solely those of the authors listed and may differ from the views and opinions expressed by J.P. Morgan Securities LLC (JPMS) Research Department or other departments or divisions of JPMorgan Chase & Co. or its affiliates. This material is not a product of the Research Department of JPMS. Information has been obtained from sources believed to be reliable, but JPMorgan Chase & Co. or its affiliates and/or subsidiaries (collectively J.P. Morgan) do not warrant its completeness or accuracy. Opinions and estimates constitute our judgment as of the date of this material and are subject to change without notice. No representation or warranty should be made with regard to any computations, graphs, tables, diagrams or commentary in this material, which is provided for illustration/reference purposes only. The data relied on for this report are based on past transactions and may not be indicative of future results. J.P. Morgan assumes no duty to update any information in this material in the event that such information changes. The opinion herein should not be construed as an individual recommendation for any particular client and is not intended as advice or recommendations of particular securities, financial instruments, or strategies for a particular client. This material does not constitute a solicitation or offer in any jurisdiction where such a solicitation is unlawful.

Suggested Citation

Greig, Fiona, Erica Deadman. 2022. “Household Pulse: The State of Cash Balances through March 2022.” JPMorgan Chase Institute. https://www.jpmorganchase.com/insights/all-topics/financial-health-wealth-creation/household-pulse-cash-balances-through-march-2022

References

1.

The first round of stimulus delivered up to $1,200 per adult and $500 per qualifying child under the age of 17. The second round paid up to $600 per child, and the third round up to $1,400 per child. https://home.treasury.gov/policy-issues/coronavirus/assistance-for-american-families-and-workers/economic-impact-payments

2.

A weekly supplement of $600 between March and July 2020 and $300 during October 2020 and between January and September 2021. Twenty-six states ended expanded UI benefits by the end of July 2021, with the remaining states ending benefits on September 5, 2021. https://tcf.org/content/report/7-5-million-workers-face-devastating-unemployment-benefits-cliff-labor-day/

3.

On July 15, 2021, the first monthly advanced CTC payments were delivered, paying up to $300 per child under the age of 6 years of age and up to $250 per child aged 6 to 17 years. https://www.whitehouse.gov/child-tax-credit/

5.

For instance, the 2019 Survey of Consumer Finances shows that lower-income families hold a larger share of their financial wealth in checking accounts. https://www.federalreserve.gov/econres/scfindex.htm

6.

While the Treasury disburses tax refund payments as early as January for a given tax year, refund payment volume is largest in March and April. In 2019 through 2021, for example, 23 to 35 percent of the year’s tax refund dollars were distributed between weeks 9 and 12 (late February to late March). https://fiscaldata.treasury.gov/datasets/daily-treasury-statement/operating-cash-balance

7.

Data for 2019 through 2021 obtained via the following links: 
https://www.bls.gov/cps/aa2019/cpsaat03.htm 
https://www.bls.gov/cps/aa2020/cpsaat03.htm 
https://www.bls.gov/cps/cpsaat03.htm 
March 2022 data obtained from seasonally adjusted monthly info, Last Modified Date: May 06, 2022: https://www.bls.gov/web/empsit/cpseea08b.htm