

Figure 1: Lower-income households experienced the largest boost in growth as the labor market tightened. Policies undertaken during COVID-19 accelerate the trend.
Latest news

An Ohio-based company is protecting first responders around the world
With support from JPMorganChase, Fire-Dex is providing protective equipment to firefighters in 100 countries and all 50 states.
Learn moreLatest news

Veteran’s Unconventional Path to Landing her Dream Job in Tech
U.S. Army Veteran Ashley Wigfall transitioned to a civilian role and charted her path to technologist through mentorship and skills training at the JPMorgan Chase tech hub in Plano, Texas.
Learn more
The economic expansion prior to COVID-19 was the longest in U.S. history.1 Headline unemployment fell from as high as 10 percent in the Great Recession to 3.5 percent in February 2020. How did Americans across the income spectrum fare over the disparate stages of the cycle? Quantitative answers to this question can provide a view into the possible redistributive benefits of a “high pressure” economy, with a tight labor market and low interest rates.2 The Federal Reserve plays a key role managing cyclical fluctuations in employment, by setting interest rate policy and purchasing financial assets. Fiscal levers—like the 2018 tax cuts and Economic Impact Payments during COVID-19—also have broad effects on consumer demand that ultimately supports the job market.
In this insight, we document heterogeneity in the evolution of income growth since the Great Recession. Using administrative data on the incomes of over 7 million households, we estimate the extent to which lower-income households began to catch-up with higher earners in two distinct phases: first, as the labor market tightened; and second, as policies put in place during the pandemic supported incomes at the lower end of the distribution.
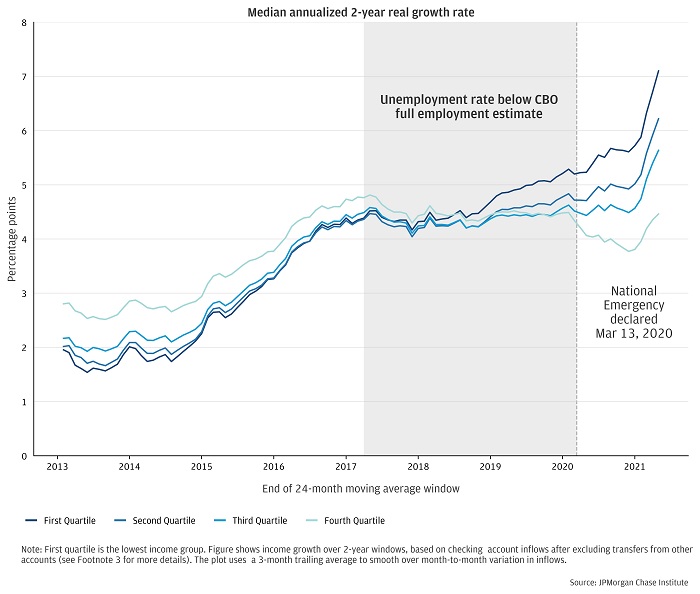
Depicted in Figure 1, households in lower income areas in our data have experienced a greater pickup in growth as the economic growth cycle extended. We estimate (annualized) 2-year real income growth rates.3 This window focuses on lasting changes experienced by families—smoothing over idiosyncratic shocks—and obviates adjustments for year-on-year measures comparing 2021 to the sharp volatility in 2020. Households that we group into the lowest quartile of income—based on average incomes in a household’s ZIP code4 —rose from 2.0 percent early in the recovery to 5.2 percent just prior to the COVID-19 recession (see Figure 1).5 Meanwhile, the growth rates for the highest income quartile increased from 2.8 to 4.4 percent. A substantial portion of the relative gains for lower-income households occurred after the labor market surpassed Congressional Budget Office’s (CBO) estimates of “full employment” in early 2017, as unemployment rates continued to decline and interest rates remained low. Policymaker discussions have recognized that the lack of a pickup in inflation around that time highlights the degree of uncertainty around such “full employment” estimates.6
Figure 1: Lower-income households experienced the largest boost in growth as the labor market tightened. Policies undertaken during COVID-19 accelerate the trend.
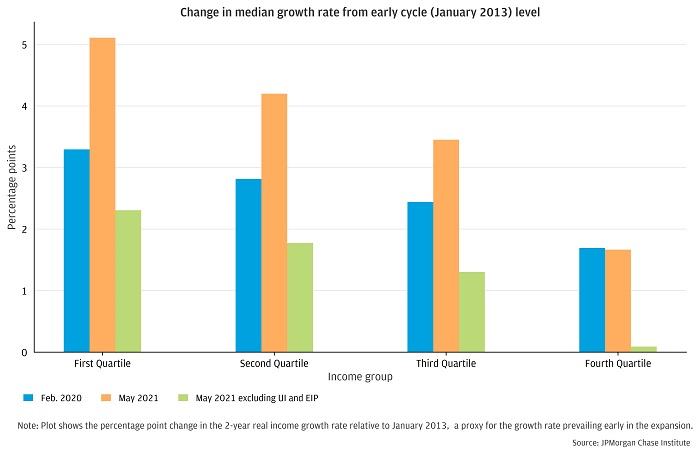
COVID-19 brought unprecedented and swift job losses that disproportionately impacted lower-wage workers in in-person sectors, such as restaurants, travel and hospitality, and retail. And yet, due to strong and progressively targeted fiscal supports, income growth for lower-income households has increased sharply since the onset of the pandemic, building on already healthy real growth rates.7 In particular, the portion of income growth in 2020 and 2021 attributable to Unemployment Insurance (UI), given boosts in the amount and coverage of UI benefits, as well as the three rounds of Economic Impact Payments (EIP) has been notable. Annualized growth for the 2-year period ending May 2021 would have decelerated by about 1 percentage point, but instead it accelerated nearly 2 percentage points for the bottom income quartile. This estimate almost certainly represents a lower bound on the contribution of fiscal supports during COVID, due to incomplete identification of UI and EIP payments in our data, as well as other national and local fiscal support expansions (e.g. SNAP, state-based stimulus payments, and rental assistance) not included in our analysis. The distribution of the income boost since early 2020 shows the role of targeting relief to families most in need.
Figure 2: Lower-income households experienced outsized inflows during COVID-19, extending gains from the tight pre-pandemic labor market.
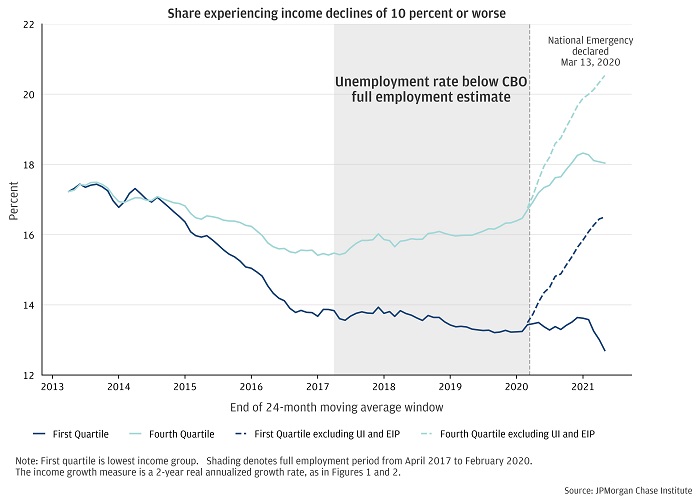
The discussion above focuses on median outcomes for growth. Typical outcomes are important, but the whole distribution matters when considering the welfare implications of business cycles. The “left-tail” of outcomes merit particular attention. Figure 3 shows the share of households in our data experiencing income declines exceeding 10 percent over a two-year window. The solid lines depict the share using total income and the dotted lines since COVID-19 show dynamics after stripping out two important government cash transfer programs: Unemployment Insurance and Economic Impact Payments. The metric represents an estimate of the portion of the population facing a prolonged drop in income and the role of government transfers in cushioning shocks. This trend is a “left-tail” parallel to the figures for median income growth shown in Figures 1 and 2.
In 2013, across the income spectrum, roughly 17 percent of families had experienced a 10 percent or greater decline in income over the prior two years.8 As labor market conditions improved from 2013 up to February 2020, the share of households experiencing a substantial, long-lasting decline in income fell the most for families in the first income quartile, with the share falling to 13 percent, a drop of more than 20 percent. In other words, the first income quartile saw the largest decline in downside income shocks benefit during the expansion.
The rise in this measure of financial distress during COVID-19—when excluding government transfers in the form of UI and EIP—shows the clear role government supports played in mitigating income losses and maintaining the income growth momentum illustrated in Figures 1 and 2. Indeed, when including these transfers, the share of households experiencing -10 percent or worse income outcomes actually fell modestly for the first income quartile, instead of rising by 25 percent.
Figure 3. The number of households experiencing substantial downward income changes fell most for low-income households during the expansion.
The variation in US households’ income growth depicted in this insight demonstrates the potential for both monetary and fiscal policy to influence the trajectory of income inequality. Fiscal policy can have a rapid and direct effect. Since March 2020, the government has injected trillions of dollars to stem the economic fallout of the COVID-19 crisis in the form of UI supplements and direct payments to households. Many of these benefits were fixed dollar amounts, which progressively boosted income more in percentage terms for workers with low incomes. Damaging effects of prior recessions have disproportionately landed on lower-income households and people of color.9 By contrast, the large policy response to COVID-19 provided financial buoyancy that kept families with lower incomes afloat during a challenging time.
Meanwhile, policymakers at the Federal Reserve have increasingly emphasized inclusive, broad-based growth as a goal in setting monetary policy. Operationalizing this objective, the central bank has indicated its willingness to moderately overshoot its 2 percent inflation objective in pursuing maximum employment.10 Federal Reserve Governor Lael Brainard noted in a speech last year, “sustained disparities can hold back the recovery and lead to worse overall outcomes.” The Fed is not alone; other central banks have been paying closer attention to inequality, as indicated by the frequency by which global policymakers reference the issues. The influence of monetary policy on the distribution of income growth can be powerful—albeit indirect—as it can set in motion pervasive changes across the aggregate labor market.
With more than $5 trillion in COVID-related stimulus, a recently Senate-passed $1 trillion infrastructure package, and $3.5 trillion in proposed budget reconciliation, inflation concerns are running high. The possible redistributive benefits of this spending should be an important consideration for policymakers as they weigh these policy measures. As we document here, low-income families experienced the most income growth and greatest mitigation of downside risk during the expansion period and with the benefit of COVID-related stimulus, stemming the tide of income inequality.
We thank Anna Garnitz, Stephen Harrington, Emily Rapp, and Sarah Kuehl for their support. We are indebted to our internal partners and colleagues, who support delivery of our agenda in a myriad of ways, and acknowledge their contributions to each and all releases. We are also grateful to Gianluca Violante for helpful research discussions.
We would like to acknowledge Jamie Dimon, CEO of JPMorgan Chase & Co., for his vision and leadership in establishing the Institute and enabling the ongoing research agenda. We remain deeply grateful to Peter Scher, Vice Chairman, Demetrios Marantis, Head of Corporate Responsibility, Heather Higginbottom, Head of Research & Policy, and others across the firm for the resources and support to pioneer a new approach to contribute to global economic analysis and insight.
This material is a product of JPMorgan Chase Institute and is provided to you solely for general information purposes. Unless otherwise specifically stated, any views or opinions expressed herein are solely those of the authors listed and may differ from the views and opinions expressed by J.P. Morgan Securities LLC (JPMS) Research Department or other departments or divisions of JPMorgan Chase & Co. or its affiliates. This material is not a product of the Research Department of JPMS. Information has been obtained from sources believed to be reliable, but JPMorgan Chase & Co. or its affiliates and/or subsidiaries (collectively J.P. Morgan) do not warrant its completeness or accuracy. Opinions and estimates constitute our judgment as of the date of this material and are subject to change without notice. The data relied on for this report are based on past transactions and may not be indicative of future results. The opinion herein should not be construed as an individual recommendation for any particular client and is not intended as recommendations of particular securities, financial instruments, or strategies for a particular client. This material does not constitute a solicitation or offer in any jurisdiction where such a solicitation is unlawful.
The U.S. economic expansion from 2009 to February 2020 was the longest on record, dating back to 1854, according to the Business Cycle Dating Committee of the National Bureau of Economic Research.
See, for example, then Fed Chair Janet Yellen’s October 2016 speech and Arthur M. Okun’s “Upward Mobility in a High-pressure Economy.”
To accurately capture relevant income for households with volatile month-to-month inflow streams, we compute 24-month moving averages for account inflows, after excluding transfers from other accounts like savings or investments. The 2-year change in this moving average defines an individual’s growth rate. Growth rates are converted to real terms by deflating nominal growth by the Personal Consumption Expenditures price index (FRED Ticker: PCEPI).
We group households by ZIP Code average per-person income, computed from IRS Statistics of Income, instead of using household-level income observed in our data. This grouping method reduces the potential for noise or volatility in our data to introduce bias in growth rates by income tier; for example, if a typically high-income household experiences a temporary interruption in observed inflows (which can occur if an individual operates multiple checking accounts), we could erroneously categorize them as low-income and later over-estimate income growth.
We compare the results of the income growth exercise against aggregate growth in personal disposable (i.e., after tax) income. Due to differences in concepts—e.g., our panel perspective captures life-cycle effects, and we focus on median growth rates, not total income growth—modest differences between our figures and aggregates are not surprising. On balance these time series are in the range of 1 percentage point higher than aggregate growth in personal disposable income over the period we study. In the full employment period (April 2017-Feb 2020), lower-income groups show a somewhat larger divergence from aggregate growth, in part because higher income households comprise a greater share of the total.
In July 2021 the CBO revised its previous estimate of full employment—the Natural Rate of Unemployment—and now publishes the Noncyclical Rate of Unemployment. The measures provide an estimate of the rate of unemployment that will not lead to an acceleration in inflation. FRED Ticker: NROU.
Although UI benefits and EIP payments were widely available, they represented larger proportional income boosts for low-income families given the income targeting of EIP payments, concentration of job losses among low-income workers, the $600 and $300 weekly UI supplements regardless of income level (Ganong et al. 2020), and UI eligibility expansions through the Pandemic Unemployment Assistance program, which disproportionately benefited lower-income workers (Greig et al. 2021).
As in Figures 1 and 2, we focus on growth of income over rolling 2-year periods, e.g., 2018-19 relative to 2016-17.
As one indication, the unemployment rate for Black individuals rate rose by as many as 9 percentage points during the Great Recession, compared with 5 percentage points for White individuals. (FRED series: LNS14000006 (Black); LNS14000003 (White)) Academic research has found that the lowest income households face higher sensitivity of earnings to GDP growth than most middle- and upper-income households (see Guvenen et al. 2017).
These goals are enshrined in the Fed’s latest strategic policy review, which culminated in September 2019, details of which can be found here. The distributional consequences of monetary policy has been a very active area of economic research in recent years. Examples include Bartscher et al. (2021); Anderson et al. (2021) and Holm, Paul, and Tischbirek. (2021).
Authors

Fiona Greig
Former Co-President

Chris Wheat
President, JPMorganChase Institute

George Eckerd
Wealth and Markets Research Director, JPMorganChase Institute

Melissa O’Brien
Data Science Lead

Shantanu Banerjee
Financial Markets Research Associate