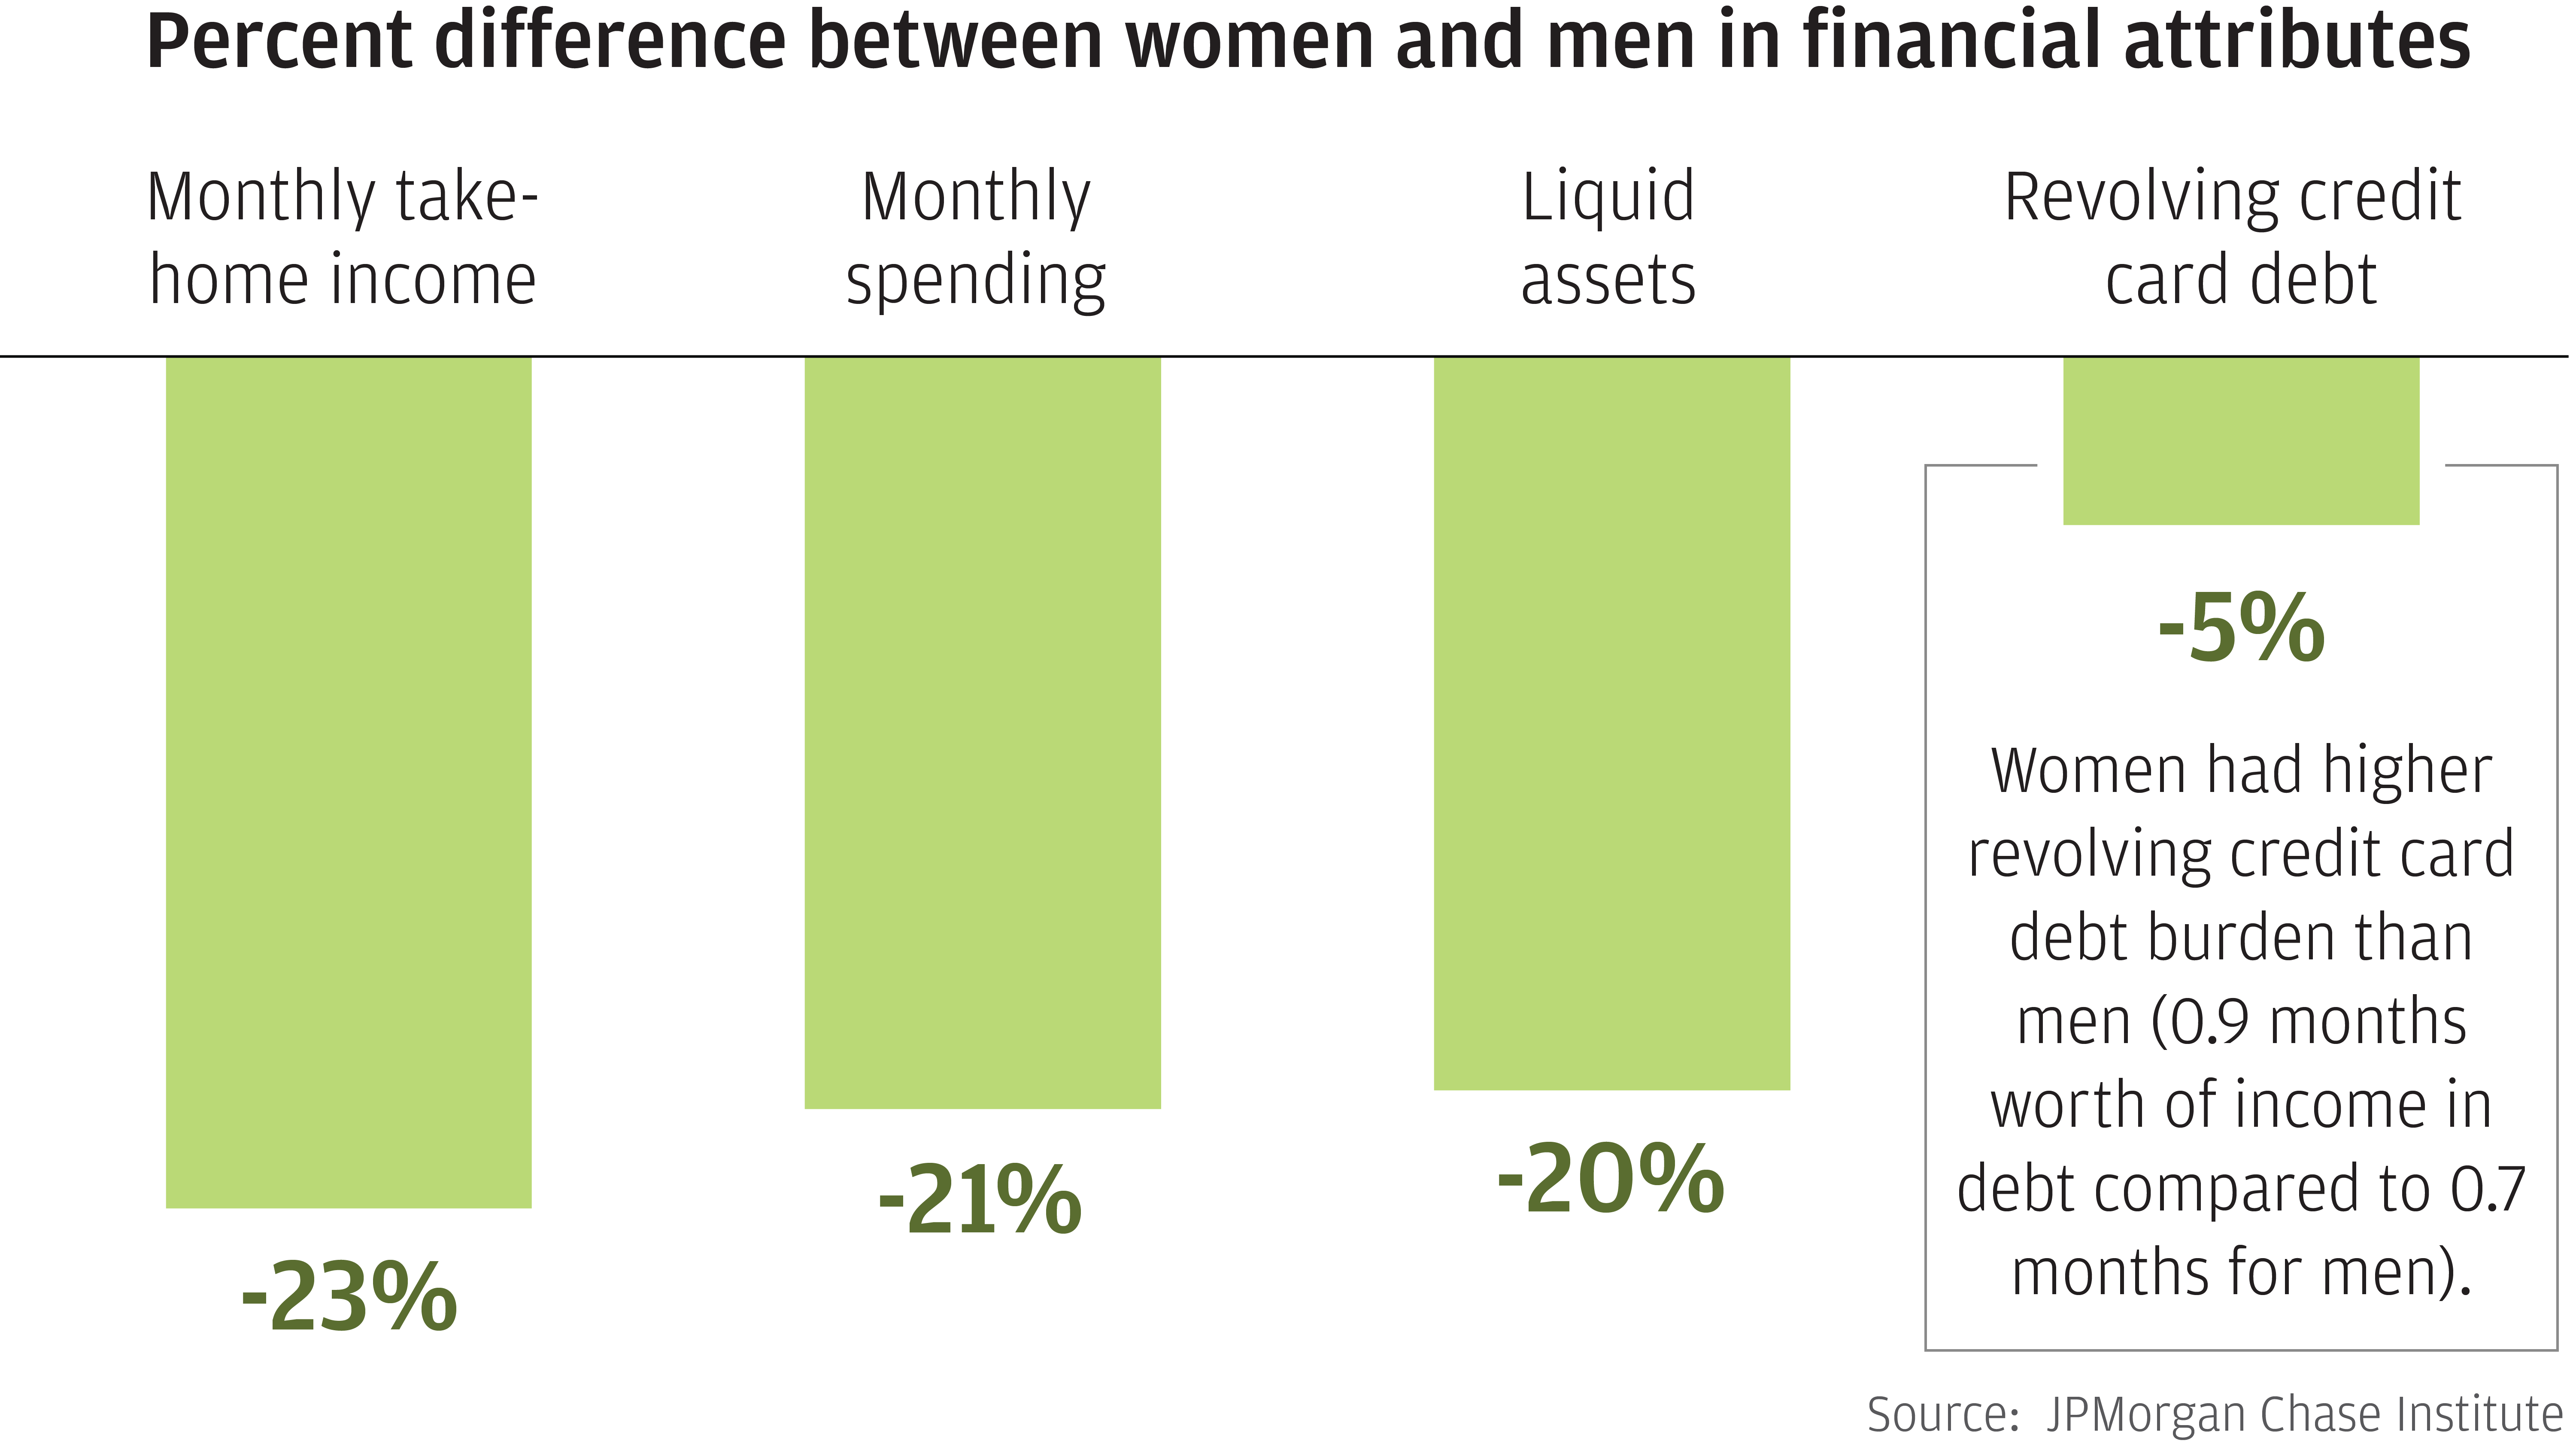
Figure 1: Female account holders had lower income, spending, and liquid assets and higher revolving credit card debt burden than male account holders
From industry leaders to policymakers, people across the country and across the aisle are discussing the gender pay and wealth gap, as well as government and employer solutions such as parental leave policies. Leveraging our unique, high-frequency lens, the JPMorgan Chase Institute examined some of the gender gaps in financial outcomes across a range of indicators, including disparities in financial resiliency, healthcare spending, participation in the Online Platform Economy as an income-smoothing tool, and the performance of women-owned small businesses.
Generally, women face discrepancies compared to their male counterparts across a range of financial outcomes. In our report The Gender Gap in Financial Outcomes: the Impact of Medical Payments, we leveraged consumer account data to compare the financial outcomes of accounts held by women versus men. First, and notably, while most primary account holders were men (54 percent), low-income primary account holders were more likely to be women. Importantly, female account holders exhibited roughly 20 percent lower levels of take-home income, spending, and liquid assets than male account holders (Figure 1). Though their revolving credit card debt levels were slightly lower, women also had a slightly higher credit card debt burden relative to income than men.
Figure 1: Female account holders had lower income, spending, and liquid assets and higher revolving credit card debt burden than male account holders

Our research on out-of-pocket healthcare spending further illustrates financial gender gaps. Across the twenty-three states in our Healthcare Out-of-Pocket Spending Panel, women shouldered a slightly higher healthcare spending burden, spending 2.0 percent of their take-home income on healthcare compared to 1.6 percent for men. Importantly, we show that out-of-pocket healthcare expenses can be acute for families and are intricately linked with other aspects of their financial lives. This is especially true for women.
We find that the gender gap endures when families are hit with economic hardships, such as extraordinary medical payments. We define extraordinary medical payments as spending on healthcare services in a given month that were at least $400, more than 1 percent of annual income, and more than 2 standard deviations away from the individuals’ normal monthly mean healthcare expenses. Our research on the consequences of extraordinary medical payments shows that the mean value of extraordinary payments was 18 percent lower in dollar terms for women than for men ($1,714 for women compared to $2,099 for men). However, as a fraction of monthly take-home income, the magnitude of extraordinary medical payments was larger for women, representing 52 percent of a month’s take-home pay compared to 48 percent for men, even though the incidence of extraordinary medical payments across genders in any given year is roughly the same (Figure 2).
Figure 2: The mean magnitude of extraordinary medical payments was considerably lower for women in dollar terms but represented a higher fraction of their monthly take-home income.

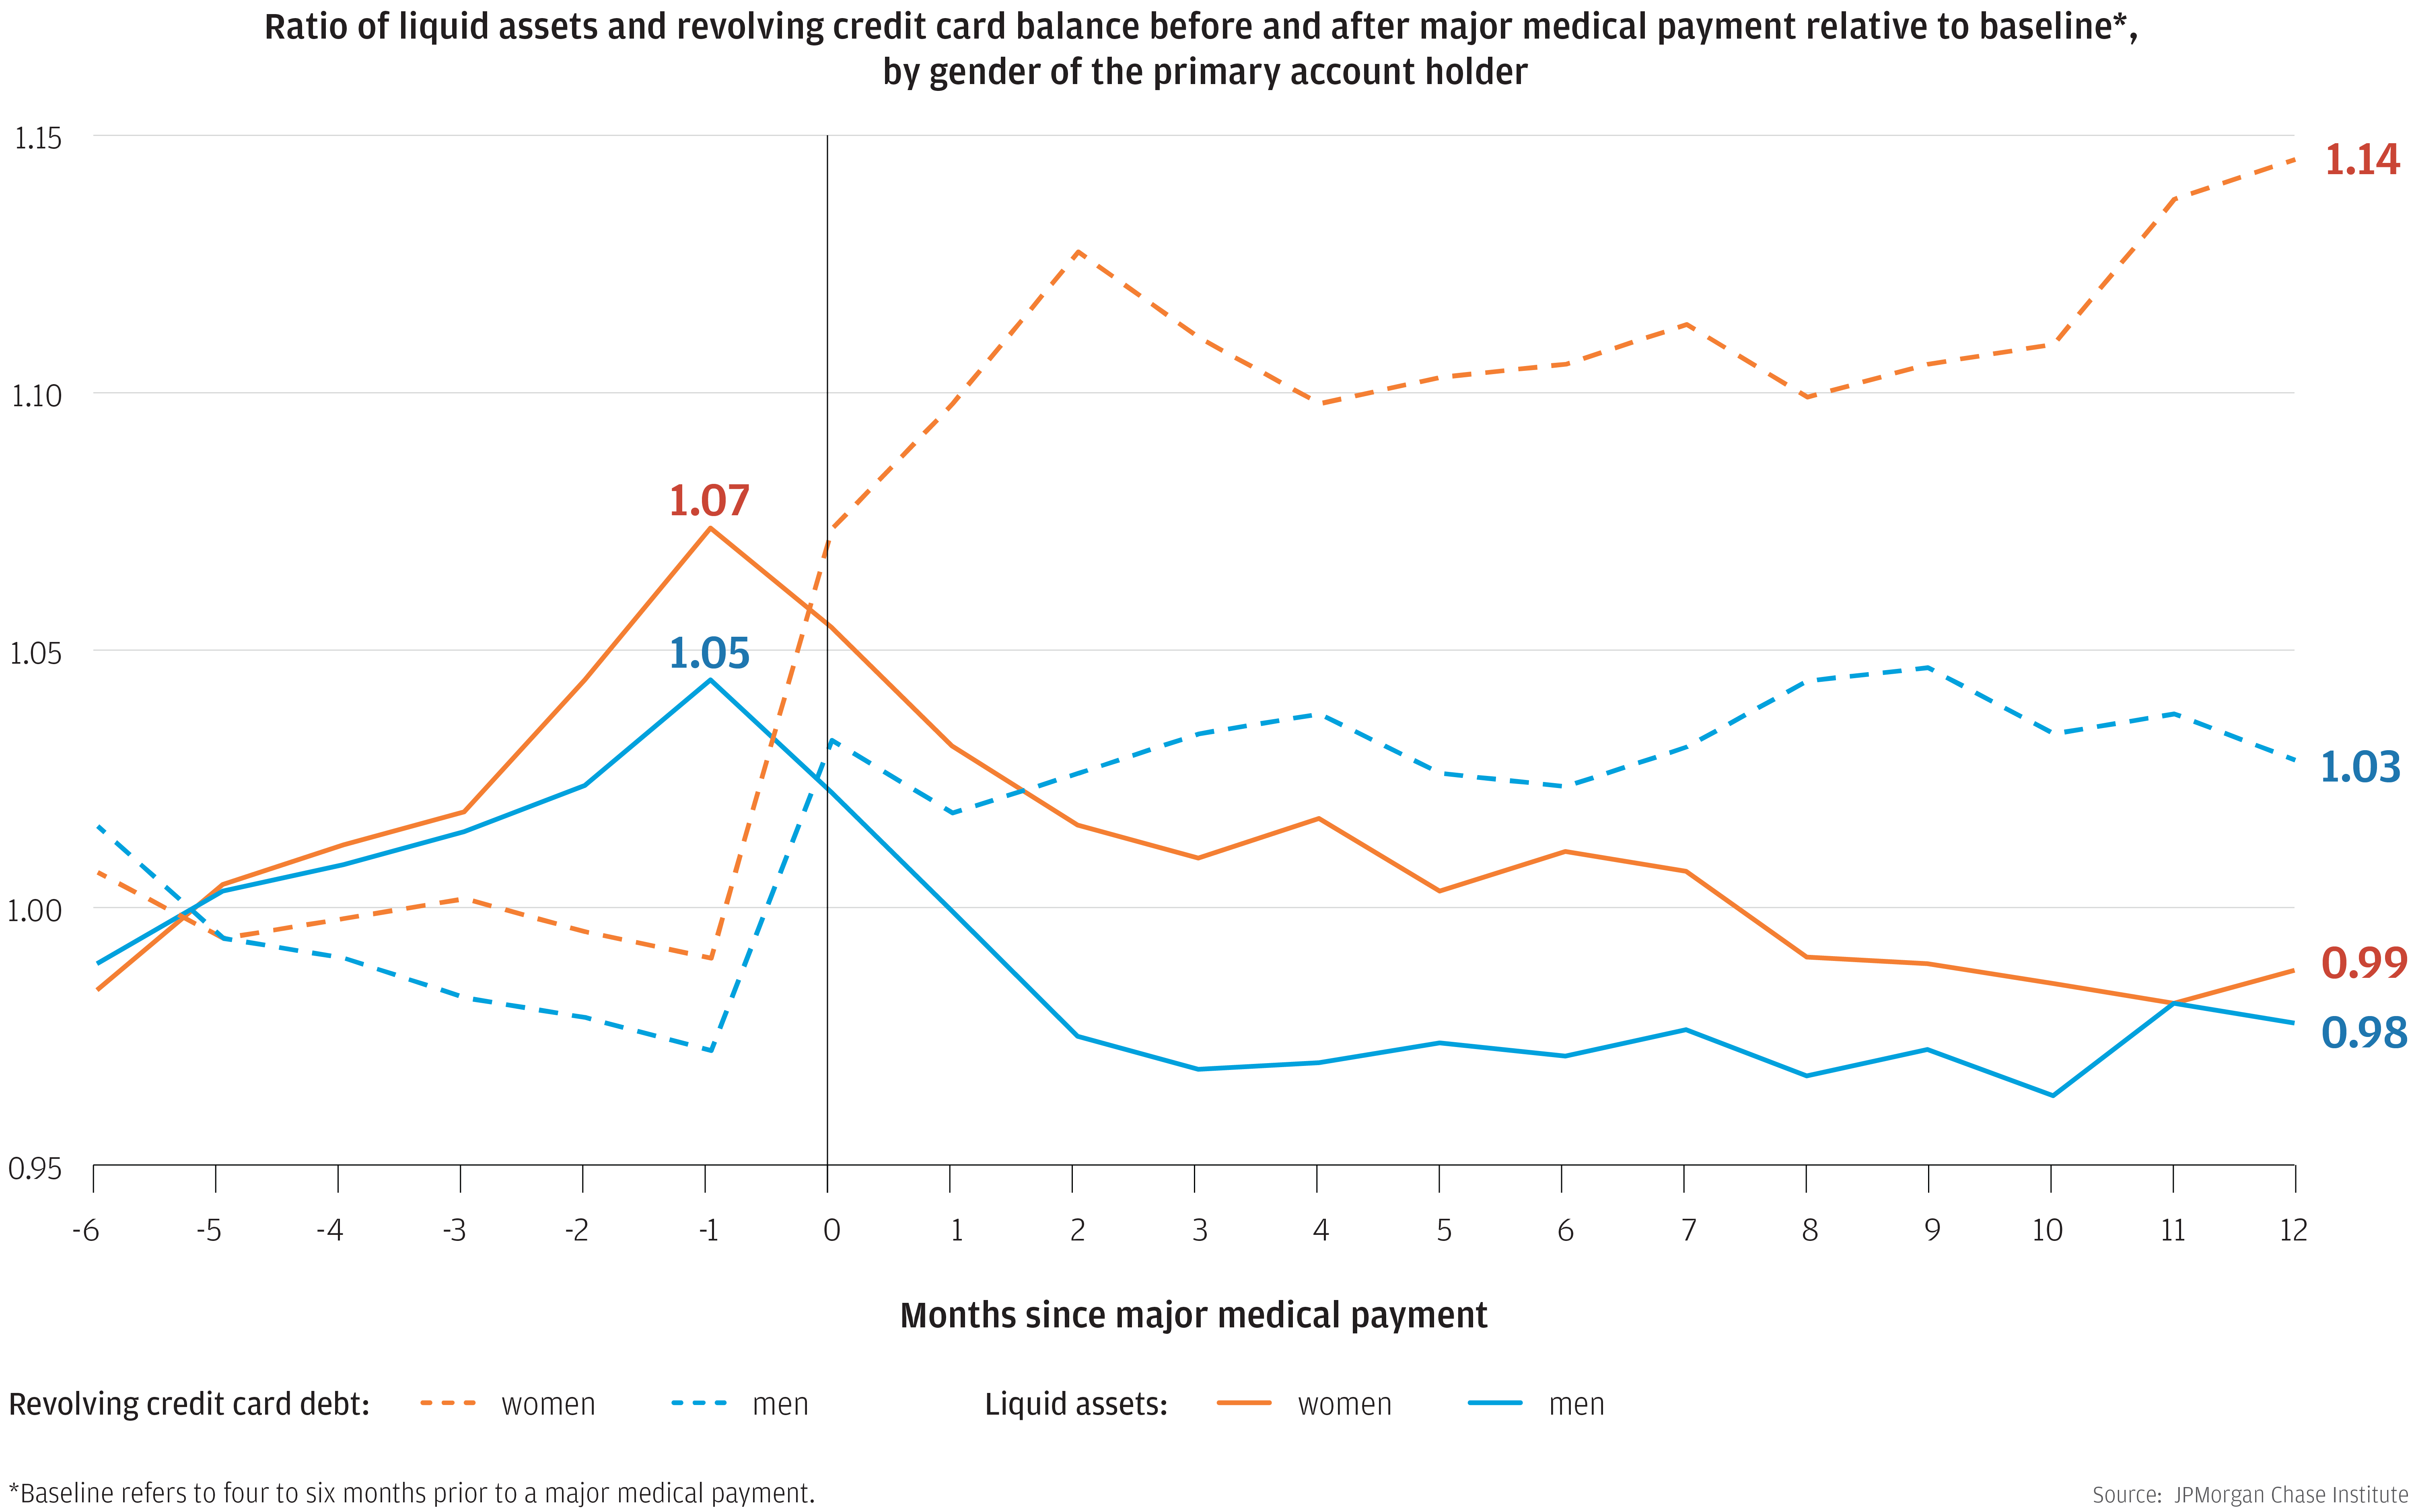
Extraordinary medical payments had a larger impact on financial outcomes for female account holders than for male account holders (Figure 3). Immediately before making the payment, women exhibited a much larger spike in liquid assets relative to men, suggesting they were more likely to delay the payment or to defer seeking treatment until they were able to pay for it. In combination with lower levels of income and assets women hold relative to men, these findings suggest that women were in a weaker financial position than men to withstand an extraordinary payment. Indeed, a year after making the payment, women still had 14 percent more revolving credit card debt than before, compared to an increase of just 3 percent for men, indicating that the gender gap in financial outcomes had only widened after the payment hit.
Figure 3: Women garnered a significantly larger increase in liquid assets prior to the medical payment and had more elevated levels of revolving credit card debt a year after the extraordinary medical payment.
Additionally, we find that healthcare spending is sensitive to cash-flow events, and this is especially true for women. We observed a 60 percent increase in out-of-pocket healthcare spending in the week after families received a tax refund, and healthcare remained elevated by roughly 20 percent for seventy-five days. Importantly, families with very limited liquid assets—less than $600—exhibited a twenty-fold larger increase in healthcare spending after the tax refund arrival than those with more than $3,500 in liquid assets.
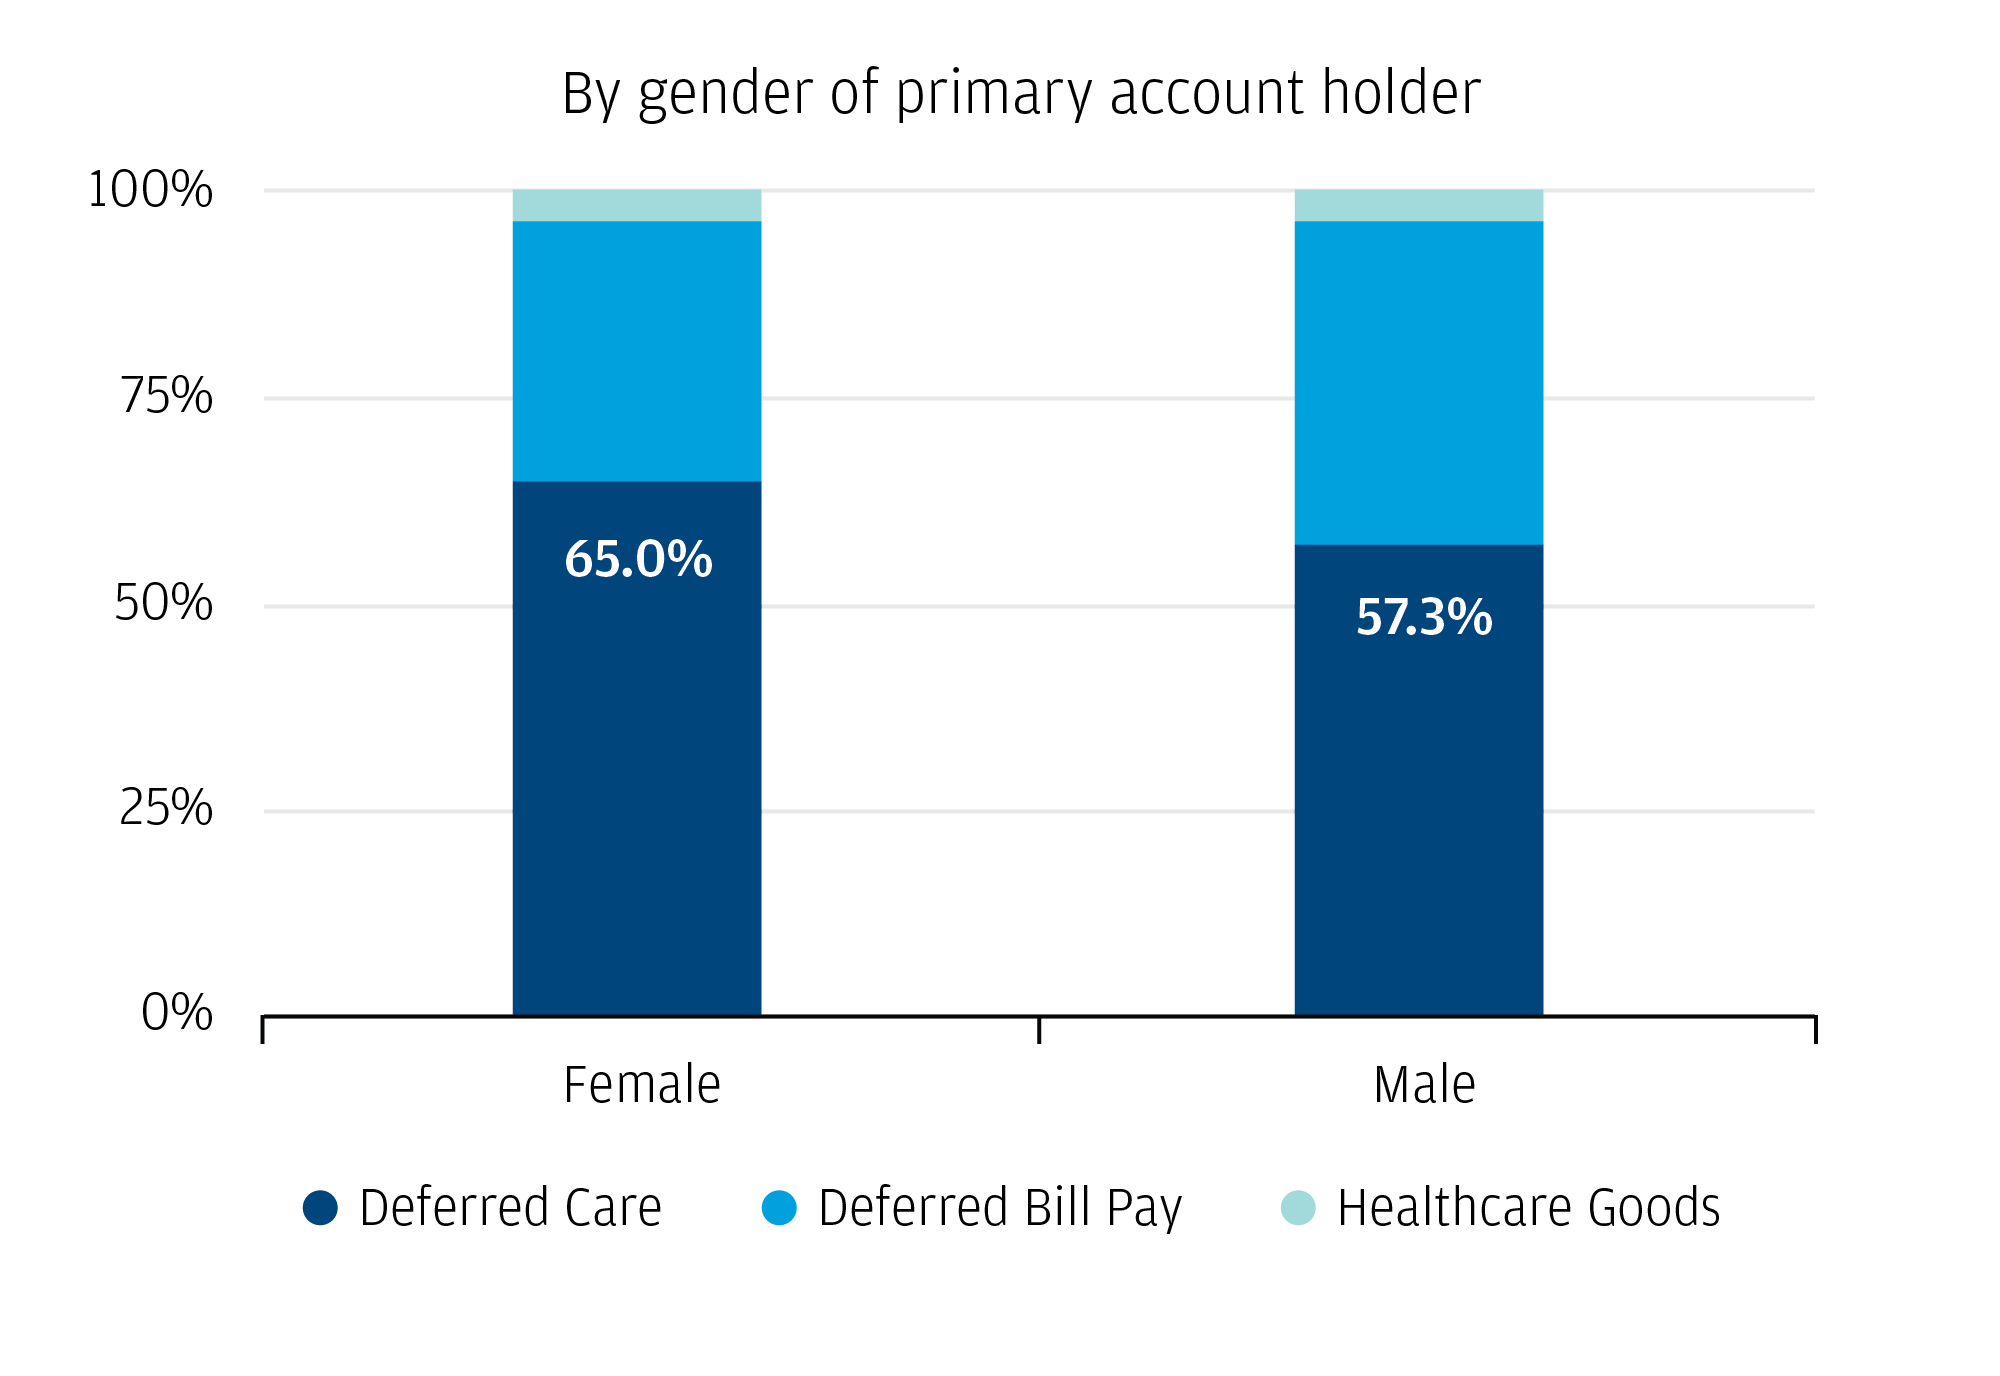
In addition, we show that women increased their spending by a larger proportion (24 percent) compared to men (20 percent) over those 75 days following the arrival of the tax refund (Figure 4). For women a larger share of that increase in healthcare spending after the arrival of the tax refund represented deferred healthcare—among female account holders 65 percent of tax-refund triggered healthcare spending was in-person at a healthcare provider compared to 57 percent among male account holders (Figure 5).
Figure 4: Upon arrival of the tax refund, female account holders increased their healthcare expenditures to a greater degree than male account holders
Percent increase in healthcare spending during 75 days after refund
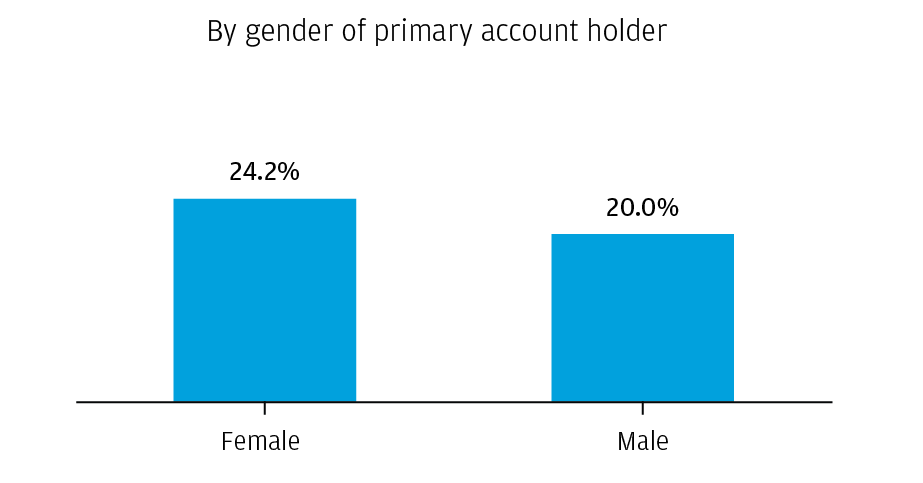
Figure 5: Deferred care represented a larger fraction of tax-refund triggered healthcare spending form female account holders compared to male account holders
Percent of spending response by type
Taken together, these findings highlight the critical role liquid assets play in determining not only when people pay for, but also consume, healthcare services. They suggest that the link between physical and financial health may be particularly strong for women. They also underscore the importance of designing and implementing policies and solutions to improve women’s ability to weather financial volatility, including healthcare expenses. For example, two important policy questions are: first, whether periodic tax payments would reduce the deferral of healthcare services throughout the year, and second, whether there might be a way to increase the flexibility with which families pay for healthcare services. To the extent that healthcare and other spending needs may arise outside of tax refund season, fixing one of the largest cash flow events of the year to only this time frame virtually guarantees that some will have to defer care until their tax refund arrives.
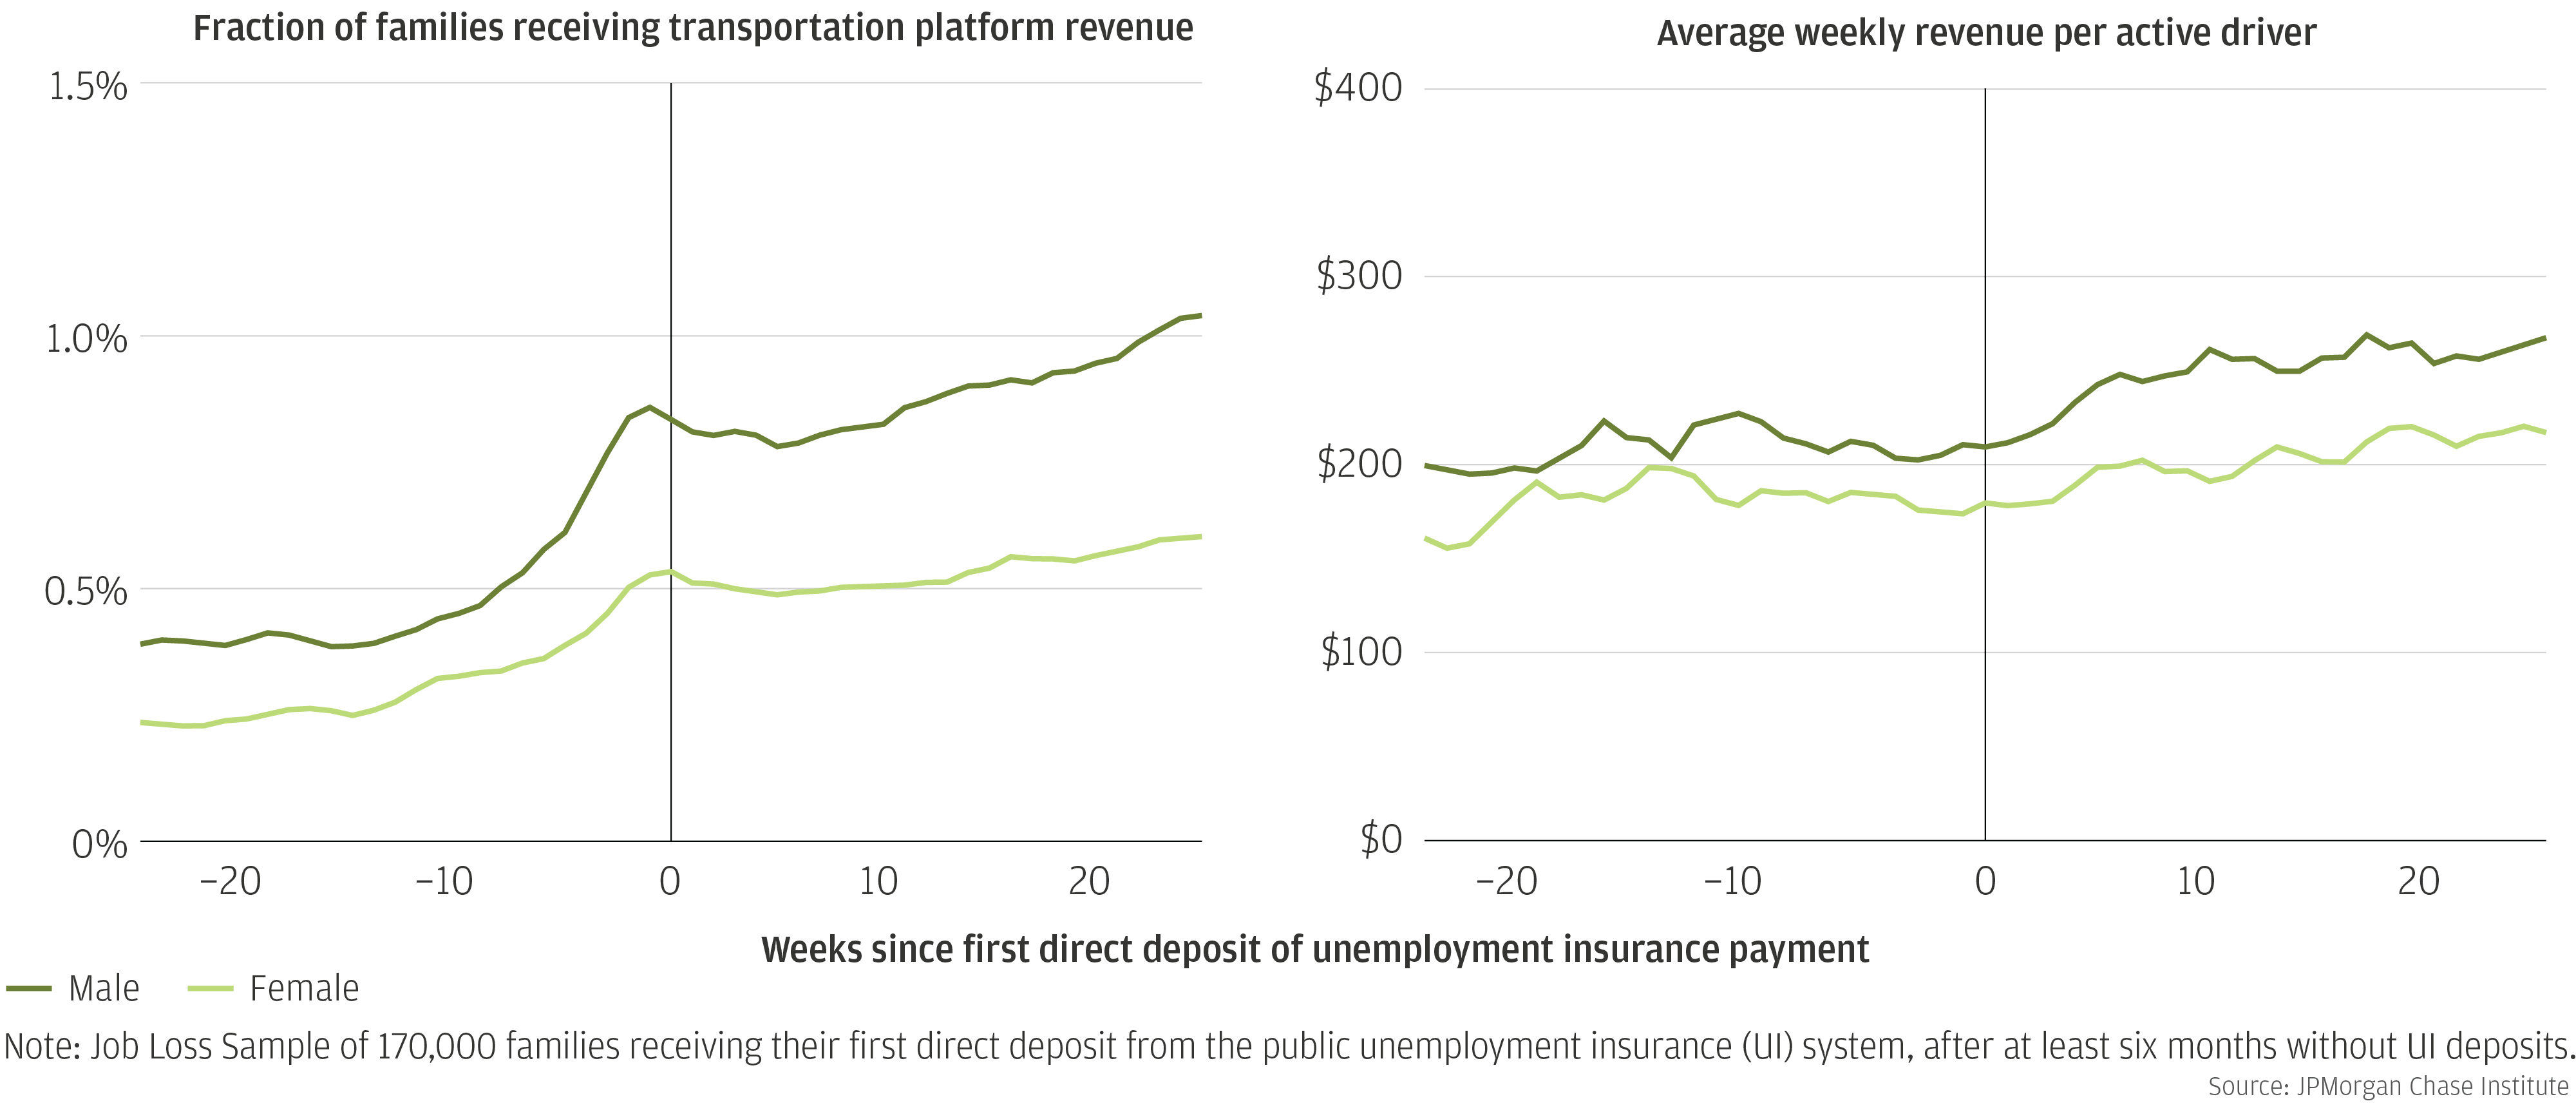
In further looking at how families manage economic hardship, we explore how families use the Online Platform Economy as an income-smoothing tool. In our report Bridging the Gap: How Families Use the Online Platform Economy to Manage their Cash Flow, we explore gender differences by leveraging the JPMorgan Chase Institute Online Platform Economy Data Set and restricting our analysis to the transportation sector, where most families are most likely to turn after an involuntary job loss. We aimed to understand if the gender differences we have previously observed in transportation platform participation—that platform drivers are predominantly male—persist in families’ use of transportation platforms to smooth their incomes through job loss.
We tracked platform participation around the event of involuntary job loss, indicated by a family’s first receipt of unemployment insurance. In Figure 6 below, the left panel confirms that participation on transportation platforms increases more sharply among families where the primary account holder is a man. The right panel shows that average revenues per driver remain stable in both types of families even as participation rates are increasing in the weeks leading up to the first unemployment insurance payment, resulting in a stable gender revenue gap of around $30 throughout the period.. Notably, the gap increases to about $50 in the weeks after.
Put differently, the Online Platform Economy may be more available as an income-smoothing tool between jobs for men than for women. To the extent that this difference may reflect structural disparities, it may be a worthy focus of attention by both policymakers and platform providers.
Figure 6: Transportation platform participation and average weekly revenues increase more sharply around job loss for male account holders than female account holders
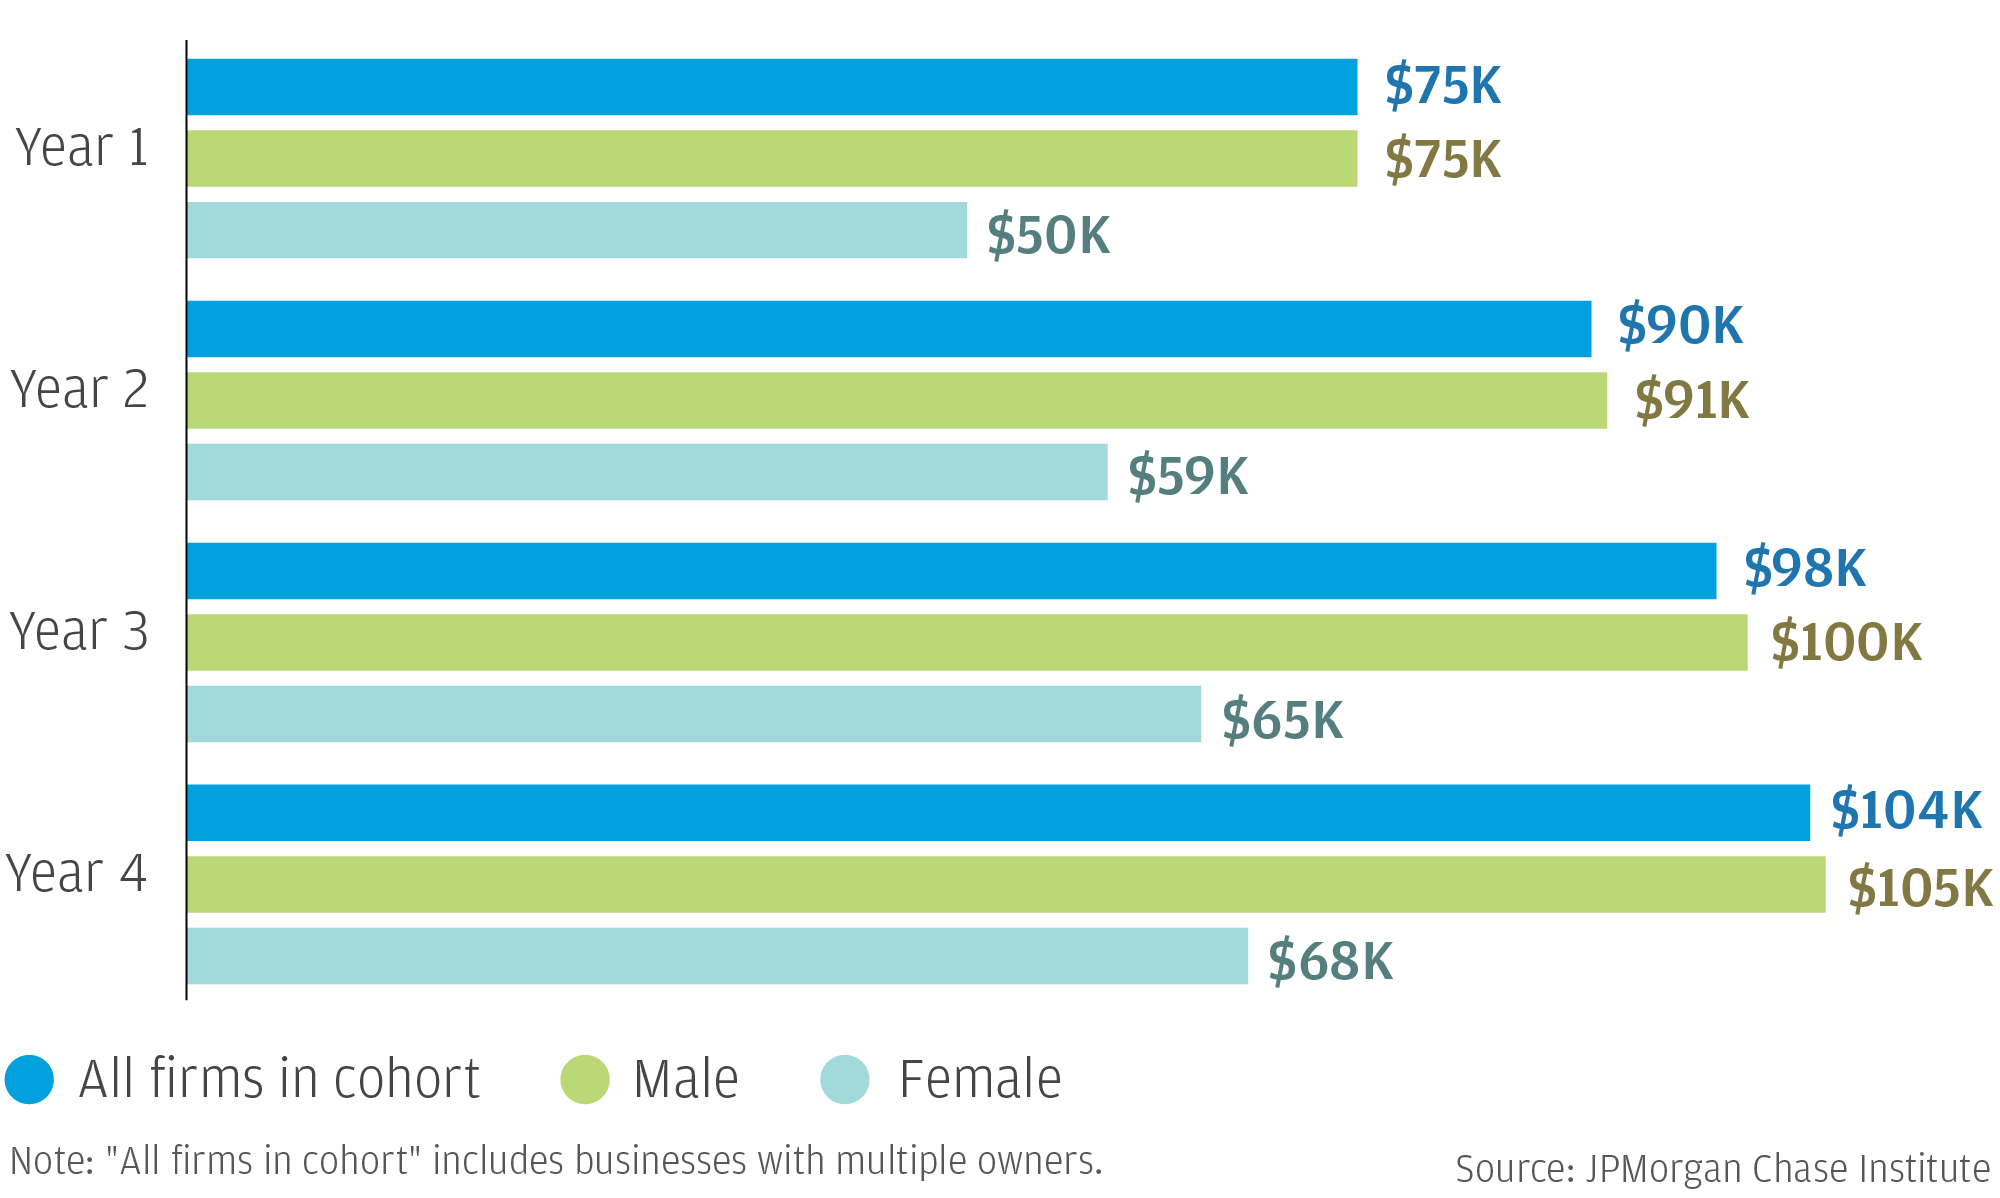
The Institute’s research has also explored gender disparities in the small business sector. In our report, Gender, Age, and Small Business Financial Outcomes, we find that small businesses vary substantially in their growth trajectories and financial outcomes depending on owner demographics. Women-owned small businesses have 34 percent lower first-year revenues than male-owned businesses, generating $50,000 in the first year, while male-owned firms saw $75,000 in first-year revenue. This difference persists as firms grow, with women-owned firms generating $68,000 in revenue in their fourth year, compared to $104,000 for male-owned firms.
Figure 7: Median revenues for small businesses in the 2013 cohort, by gender and year
Additionally, women-owned small businesses are underrepresented among firms that leverage external financing to drive growth, representing only 18 percent of small businesses that rely substantially on external financing. However, despite lower revenues and slower growth, women-owned businesses survive at the same rate as male-owned firms.
Targeted solutions that support women-owned small business success would not only contribute to reducing gender inequalities, but policies that help women start larger businesses and grow their businesses could have a material impact on the U.S. economy. Women-owned businesses are just as likely to survive as male-owned businesses, but they start smaller and stay smaller due to lower revenue growth, resulting in lower relative impact on the economy. If women-owned businesses started with the same revenue levels as their male-owned counterparts and experienced the same levels of revenue growth, they would substantially increase the overall economic contributions of the small business sector to the U.S. economy.
These insights contribute to a larger narrative of marginalized groups experiencing disproportionate financial burdens, and our research emphasizes the need for policies and decision-makers to consider women’s experiences in efforts going forward. Healthcare and tax policies can offer more flexibility in when families receive their tax refund and pay for healthcare; platform providers and regulators should consider the gender disparity in transportation platform participation and consider ways to support women utilizing this important income-smoothing tool; and policies, non-profits, and businesses ought to support and finance women-owned small businesses as an investment in economic growth. These findings shed a new light on gender inequality in America, and the JPMC Institute will continue to investigate these dynamics across financial themes.