Research

Coping with Costs

Big Data on Expense Volatility and Medical Payments

February 1, 2017

Findings

Executive summary

Americans across the income spectrum experience tremendous income and expense volatility, and this volatility has been on the rise. This volatility tests the financial resilience of American families. In Weathering Volatility, we estimated that median-income families needed $4,800 in liquid assets to weather 90 percent of the income and expense volatility observed, but that they had only $3,000—a shortfall of $1,800. In Paychecks, Paydays, and the Online Platform Economy we documented that most income volatility stems from labor income and, specifically, variation in take-home pay within a job rather than job transitions.

In this report, the JPMorgan Chase Institute assembled a de-identified data asset of nearly 250,000 Chase customers between 2013 and 2015 in order to study how consumers’ expenses vary over time and how their financial behavior changes when faced with extraordinary payments. This high-frequency panel of family finances—weighted to represent the age and income distribution of the nation—provides a first ever look into the components of expense volatility based on real financial transactions and the changes to family income, expenses, assets, and liabilities that coincide with extraordinary medical payments.
01

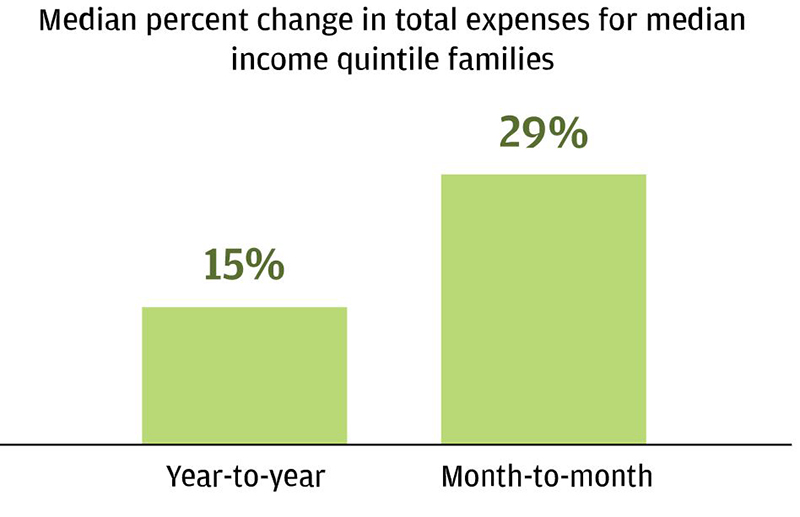
Expenses fluctuated by nearly $1,300 or 29 percent on a month-to-month basis for median-income households.

High frequency data highlighted that expenses were more volatile on a month-to-month than year-to-year basis.

Median percent change in total expenses for median income quintile families

High frequency data highlighted that expenses were more volatile on a month-to-month than year-to-year basis.

Median percent change in total expenses for median income quintile families

Year-to-year Month-to-month
15% 29%

Source: JPMorgan Chase Institute

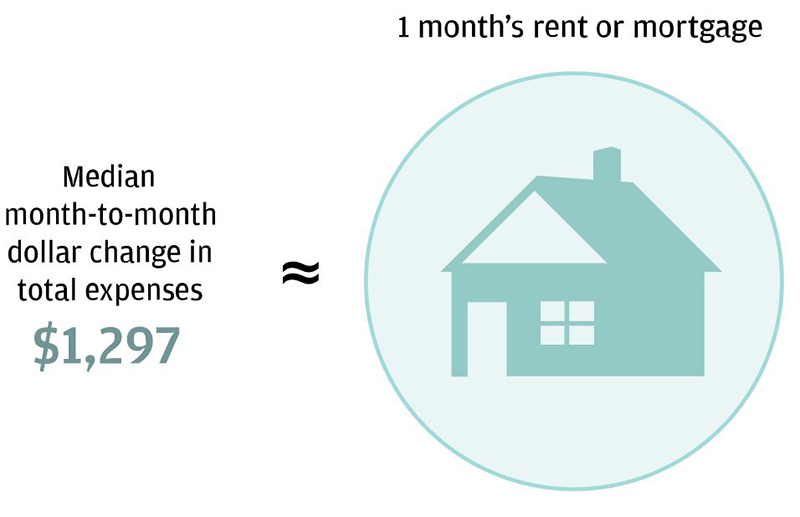
In dollar terms, monthly fluctuations in total expenses were roughly equivalent to a family’s rent or mortgage payment.

In dollar terms, monthly fluctuations in total expenses were roughly equivalent to a family’s rent or mortgage payment.

Median month-to-month dollar change in total expenses was $1,297, roughly equivalent to a family’s rent or mortgage payment.

Median month-to-month dollar change in total expenses was $1,297, roughly equivalent to a family’s rent or mortgage payment.

Source: JPMorgan Chase Institute

01

Expense volatility was high across the income and age spectrum. While older families typically had less volatile incomes, they exhibited a larger range of income and expense volatility.

Month-to-month percent change in income and expenses, by income and age

Month-to-month percent change in income and expenses, by income and age

Expense volatility was high across the income and age spectrum. While older families typically had less volatile incomes, they exhibited a larger range of income and expense volatility.

Month-to-month percent change in income and expenses, by income

Report contains a bubble chart showing month-to-month percent change in income and expenses as between 25% and 40% across incomes of $5,000 to $150,000

01

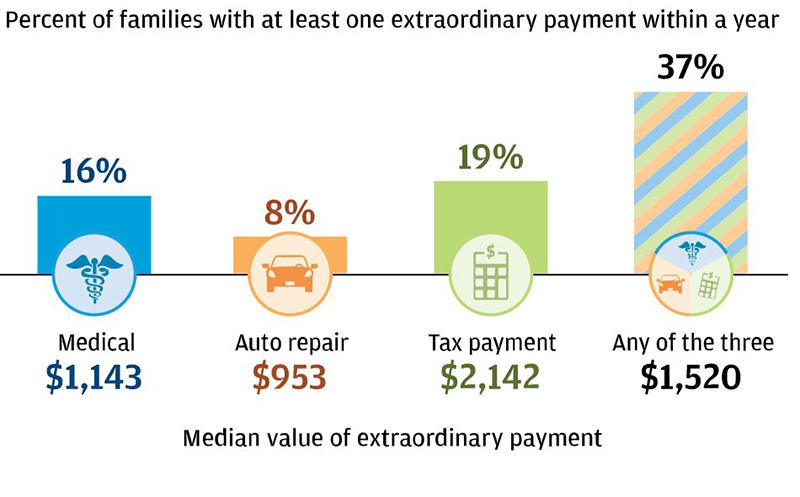
Almost four in ten families—particularly middle-income and older families—made an extraordinary payment of over $1,500 related to medical services, auto repair, or taxes.

We defined an extraordinary payment as:

  • Large in magnitude: At least $400 in magnitude and more than 1 percent of annual income
  • Unusual: More than 2 standard deviations away from the individual’s normal monthly mean expense in this category
Percent of families with at least one extraordinary payment within a year.

We defined an extraordinary payment as:

  • Large in magnitude: At least $400 in magnitude and more than 1 percent of annual income
  • Unusual: More than 2 standard deviations away from the individual’s normal monthly mean expense in this category

Percent of families with at least one extraordinary payment within a year.

  Medical Auto repair Tax payment Any of the three
Percent of families with at least one extraordinary payment within a year 16% 8% 19% 37%
Median value of extraordinary payment $1,143 $953 $2,142 $1,520

Source: JPMorgan Chase Institute

01

Extraordinary medical payments were more likely to occur in months with higher income and specifically during tax season.

Extraordinary medical payments were more likely to occur in months with higher income. Total income was $163 or 4 percent higher in months with a major medical payment. The income increase stemmed mostly from tax refunds and not labor income and was still small in magnitude compared to the mean medical payment of $2,089.

Decomposition of dollar (percent) difference in income in month with a major medical payment relative to the baseline

Extraordinary medical payments were more likely to occur in months with higher income. Total income was $163 or 4 percent higher in months with a major medical payment. The income increase stemmed mostly from tax refunds and not labor income and was still small in magnitude compared to the mean medical payment of $2,089.

Decomposition of dollar (percent) difference in income in month with a major medical payment relative to the baseline*

  Dollar Percent
Tax Refund $50 66%
Government $20 27%
Capital $10 13%
Labor ($4) -6%
Total categorized income $77 100%
Uncategorized income (e.g. paper checks) $87 -
Total $163 -

Total income was $163 (4%) higher in the month with a major medical payment.

* Baseline period corresponds to four to six months prior to the payment month.

Source: JPMorgan Chase Institute

01

Prior to a major medical payment, families garnered significant liquid assets but did not recover financially within 12 months after the payment.

Major medical payments coincided with short-term improvements in income, assets, and liabilities, as well as lasting negative changes in not just assets and liabilities but also income and non-medical expenses.

Major medical payments coincided with short-term improvements in income, assets, and liabilities, but lasting negative changes in not just assets and liabilities but also income and non-medical expenses.

Ratio of income, non-medical expenses, liquid assets, and revolving credit card balance before and after major medical payment relative to baseline*

Months since major medical expense Income Revolving credit card balance Chase liquid assets (end of month) Non-medical spending
-6 0.9963 1.0097 0.9872 0.9936
-5 1.0019 0.9959 1.0039 1.0047
-4 1.0019 0.9944 1.0089 1.0017
-3 1.0039 0.9948 1.0182 1.0061
-2 1.0108 0.9889 1.0283 1.0102
-1 1.022 0.9845 1.0529 1.016
0 1.0416 1.0572 1.0327 1.028
1 0.9929 1.058 1.0082 1.0114
2 0.9861 1.0765 0.9899 1.0095
3 0.9815 1.0726 0.9794 1.0008
4 0.9845 1.0671 0.9835 1.0052
5 0.9901 1.0667 0.9816 0.9996
6 0.9861 1.0635 0.9825 0.9918
7 0.9861 1.071 0.9877 0.9964
8 0.9664 1.0694 0.9772 0.9911
9 0.9743 1.0765 0.9732 0.9871
10 0.9738 1.0674 0.9692 0.9885
11 0.9807 1.0847 0.975 0.9925
12 0.9715 1.0851 0.9764 0.9871

* Baseline period corresponds to four to six months prior to the payment month.

Source: JPMorgan Chase Institute

Data

From a universe of 35 million checking account customers, we assembled a de-identified data asset comprised of roughly 250,000 core Chase customers for whom we could categorize at least 80 percent of expenses. These families met the following five sampling criteria:

From a universe of 35 million checking account customers, we assembled a de-identified data asset comprised of roughly 250,000 core Chase customers for whom we could categorize at least 80 percent of expenses. These families met the following five sampling criteria:

  • Had at least five outflows from their checking account in every month.
  • Had a Chase consumer credit product and therefore a credit bureau record on file.
  • Spent less than 20 percent of total expenses through channels that cannot be categorized (e.g. checks, cash).
  • Used their debit or credit at least once each month and have transacted at least once in the following categories: Grocery, Restaurant, Fuel or Transit, Clothing Miscellaneous Retail, Drug Store, Home Supply or Improvement, and Entertainment.
  • Made at least one housing payment in each year.

Conclusion

These findings highlight the critical role liquid assets play in managing expense spikes and the need for policies and solutions to promote emergency savings. While many families experienced an increase in income in the month in which they made a major medical payment, liquid assets were the primary source of funding to cover the medical payment. Our evidence also underscores the connections between financial health and physical health. First, the timing of medical payments was linked to ability to pay. Families may have delayed either medical treatment or payment of their medical bill until they were able to pay. The second link is that major medical payments were associated with lower income, non-medical expenses, and liquid assets and higher credit card debt a year later. This highlights the reality that families are not fully insured against the economic consequences of major health events. Older families in particular could benefit from more customized solutions as they exhibited a greater range in income and expense volatility and were also more likely to make major medical payments. More broadly, better solutions could help families accumulate liquid assets and predict, manage, and afford expense spikes. Integrated, high-frequency data of income, expenses, assets, and liabilities shed new light on expense volatility and how behavior changes with this volatility. This is critical to improving policies and solutions to strengthen the financial resilience of American families.

Authors

Diana Farrell

Diana Farrell

Founding and Former President & CEO

Fiona Greig

Fiona Greig

Former Co-President