Research

FX Markets Move on Surprise News

Institutional Investor Trading Behavior around Brexit, the U.S. Election, and the Swiss Franc Floor

June 12, 2018

Findings

Executive Summary

In this inaugural JPMorgan Chase Institute report on financial markets, we examined three recent events that had major impacts on foreign exchange (FX) markets:

  1. The decision by the Swiss National Bank (SNB) to remove their floor on the Swiss Franc vs. Euro exchange rate (EUR/CHF): on January 15, 2015, at 9:30 a.m. GMT, the SNB abandoned its floor on the EUR/CHF exchange rate via a surprise press release. The announcement shocked the FX market—EUR/CHF dropped 12.3 percent over the next few hours.

  2. The Brexit referendum: on June 23, 2016, the United Kingdom (UK) held a referendum on whether the UK should remain a member of the European Union (EU). The “Leave” win led to an 11 percent drop in GBP/USD overnight.

  3. The 2016 US Presidential Election: On November 8, 2016, the United States (US) held its Presidential Election. The unexpected Trump victory led to an 8.3 percent rise in USD/MXN overnight.

All three events shared one important quality—they had unexpected outcomes that led to the largest one-day moves in these three exchange rates in the last 20 years—that made them ideal candidates for research aimed at building a better understanding of institutional investor trading behavior. With this research objective in mind, we examined institutional investor trades in FX markets in the days and hours leading up to, during, and after each event. We analyzed total trading volumes (a measure of trading activity) and net flows (a measure of risk transferred) across all institutional investors in our sample, and then examined net flows at the investor sector and region level. Finally, we looked at transactions within each investor type to observe within-sector variation in trading behavior.

Data Visualization

Discover how various types of institutional investors reacted to three recent events that led to the largest one-day moves in the relevant currencies in the last 20 years: the removal of the minimum exchange rate policy by the Swiss National Bank (SNB), the Brexit referendum, and the 2016 U.S. Election. See a timeline of how each event unfolded as well as net flows for each investor type throughout the event days as the news broke and exchange rates repriced sharply.

View the Data Visualization about how FX Markets move on Surprise News

Data

We constructed a unique, de-identified trade-level data asset that includes all available institutional investor transactions where the Markets Division of J.P. Morgan’s Corporate & Investment Bank acted as the market maker. This data asset allows for a highly detailed look at the behavior of institutional investors across all regions and in all asset classes, as our data are more granular, timely, and comprehensive than publicly available data. For this report we narrowed our focus to a sample of FX transactions that took place around three specific events.

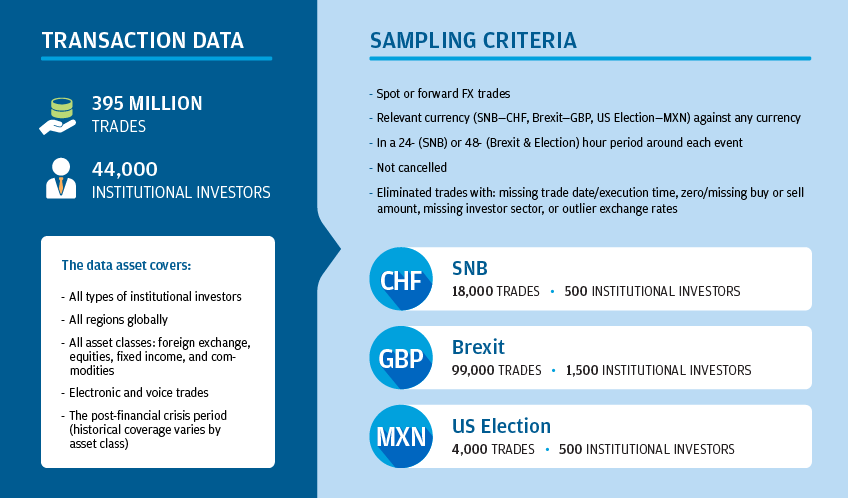
Infographic describes about transaction Data is made up of 395 million trades and 44,000 institutional investors

DATA

Transaction Data is made up of 395 million trades and 44,000 institutional investors.

The data asset includes:

  • All types of institutional investors
  • All regions globally
  • All asset classes: foreign exchange, equities, fixed income, and commodities
  • Electronic and voice trades
  • The post-financial crisis period (historical coverage varies by asset class)

Sampling Criteria is as follows:

  • FX spot or forward trades
  • Relevant currency (SNB—CHF, Brexit—GBP, US Election—MXN) against any currency
  • In a 24- (SNB) or 48- (Brexit & Election) hour period around each event
  • Not cancelled
  • Dropped trades with: missing trade date/execution time, zero/missing buy or sell amount, missing investor sector, and outlier exchange rates

The following three events are examined:

  • SNB (CHF): 18,000 trades and 500 institutional investors
  • Brexit (GBP): 99,000 trades and 1,500 institutional investors
  • US Election (MXN): 4,000 trades and 500 institutional investors

© 2018 JPMorgan Chase & Co.

01

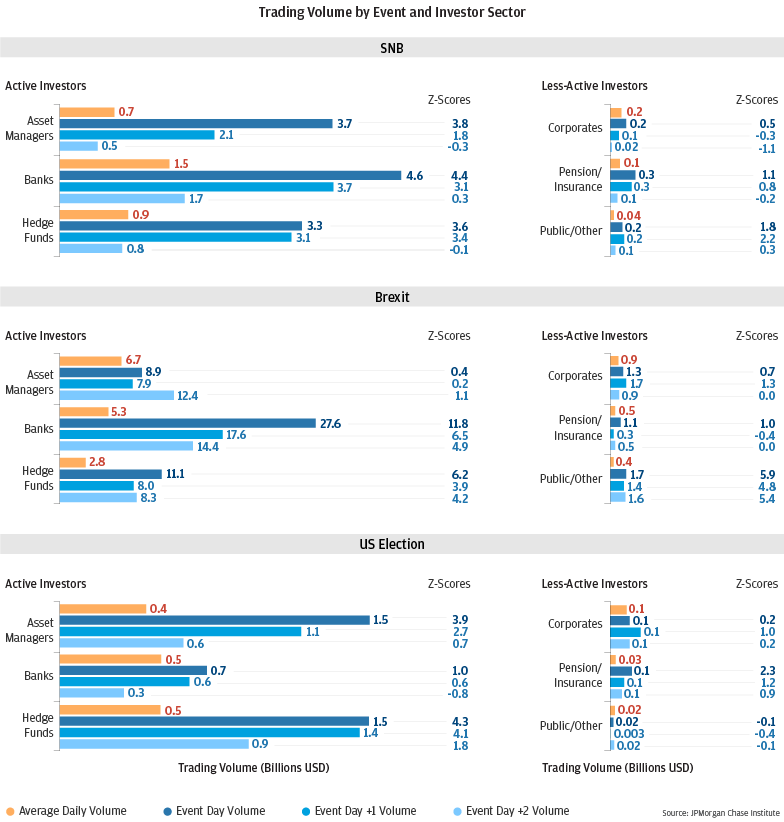
FX trading volumes for hedge funds, asset managers, and banks spiked during the three events. In contrast, volumes for the corporate, pension/insurance, and public/other investor sectors barely increased.

While overall FX trading volumes spiked, not all investor sectors increased their trading activity relative to their average daily volume. Trading volumes from hedge funds, asset managers, and banks (the active investor sectors) were particularly elevated on the event day itself. In contrast, corporate, pension/insurance, and public/other investors (the less-active investor sectors) showed little change in trading volumes on the three event days relative to their average daily volumes, despite the largest one-day moves in the relevant currencies in 20 years.

Bar charts describes about trading Volume by Event and Investor Sector

FINDING ONE

Bar charts representing trading volume by event and investor sector. Data is listed in the following table.

SNB

Active Investors

Active Investor Type Event Day Notional Gross Z-Scores
Asset Managers Average Daily Volume 0.7  
Asset Managers Event Day Volume 3.7 3.8
Asset Managers Event Day +1 Volume 2.1 1.8
Asset Managers Event Day +2 Volume 0.5 -0.3
Banks Average Daily Volume 1.5  
Banks Event Day Volume 4.6 4.4
Banks Event Day +1 Volume 3.7 3.1
Banks Event Day +2 Volume 1.7 0.3
Hedge Funds Average Daily Volume 0.9  
Hedge Funds Event Day Volume 3.3 3.6
Hedge Funds Event Day +1 Volume 3.1 3.4
Hedge Funds Event Day +2 Volume 0.8 -0.1


Less Active Investors

Inactive Investor Type Event Day Notional Gross Z-Scores
Corporates Average Daily Volume 0.2  
Corporates Event Day Volume 0.2 0.5
Corporates Event Day +1 Volume 0.1 -0.3
Corporates Event Day +2 Volume 0.02 -1.1
Pension/Insurance Average Daily Volume 0.1  
Pension/Insurance Event Day Volume 0.3 1.1
Pension/Insurance Event Day +1 Volume 0.3 0.8
Pension/Insurance Event Day +2 Volume 0.1 -0.2
Public/Other Average Daily Volume 0.04  
Public/Other Event Day Volume 0.2 1.8
Public/Other Event Day +1 Volume 0.2 2.2
Public/Other Event Day +2 Volume 0.1 0.3


Brexit

Active Investors

Active Investor Type Event Day Notional Gross Z-Scores
Asset Managers Average Daily Volume 6.7  
Asset Managers Event Day Volume 8.9 0.4
Asset Managers Event Day +1 Volume 7.9 0.2
Asset Managers Event Day +2 Volume 12.4 1.1
Banks Average Daily Volume 5.3  
Banks Event Day Volume 27.6 11.8
Banks Event Day +1 Volume 17.6 6.5
Banks Event Day +2 Volume 14.4 4.9
Hedge Funds Average Daily Volume 2.8  
Hedge Funds Event Day Volume 11.1 6.2
Hedge Funds Event Day +1 Volume 8.0 3.9
Hedge Funds Event Day +2 Volume 8.3 4.2


Less Active Investors

Inactive Investor Type Event Day Notional Gross Z-Scores
Corporates Average Daily Volume 0.9  
Corporates Event Day Volume 1.3 0.7
Corporates Event Day +1 Volume 1.7 1.3
Corporates Event Day +2 Volume 0.9 0.0
Pension/Insurance Average Daily Volume 0.5  
Pension/Insurance Event Day Volume 1.1 1.0
Pension/Insurance Event Day +1 Volume 0.3 -0.4
Pension/Insurance Event Day +2 Volume 0.5 0.0
Public/Other Average Daily Volume 0.4  
Public/Other Event Day Volume 1.7 5.9
Public/Other Event Day +1 Volume 1.4 4.8
Public/Other Event Day +2 Volume 1.6 5.4


US Election

Active Investors

Active Investor Type Event Day Notional Gross Z-Scores
Asset Managers Average Daily Volume 0.4  
Asset Managers Event Day Volume 1.5 3.9
Asset Managers Event Day +1 Volume 1.1 2.7
Asset Managers Event Day +2 Volume 0.6 0.7
Banks Average Daily Volume 0.5  
Banks Event Day Volume 0.7 1.0
Banks Event Day +1 Volume 0.6 0.6
Banks Event Day +2 Volume 0.3 -0.8
Hedge Funds Average Daily Volume 0.5  
Hedge Funds Event Day Volume 1.5 4.3
Hedge Funds Event Day +1 Volume 1.4 4.1
Hedge Funds Event Day +2 Volume 0.9 1.8


Less Active Investors

Inactive Investor Type Event Day Notional Gross Z-Scores
Corporates Average Daily Volume 0.1  
Corporates Event Day Volume 0.1 0.2
Corporates Event Day +1 Volume 0.1 1.0
Corporates Event Day +2 Volume 0.1 0.2
Pension/Insurance Average Daily Volume 0.03  
Pension/Insurance Event Day Volume 0.1 2.3
Pension/Insurance Event Day +1 Volume 0.1 1.2
Pension/Insurance Event Day +2 Volume 0.1 0.9
Public/Other Average Daily Volume 0.02  
Public/Other Event Day Volume 0.02 -0.1
Public/Other Event Day +1 Volume 0.003 -0.4
Public/Other Event Day +2 Volume 0.02 -0.1


Source: JPMorgan Chase Institute

© 2018 JPMorgan Chase & Co.

01

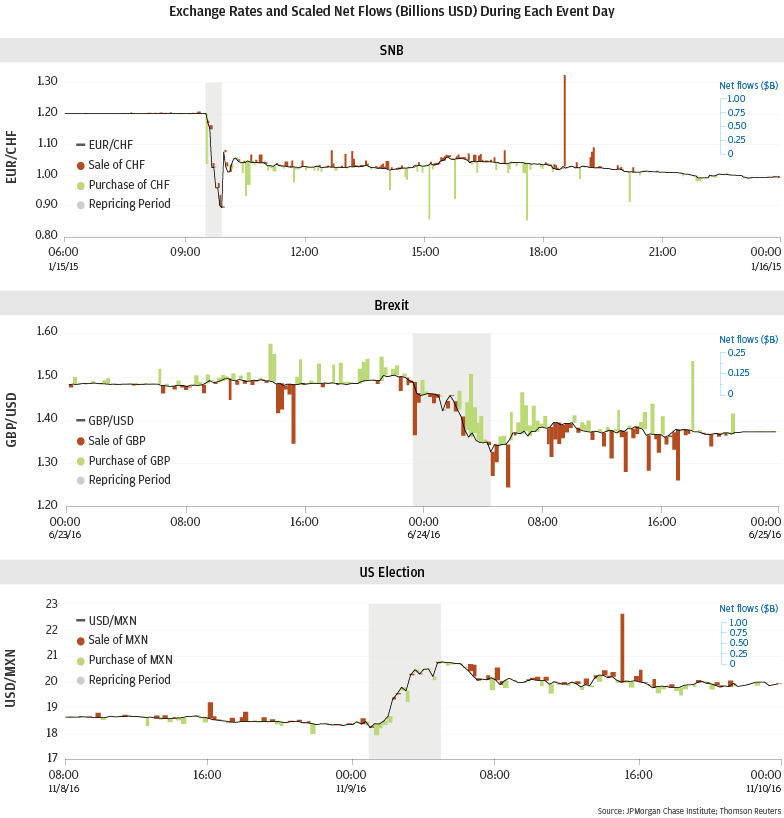
Institutional investors traded significant amounts of FX risk during the events, but their net flows alone cannot explain the sharp exchange rate movements during the repricing periods.

Our data show that net flows, or risk transferred, by institutional investors during each event was large. However, net flows coincident with the sharp moves in exchange rates were no larger than net flows that took place after exchange rates stabilized, indicating that the exchange rate moves just after the news broke were much larger than net flows alone would dictate. Market liquidity for the three currencies we examined was likely lower immediately after the news broke, and this may partially account for the disproportionate impact of net flows during the repricing periods.

Graph describes about Exchange Rates and Scaled Net Flows (Billions USD) During Each Event Day

FINDING TWO

Time series showing movement in the exchange rate and net flows by institutional investors. During all three events, risk transferred by institutional investors was large. However, net flows concurring with sharp moves in the exchange rates did not significantly exceed net flows that took place after exchange rates stabilized. This indicates that the exchange rate moves immediately after the news breaking were larger that net flows alone would dictate. It is possible that market liquidity for the three currencies examined was lower immediately after the news broke, which may partially account for the disproportionate impact of net flows during the repricing periods.

Source: JPMorgan Chase Institute

© 2018 JPMorgan Chase & Co.

01

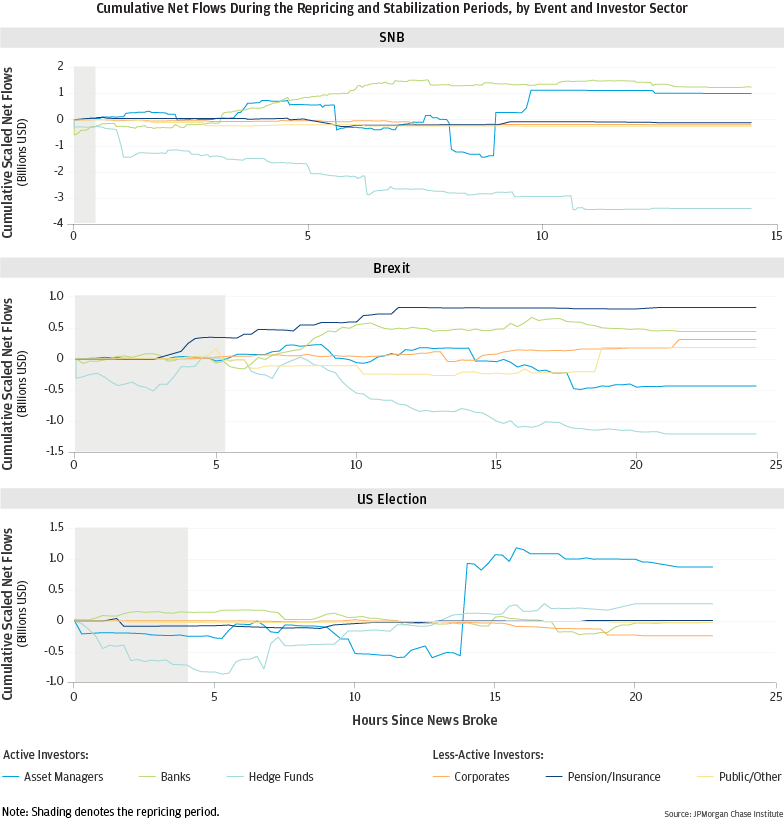
Only hedge funds consistently transferred risk immediately after news broke and as currencies repriced sharply. Other investors transferred risk but only after exchange rates stabilized.

Hedge funds traded immediately after news broke and exchange rates began to reprice, transferring large amounts of risk during periods of high exchange rate volatility during all three events. In doing so, hedge funds participated in the establishment of the post-news equilibrium market price. Other investor sectors transferred risk only after market prices had stabilized. These results imply that market makers established a new equilibrium exchange rate without the benefit of net flow information from all the investor sectors and regions.

Graph describes about Cumulative Net Flows During the Repricing and Stabilization Periods, by Event and Investor Sector

FINDING THREE

Time series showing cumulative net flows for different investor sectors during repricing and stabilization periods. For all three events, hedge funds traded immediately after news broke and exchange rates began to reprice. They transferred large amounts of risk during period of high exchange rate volatility. In contrast, other investor sectors only transferred risk after market prices had stabilized.

Source: JPMorgan Chase Institute

© 2018 JPMorgan Chase & Co.

01

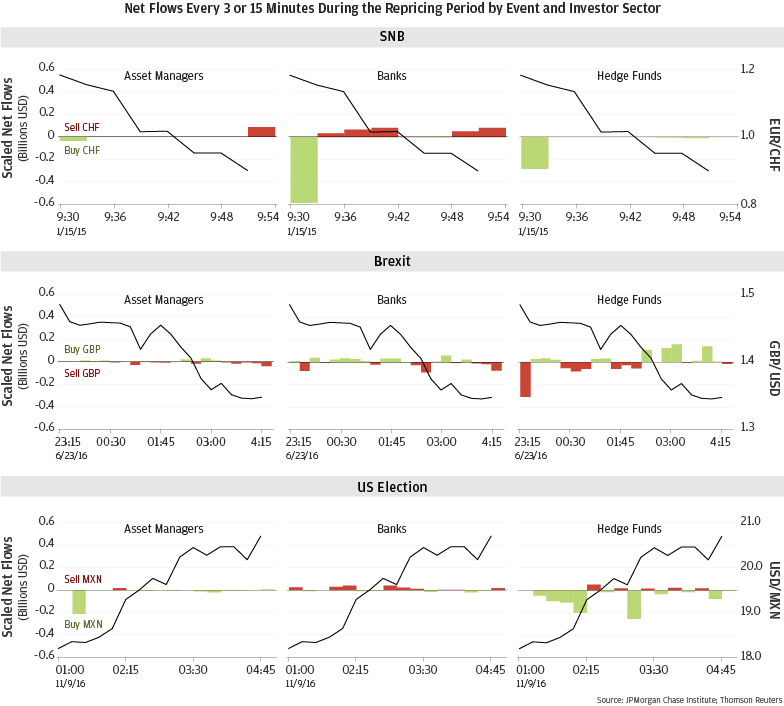
The active investor sectors played different roles in each event: During the SNB event, they all bought CHF, trading in the direction of the prevailing move in exchange rates; during the Brexit event their net flows were mixed; and during the US Election event they bought MXN, trading against the prevailing move in exchange rates.

Hedge funds, asset managers, and banks bought CHF as it appreciated sharply in the minutes after the minimum exchange rate policy was removed, leaving market makers as the only market participants selling CHF during this critical period. In contrast, the active investor sectors had a mixed reaction after Brexit, as their net flows reflected both buying and selling of GBP. During the U.S. Election event, these three investor sectors were buying MXN as it depreciated, trading against the prevailing direction of the exchange rate. It is likely that the active investor sectors were all buying CHF after the SNB event because the surprise announcement did not allow them to prepare. While the outcomes were unexpected, the timing of the Brexit referendum and the U.S. Election were well known, giving investors the opportunity to transact ahead of the events and prepare for all possible outcomes.

Bar describes about Net Flows Every 3 or 15 Minutes During the Repricing Period by Event and Investor Sector

FINDING FOUR

Bar chart showing the net flows every three or fifteen minutes during the repricing period by event and investor sector. During the SNB repricing period, Asset Managers, Banks, and Hedge Funds bought and bought CHF at more extreme levels directly after the event. In the Brexit Event, both Asset Managers and Banks bought and sold GBP at more moderate levels throughout the repricing period, and Hedge Funds sold a greater amount of GBP at the beginning of the event, and proceeded to buy and sell at more moderate levels after. During the US Election repricing period, Asset Managers bought a high amount of MXN at the beginning of the event, and bought and sold very minimally thought the rest of the event. Banks mostly sold MXN, but at lower levels throughout the event, and Hedge Funds Bought at higher levels throughout the event with low sales mixed in throughout.

Source: JPMorgan Chase Institute

© 2018 JPMorgan Chase & Co.

01

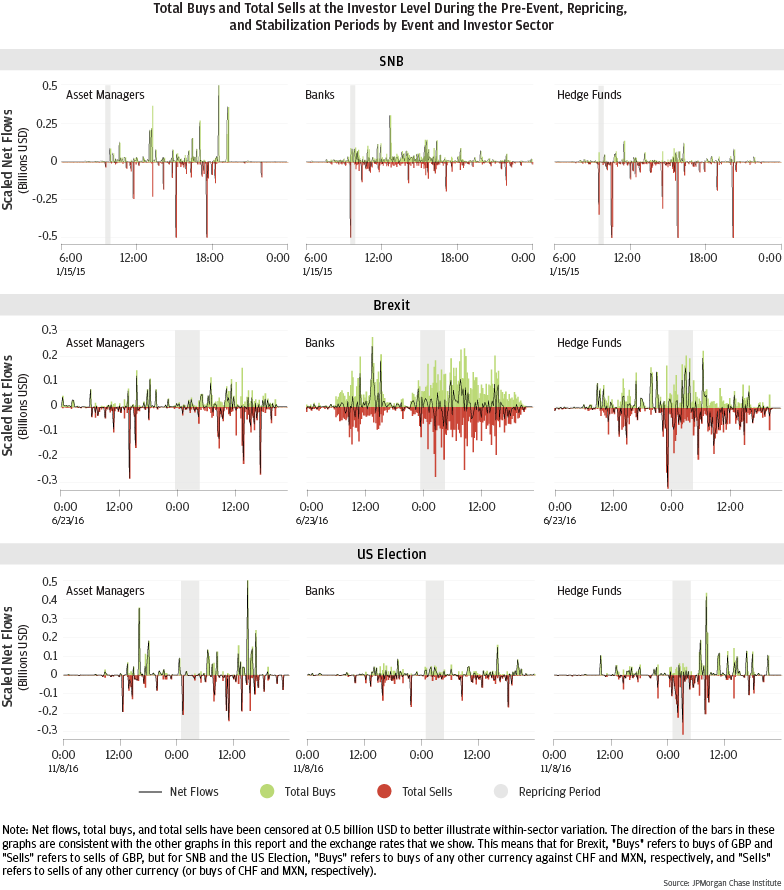
Within each investor sector, there was considerable variation in trading behavior during each event.

Regardless of the magnitude of the net flows at the sector level, in a given time interval, there was actually a significant amount of risk being transferred in both directions by investors within that sector. This within-sector variation refutes the commonly held perception that all investors in a particular sector transacted in the same direction at the same time during these three events.

Graph describes about Total Buys and Total Sells at the Investor Level During the Pre-Event, Repricing, and Stabilization Periods by Event and Investor Sector

FINDING FIVE

Time series showing the total buys and total sells at the investor level during the pre-event, repricing, and stabilization period by event and investor sector. During these periods, there was a significant amount of risk transferred in both directions by investors within each sector. This shows that all investors in a particular sector did not transact in the same direction at the same time during all three events.

Source: JPMorgan Chase Institute

© 2018 JPMorgan Chase & Co.

01

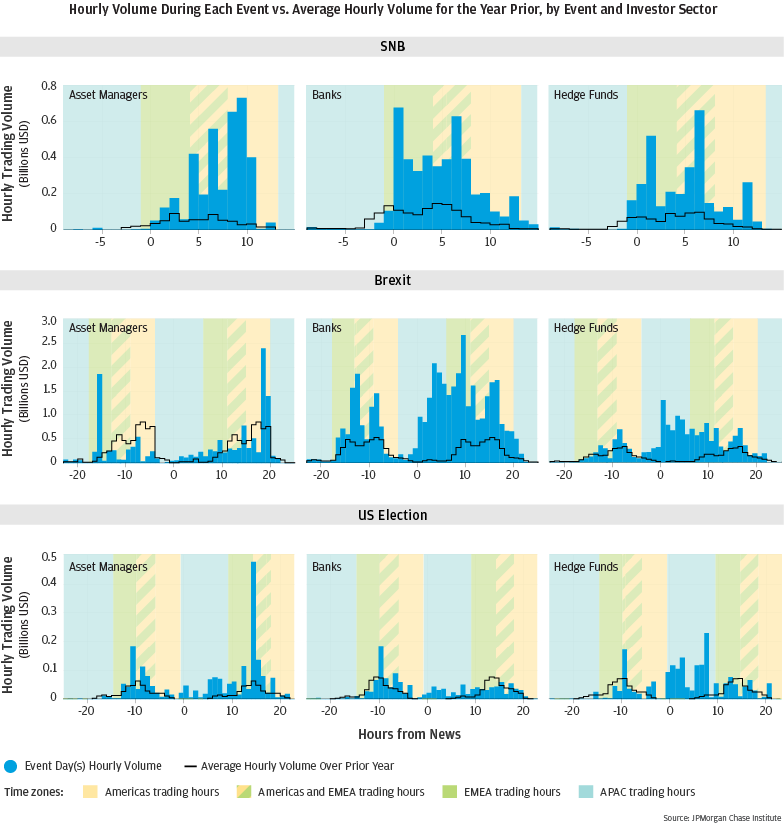
Banks and hedge funds traded higher volumes outside of their normal business hours and outside of a currency’s local market; other investor sectors did not.

Bank and hedge fund trading volumes spiked compared to average volumes during the overnight hours for both GBP and MXN, a marked change in trading behavior. These two investor sectors were also the most willing to trade outside of their normal business hours. Asset manager trading volumes only spiked during U.S. trading hours, 10 to 20 hours after the news broke for both the Brexit referendum and the U.S. Election.

Bar graph describes about Hourly Volume During Each Event vs. Average Hourly Volume for the Year Prior, by Event and Investor Sector

FINDING SIX

Histogram showing trading volume every hour during each event versus average hourly volume for the prior year by event and investor sector. For GBP and MXN (Brexit and the US Election respectively), bank and hedge fund trading volumes spiked compared to average volumes during overnight hours. This is a marked change in trading behavior. These two sectors were also the most willing to trade outside of their normal business hours. In contrast, asset manager trading volumes only spiked during US trading ours rather than overnight for those two same events.

Source: JPMorgan Chase Institute

© 2018 JPMorgan Chase & Co.

Conclusion

In this report, we examined the trading behavior of institutional investors in the hours and days leading up to, during, and after three events that had major impacts on foreign exchange markets. Our results are informative along two dimensions: financial market stability and central bank communications.

Our analysis shows that the institutional investor reactions to major market events, as reflected in trading volumes and risk transferred, varied in pace and size across sectors. The slower risk transfer response of asset managers, corporates, pension/insurance companies, and public sector investors to the three news events that changed perceptions of the fundamental value of each currency suggests these four investor sectors did not participate in the price discovery process. Furthermore, these same four investor sectors did not transact against the prevailing move in exchange rates during the volatile repricing periods of these three events, contradicting the popularly held narrative that long-only investors with long-term investment horizons act as a stabilizing force during market dislocations.

Hedge funds and market makers played an especially significant role in the market ecosystem during these three events. Hedge funds transacted actively in FX markets just after each news event broke and during volatile conditions, participating in the establishment of a post-event market equilibrium. For all three events, market makers reconciled news about the fundamental value of the relevant currency with net flows, adjusted market liquidity, and established a post-event equilibrium exchange rate. When deliberating policies that limit the trading activity of market makers or hedge funds, policymakers can use our results regarding the differential roles institutional investors played in establishing a post-event market equilibrium exchange rate to weigh this factor against any other relevant considerations.

Company policies or regulations that limit the trading activity of institutional investors to their normal business hours or the local market of a currency may prevent these investors from accessing liquidity and mitigating their risk during market-moving events. Limitations to after-hours trading may also reduce market efficiency as markets might take longer to reach a new equilibrium price. With the appropriate safeguards, controls, and security in place, after-hours trading capabilities could be a useful addition for some institutional investors.

While a role for capital controls as a tool for enhancing financial stability in certain instances has gained popularity over the last 10 years, our results imply that strict controls on FX flows may act as a hindrance to market efficiency during times of instability and prevent domestic investors from accessing liquidity abroad.

Our results could be helpful to central banks as they pursue the appropriate balance between their increasing tendency toward transparency in communicating policy actions and other critical factors, such as maintaining their credibility. Enacting unexpected policy changes via a surprise announcement (like the SNB event) may not allow investors to adjust their risk in advance which in turn leads to directional net flows that could amplify price movements. When choosing the most appropriate method to communicate policy changes, policymakers can use these results to help weigh market expectations with respect to both the timing of announcements and the outcome in the context of other pertinent factors and their desired market impacts.

When deliberating unconventional policy measures that directly change the price of financial instruments, policymakers should carefully consider how they will unwind the policy. For example, policies such as the SNB’s minimum exchange rate take pricing power away from the market and therefore can distort the incentives and, in turn, the behavior of market participants. To the extent that policymakers want to unwind such a policy and return pricing power to the market with minimal unintended market impacts, the behavior induced by the distorted incentives can become a complicating factor.
Author

Diana Farrell

Diana Farrell

Founding and Former President & CEO

Kanav Bhagat

Kanav Bhagat

Director of Financial Markets Research | JPMorgan Chase Institute

Chen Zhao

Chen Zhao

Housing Finance Research Lead