
Source: JPMorgan Chase Institute
© 2019 JPMorgan Chase & Co.

Creating thriving communities together
See how our clients and partners—from small business owners to workforce training leaders—work with JPMorganChase to drive meaningful impact and economic growth where they live and work.
Learn moreLatest news

Veteran’s Unconventional Path to Landing her Dream Job in Tech
U.S. Army Veteran Ashley Wigfall transitioned to a civilian role and charted her path to technologist through mentorship and skills training at the JPMorgan Chase tech hub in Plano, Texas.
Learn more
Research
Evidence from 4 Million Families
July 1, 2019
Findings
Student loan debt is the fastest growing household debt category, having more than doubled over the last ten years to $1.5 trillion in 2018, second only to mortgage debt, and affecting 45 million borrowers. Although the financial returns from a higher education degree over a lifetime typically exceed the costs, roughly 22 percent of student loan borrowers are in default. As a result, some have framed the “student loan crisis” as a crisis of student loan repayment rather than student loan debt. Since 2009 a range of income-driven repayment options has emerged to mitigate the financial burden for families by better aligning repayment obligations with their ability to pay.
A major complication in policymakers’ ability to propose promising solutions is the lack of data on how families—not just individual borrowers—are shouldering the burden of student loan repayment and the impact of student loan debt on other financial outcomes. The central challenge is that student loan payments and debt information are difficult to observe in conjunction with other financial outcomes, such as income, spending, and other debt payments, and certainly not on a high-frequency basis for large samples.
With this report, the JPMorgan Chase Institute aims to describe how student loan payments fit into the context of families’ larger financial lives. We offer the debate insight into a new, high-frequency cash flow perspective on student loan payments and how they relate to a family’s income, liquid assets, spending, and other debt payments. This perspective, based on student loan payment transactions observed out of a universe of 39 million Chase checking accounts between October 2012 and July 2018, is novel not just for its large sample size, but also its visibility into private and federal student loan payments (including any fees and fines), alongside income, spending, liquid assets, and other debt payments. In addition, this data asset is distinct in terms of its family perspective, which allows us to take into consideration the potential for a family to be making payments on multiple student loans and on behalf of other borrowers. This is an important, but often overlooked or hidden piece of the student loan repayment picture, given that roughly 19 percent of individuals report receiving help from others to pay off their student loans.
With this new data asset, we aim to answer five key questions:
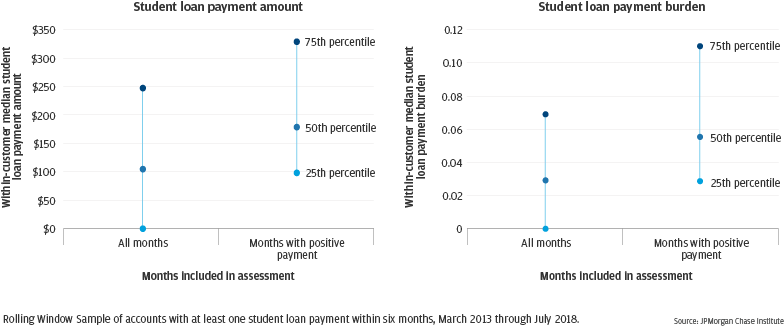
The typical family’s median student loan payment is $179 per month or 5.5 percent of take-home income in months with positive payments. One in four families spend more than 11 percent of their take-home income on student loans.
Source: JPMorgan Chase Institute
© 2019 JPMorgan Chase & Co.
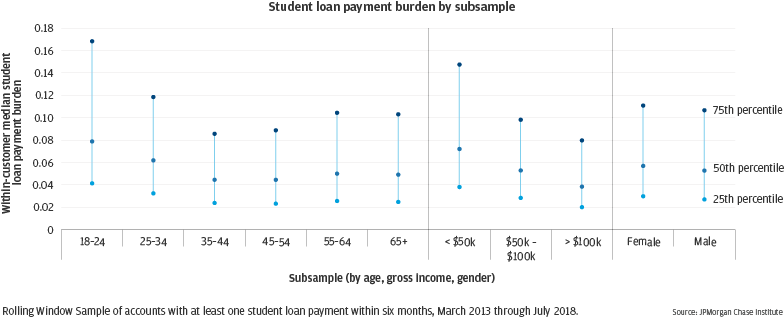
Younger and low-income families are most burdened by student loan payments, but there is no material difference in burden by male versus female account holders.
Source: JPMorgan Chase Institute
© 2019 JPMorgan Chase & Co.
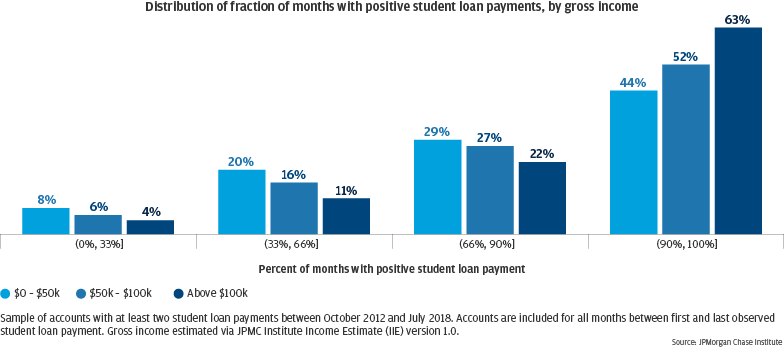
While overall 54 percent of families make consistent student loan payments, low-income families are less likely to make consistent loan payments (44 percent) compared to high-income families (63 percent).
Source: JPMorgan Chase Institute
© 2019 JPMorgan Chase & Co.
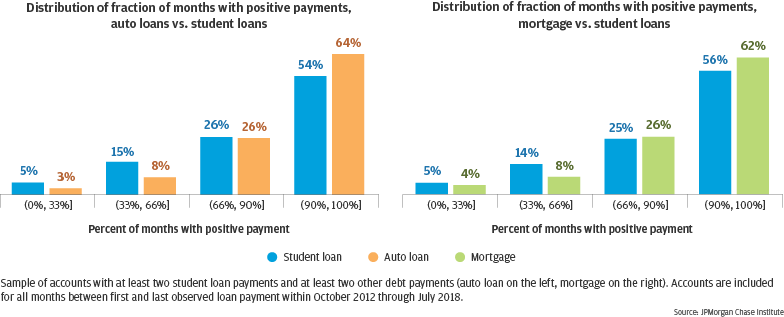
Among families actively paying multiple loans, the proportion making consistent payments is lower for student loans than auto loans (10 percentage point difference) and mortgages (6 percentage point difference).
Source: JPMorgan Chase Institute
© 2019 JPMorgan Chase & Co.
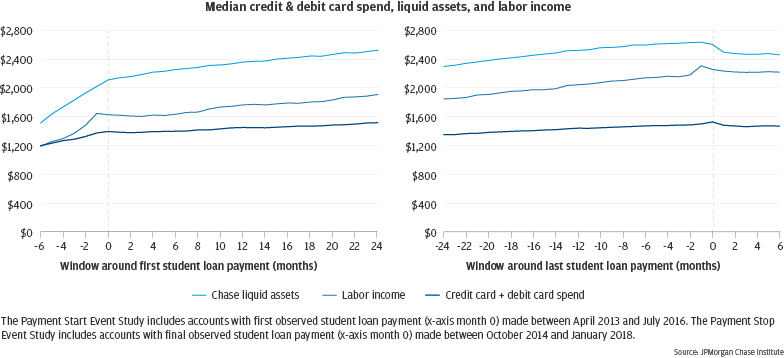
Income, liquid assets, and expenditures increase sharply prior to starting student loan payments and decrease after stopping student loan payments.
Source: JPMorgan Chase Institute
© 2019 JPMorgan Chase & Co.
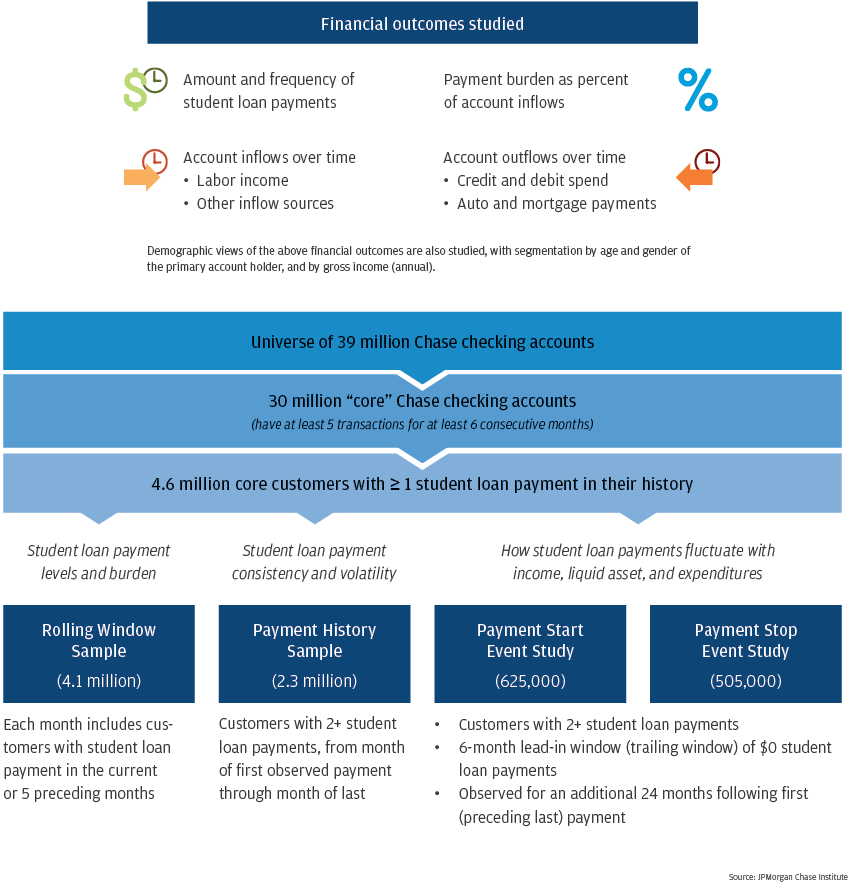
For this study, we assembled several distinct data assets from an overall sample of JPMorgan Chase families that made student loan payments from their Chase checking accounts.
We began with a universe of 39 million families with Chase checking accounts between October 2012 and July 2018. From this universe, we constructed a subset of 30 million “core” accounts for which we observe sufficient activity to consider the account a primary financial vehicle for the family. From these core accounts, we identified 4.6 million families who have made at least one student loan payment out of their Chase checking account.
The data assets used for analysis were created from this base of 4.6 million families. Each sample uses different inclusion criteria and serves a different analytical purpose, described in the below graphic. For additional details, see the Data Asset and Methodology section.
Source: JPMorgan Chase Institute
© 2019 JPMorgan Chase & Co.
Taken together, our insights from this new, high-frequency lens into student loan repayment behavior have important implications for policymakers, financial institutions, higher education institutions, and employers. There are important segments of the population who are still significantly burdened by student loan payments, especially younger and lower-income account-holders, despite the availability of income-driven repayment programs. In particular, student loan payments are sensitive to large income changes, and may lack sufficient mechanisms to adjust payments to accommodate income fluctuations. Insofar as student loan payments are less consistent and more volatile than auto loan and mortgage payments, families may be benefiting from the greater leniency that exists with student loan repayment compared to other loan types. Still, it remains to be seen whether the negative consequences of this lower consistency will outweigh the benefits of greater leniency. Overall, there may be better ways to structure or implement student loan repayment plans that would ensure that families are not over-burdened and are able to make consistent payments. Revisiting underwriting and federal student aid criteria and considerations might help address the root of the student loan repayment problem. More broadly, colleges and universities, employers, and financial institutions have a role to play in helping borrowers manage their student loan debt.
Authors

Diana Farrell
Founding and Former President & CEO

Erica Deadman
Consumer Research Lead, JPMorganChase Institute

Fiona Greig
Former Co-President