Research

Tax Time

How Families Manage Tax Refunds and Payments

March 1, 2019

Findings

Executive Summary

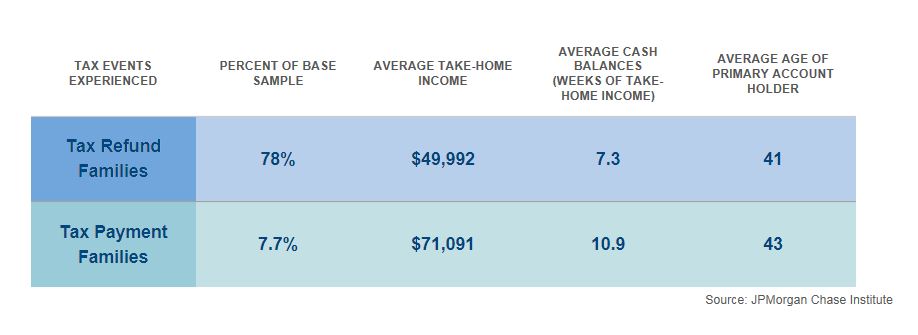
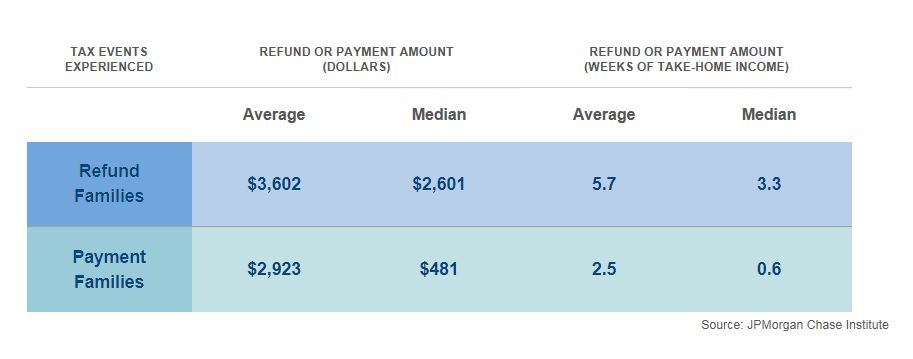
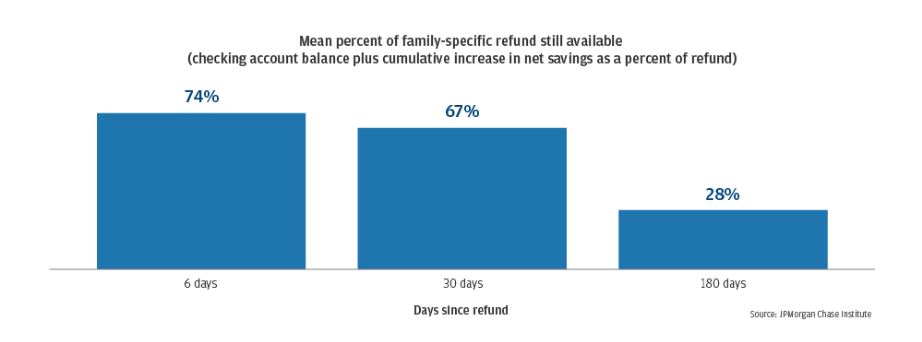
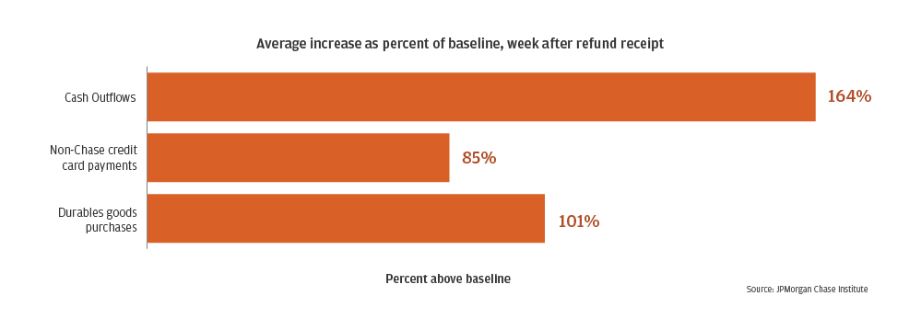
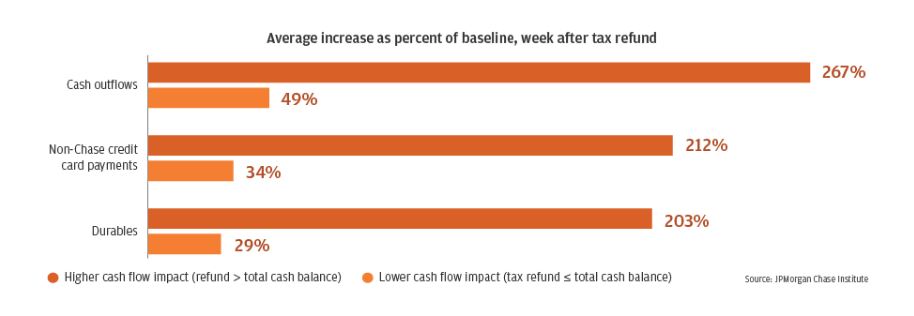
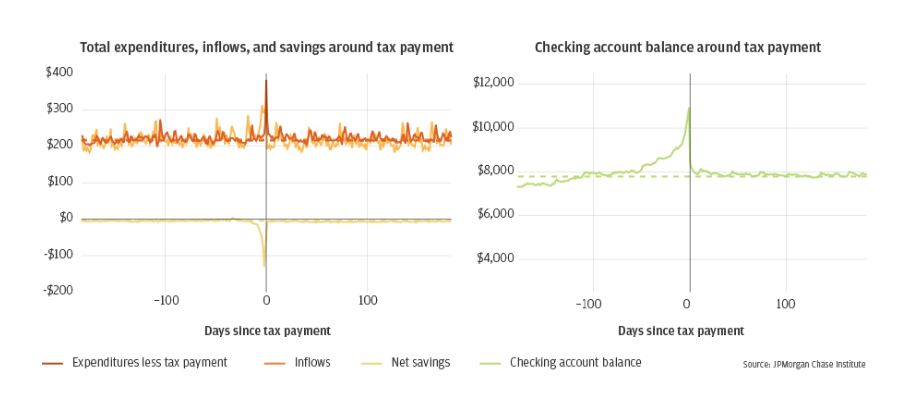
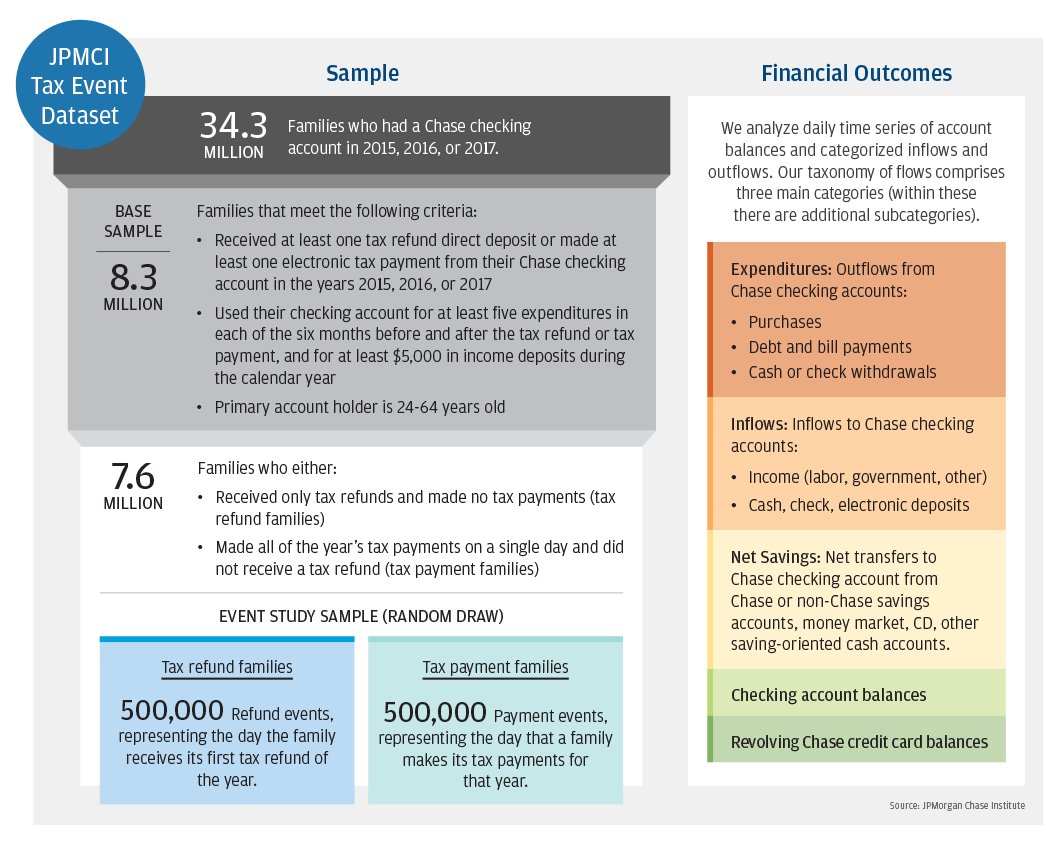
Every spring more than a half trillion dollars flow into and out of the financial accounts of American families as they reconcile taxes paid against taxes owed for the prior year. Most of these flows–representing 2.5 percent of the year’s total GDP–hit families’ financial accounts during the dozen weeks of the traditional tax season from mid-February to mid-May. In previous JPMorgan Chase Institute research, we reported that out-of-pocket spending on healthcare services jumps by 60 percent in the week a tax refund is received and remains elevated for 75 days. This report builds on that research, investigating more comprehensively how families manage the positive cash flow from tax refunds and negative cash flow from tax payments. We analyze daily financial flows and balances for one million families who receive tax refunds or make tax payments, and find that tax reconciliation has a significant and long-lasting impact on spending and saving patterns of some, but not all of them.

Our findings underscore that fact that, whether by design or not, the tax system is a primary tool by which many families generate lump sums of cash. They raise questions about roles that families, financial service providers, and policy makers might play in creating cheaper and more flexible tools for this purpose.

01

Four-fifths of our sample received one or more refunds and made no payments. Refund recipients tend to have lower average incomes and smaller cash buffers than those making tax payments.

Inforgraphic describes about percentage of base sample between tax refund families & tax payment families
Tax events experienced Percent of base sample Average take-home income Average cash balances
(weeks of take-home income)
Average age of primary account holder
Tax Refund Families 78% $49,992 7.3 41
Tax Payment Families 7.7% $71,091 10.9 43

The vast majority of families in our base sample are "tax refund" families; they received one or more tax refunds and made no tax payments in a year. "Tax payment families" represent a small minority. In this study we focus on a subset of families making payments—those who make all of their payments in a single day. Tax payment families had higher take-home incomes and larger cash buffers than tax refund families.

01

Tax refunds amount to almost six weeks’ take-home income for the average family receiving them. For families making a tax payment, the average payment is equivalent to 2.5 weeks’ income.

Inforgraphic describes about tax refund families receive an average of 5.7 weeks' income in their tax refund, whereas tax payment families pay out an average of 2.5 weeks income.
tax events experienced refund or payment amount
(dollars)
refund or payment amount
(weeks of take-home income)
  Average Median Average Median
Refund Families $3,602 $2,601 5.7 3.3
Payment Families $2,923 $481 2.5 0.6


Tax Events Experienced Refund or payment amount
(dollars)
Refund or payment amount
(weeks of take-home income)
Refund Families Average: $3,602 Median: $2,601 Average: 5.7 Median: 3.3
Payment Families Average: $2,923 Median: $481 Average: 2.5 Median: 0.6

Tax refund families receive an average of 5.7 weeks' income in their tax refund, whereas tax payment families pay out an average of 2.5 weeks' income. This is not only because the magnitude of the average tax refund is larger than the magnitude of the average tax payment, but also because families who make a tax payment tend to have higher take-home incomes. Within each group, a majority of families experience much smaller than average impacts.

01

Among tax refund recipients, average expenditures increase sharply as soon as the refund is received. Six months after the refund, families still have an average of 28 percent of their tax refund remaining.

Bar garph describes about Mean percent of family-specific refund still available (checking account balance plus cumulative increase in net savings as a percent of refund)

Finding Three

Among tax refund recipients, average expenditures increase sharply as soon as the refund is received. Six months after the refund, families still have an average of 28 percent of their tax refund remaining.

Days since refund Mean percent of family-specific refund still available
6 days 74%
30 days 67%
180 days 28%

© 2018 JPMorgan Chase & Co.

One week after receiving their first tax refund of the year, families on average have about 74 percent remaining either in their checking account or transferred to saving accounts. Six months later, they still have 28 percent of their tax refund remaining.

01

Expenditures on durable goods, credit card payments, and cash withdrawals increase most sharply upon receipt of a tax refund.

Bar garph describes about Average increase as percent of baseline, week after refund receipt

Finding Four

Expenditures on durable goods, credit card payments, and cash withdrawals increase most sharply upon receipt of a tax refund.

Expenditures Average increase as percent of baseline, week after refund receipt
Cash Outflows 16%
Non-Chase credit card payment 85%
Durable goods purchases 101%

© 2019 JPMorgan Chase & Co.

Average payments on non-Chase credit cards in the week after the refund is received are 86 percent higher than the average during a typical week prior to the refund. Average expenditures on durable goods double in the week after refund receipt, to $50 compared to $25 during a typical week. Families also use their tax refunds to deleverage; average revolving credit card balances are almost 8 percent lower in the month after the tax refund relative to the month before.

01

Families for whom the refund has a larger cash flow impact increase their spending and saving most sharply when it arrives.

Bar garph describes about Average increase as percent of baseline, week after tax refund

Finding Five

Families for whom the refund has a larger cash flow impact increase their spending and saving most sharply when it arrives.

Expenditures Average increase as percent of baseline, week after tax refund
(Higher cash flow impact)
Average increase as percent of baseline, week after tax refund
(Lower cash flow impact)
Cash Outflows 267% 49%
Non-Chase credit card payment 212% 34%
Durable goods purchases 203% 29%

© 2019 JPMorgan Chase & Co.

For almost half of families receiving tax refunds, the refund exceeds the sum of pre-refund balances in all of their cash accounts. Among these families, cash withdrawals, non-Chase credit card bill payments, and durable goods purchases more than triple in the week after the first tax refund is received. Among the rest of families, these flows increase more modestly—by less than 50 percent. We also find that those who file earliest in the season increase their spending and saving most sharply when the refund arrives.

01

On average, families who make a tax payment cover that payment with cash already available when it is due. Once the payment is made, spending and saving patterns quickly return to their previous steady state.

Line garph1 describes about Total expenditures, inflows, and saving around tax payment and Line garph2 describes about Checking account balance around tax payment

Finding 6

On average, families who make a tax payment cover that payment with cash already available when it is due. Once the payment is made, spending and saving patterns quickly return to their previous steady state.

Line graphs showing the expenditures, inflows, net savings, and checking account balances 182 days before and 182 days after the tax payment is made. Families do not cut their expenditures or increase their labor to cover the tax payment, rather they transfer cash already available in their checking accounts three weeks before the payment is due. Once the payment is made, spending and saving patterns return to their steady-state level.

© 2019 JPMorgan Chase & Co.

Payment families in our sample do not cut expenditures or increase their labor income to cover the payment. Instead, they transfer cash into their checking accounts during the three weeks leading up to the payment. Unlike with refund families, payment families' expenditures and account balances settle quickly back to the original steady-state after the payment is made. 

Data

Infographic describes about JPMCI Tax Event Dataset

Source: JPMorgan Chase Institute

© 2019 JPMorgan Chase & Co.

JPMCI Tax Event Dataset

The JPMorgan Chase Institute Online Platform Economy dataset

Sample

34.3 Million-Families who had a Chase checking account in 2015, 2016, or 2017.

8.3 Million-Base sample of families that meet the following criteria:

  • Received at least one tax refund direct deposit or made at least one electronic tax payment from their Chase checking account in the years 2015, 2016, or 2017
  • Used their checking account for at least five expenditures in each of the six months before and after the tax refund or tax payment, and for at least $5,000 in income deposits during the calendar year
  • Primary account holder is 24-64 years old

7.6 Million-Families who either:

  • Received only tax refunds and made no tax payments (tax refund families)
  • Made all of the year’s tax payments on a single day and did not receive a tax refund (tax payment families

EVENT STUDY SAMPLE (random draw)

  • Tax refund families: 500,000 Refund events, representing the day the family receives its first tax refund of the year.
  • Tax payment families: 500,000 Payment events, representing the day that a family makes its tax payments for that year.

Financial Outcomes

We analyze daily time series of account balances and categorized inflows and outflows. Our taxonomy of flows comprises three main categories (within these there are additional subcategories).

Expenditures: Outflows from Chase checking accounts:

  • Purchases
  • Debt and bill payments
  • Cash or check withdrawals

Inflows: Inflows to Chase checking accounts:

  • Income (labor, government, other)
  • Cash, check, electronic deposits

    Net Savings: Net transfers to Chase checking account from Chase or non-Chase savings accounts, money market, CD, other saving-oriented cash accounts.

    Checking account balances

    Revolving Chase credit card balances


Every spring, more than half a trillion dollars flow into and out families’ financial accounts as they reconcile taxes paid against taxes owed for the prior year. In this report, we analyze daily financial flows and balances for one million families who receive tax refunds or make tax payments, and find that these flows have a significant impact on the financial lives of some but not all of them. 

Authors

Diana Farrell

Diana Farrell

Founding and Former President & CEO

Fiona Greig

Fiona Greig

Former Co-President

Amar Hamoudi

Amar Hamoudi

JPMC Institute