Research

Weathering Volatility

Big Data on the Financial Ups and Downs of U.S. Individuals


May 2015

Findings

In this inaugural report, researchers from the JPMorgan Chase Institute analyzed proprietary data from JPMorgan Chase & Co. to determine how income and consumption fluctuate on a monthly and a yearly basis.

Infographic: 27M Chase accounts from which a sample of 2.5M is taken

The JPMorgan Chase Institute Data Asset Sample

27M Chase accounts from which a sample of 2.5M is taken.

100,000 people out of the 2.5 million sample were randomly selected and the following four types of information were analyzed:

  • Monthly Balances

    For 27 months on all Chase consumer products: checking account, savings account, credit card, mortgage and home equity loans and auto loans
  • 135M Transactions

    Information on amount, day and time, zip code, merchant and channel
  • Credit Bureau Data

    Estimate of monthly payments as well as current outstanding balances and delinquency statistics for credit cards, mortgages and other lines of credit
  • Individual Characteristics

    On an entirely de-personalized sample: gender, age and zip code

Criteria used to select the 2.5 million accounts include:

  • Checking account in October 2012 to December 2014
  • At least $500 of deposits every month
  • At least five outflow transactions every month
  • Chase credit card in October 2012 to December 2014

© 2018 JPMorgan Chase & Co.

To draw conclusions about fluctuations in earning and spending amongst U.S. individuals, our findings are summarized into three key points…

01

Individuals experienced high levels of income volatility and higher levels of consumption volatility across the income spectrum.

Volatility was even greater on a month-to-month basis than on a year-to-year basis. The highest income earners experienced as much volatility in both income and consumption as the lowest income earners. Some of the drivers of monthly volatility included months with five Fridays, when employees may be paid three times instead of two, tax bills and refunds, and the year-end shopping season.

Infographic: Year-to-Year Versus Month-to-Month Volatility in Income and Consumption

Year-to-Year Versus Month-to-Month Volatility in Income and Consumption

Percent of individuals

  Year-To-Year Month-To-Month
  Income Consumption Income Consumption
Greater Than 5% Change 70% 89% 84% 100%


Month-to-Month Income and Consumption Volatility by Income Quintile

Half of our sample experienced monthly volatility in income and consumption within the ranges below in any given month.

  75th Percentile 25th Percentile
  Income Consumption Income Consumption
Quintile One +11% +26% -9% -25%
Quintile Two +14% +27% -11% -25%
Quintile Three +15% +27% -12% -25%
Quintile Four +15% +27% -14% -25%
Quintile Five +16% +29% -15% -27%
01

Income and consumption changes did not move in tandem; there was only a slightly positive correlation between changes in income and changes in consumption between 2013 and 2014. Three behavioral groupings describe the link between income and consumption changes.

Infographic: Behavioral groupings of individual income and consumption changes.

Source: JPMorgan Chase Institute

Scatter plot representing behavioral groupings of individual income and consumption changes.

Infographic shows that 28 percent of people are responders

Source: JPMorgan Chase Institute

28 percent of people are Responders. As income increases, consumption also increases.

Infographic shows that about 33 percent of people are Sticky Optimists.

Source: JPMorgan Chase Institute

33 percent of people are Sticky Optimists. As income decreases, consumption increases.

Infographic shows that about 39 percent of people are Sticky Pessimists.

Source: JPMorgan Chase Institute

33 percent of people are Sticky Pessimists. As income increases, consumption decreases.

01

The typical individual did not have a sufficient financial buffer to weather the degree of income and consumption volatility that we observed in our data.

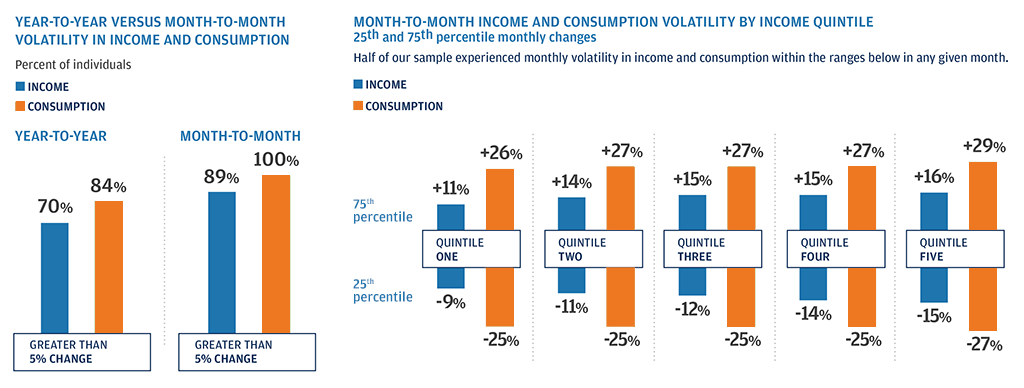
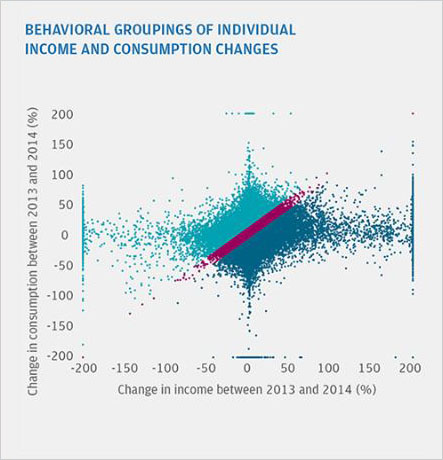
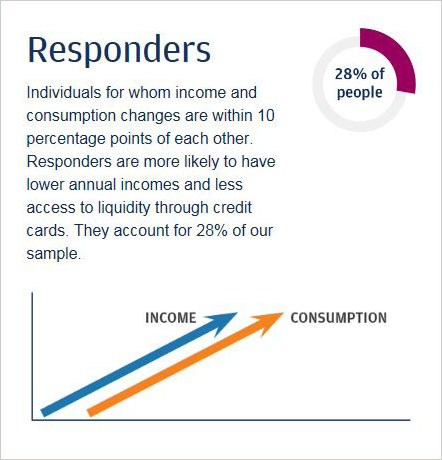
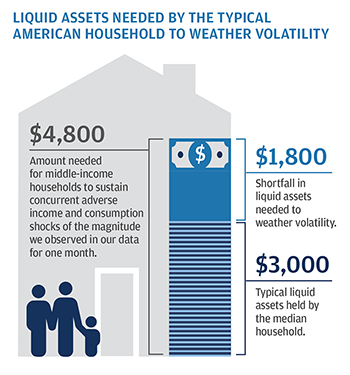
The typical household did not maintain enough liquid savings that could be accessed immediately in the event of a large, unexpected expense sustained at the same time as a loss in income. While many in the field of consumer finance have long advised that consumers maintain an emergency fund, our research into income and consumption volatility shows that a financial buffer is a more important consideration for individuals across the entire income spectrum than is generally understood. We find that not only was volatility high for income and consumption, but also changes in income and consumption did not move in tandem. This creates the risk that people might experience a negative swing in income at the same time that they incur a large, potentially unexpected, expense. Based on our findings, we estimate that a typical middle–income household needed approximately $4,800 in liquid assets—roughly 14% of annual income after taxes—to have sustained the observed monthly fluctuations in income and spending but they had only $3,000. Required levels of liquid assets, however, were largely unavailable to most individuals across quintiles, except top earners.

Infographic: Liquid assets are needed by the typical American household to weather volatility.

Liquid Assets Needed by the Typical American Household to Weather Volatility

  • $4,800

    Amount needed for middle-income households to sustain concurrent adverse income and consumption shocks of the magnitude we observed in our data for one month
  • $1,800

    Shortfall in liquid assets needed to weather volatility
  • $3,000

    Typical liquid assets held by the median household

© 2018 JPMorgan Chase & Co.

Conclusion

We conclude from these early findings that, given how noisy and unpredictable financial lives are, most individuals would benefit from innovative tools to better understand and manage their bottom line. These tools could include analytical platforms that help people track their earning and spending patterns as well as the sources, magnitude, and timing of fluctuations in income and consumption. In addition, financial service providers, employers and policy makers can help individuals reduce and manage volatility, better match income and consumption changes, or put these fluctuations to good use to help them save money. Potential solutions include new insurance and credit products to help smooth income and spending; technical solutions, such as making deposited funds more immediately available to banking customers; and products or automated transfers that allow people to save during naturally occurring upswings in income, such as on five-Friday months and tax refund season.

Authors


Diana Farrell

Diana Farrell

Founding and Former President & CEO

Fiona Greig

Fiona Greig

Former Co-President