Findings

The financial consequences of a family experiencing job loss for can vary widely. This report examines factors that drive the spending response during unemployment across households of different characteristics and over time. We leverage an expanded dataset that dates back to 2007, covering over 2 million job loss events and allowing a perspective that spans the Great Recession, the expansion period, and the COVID-19 recession.

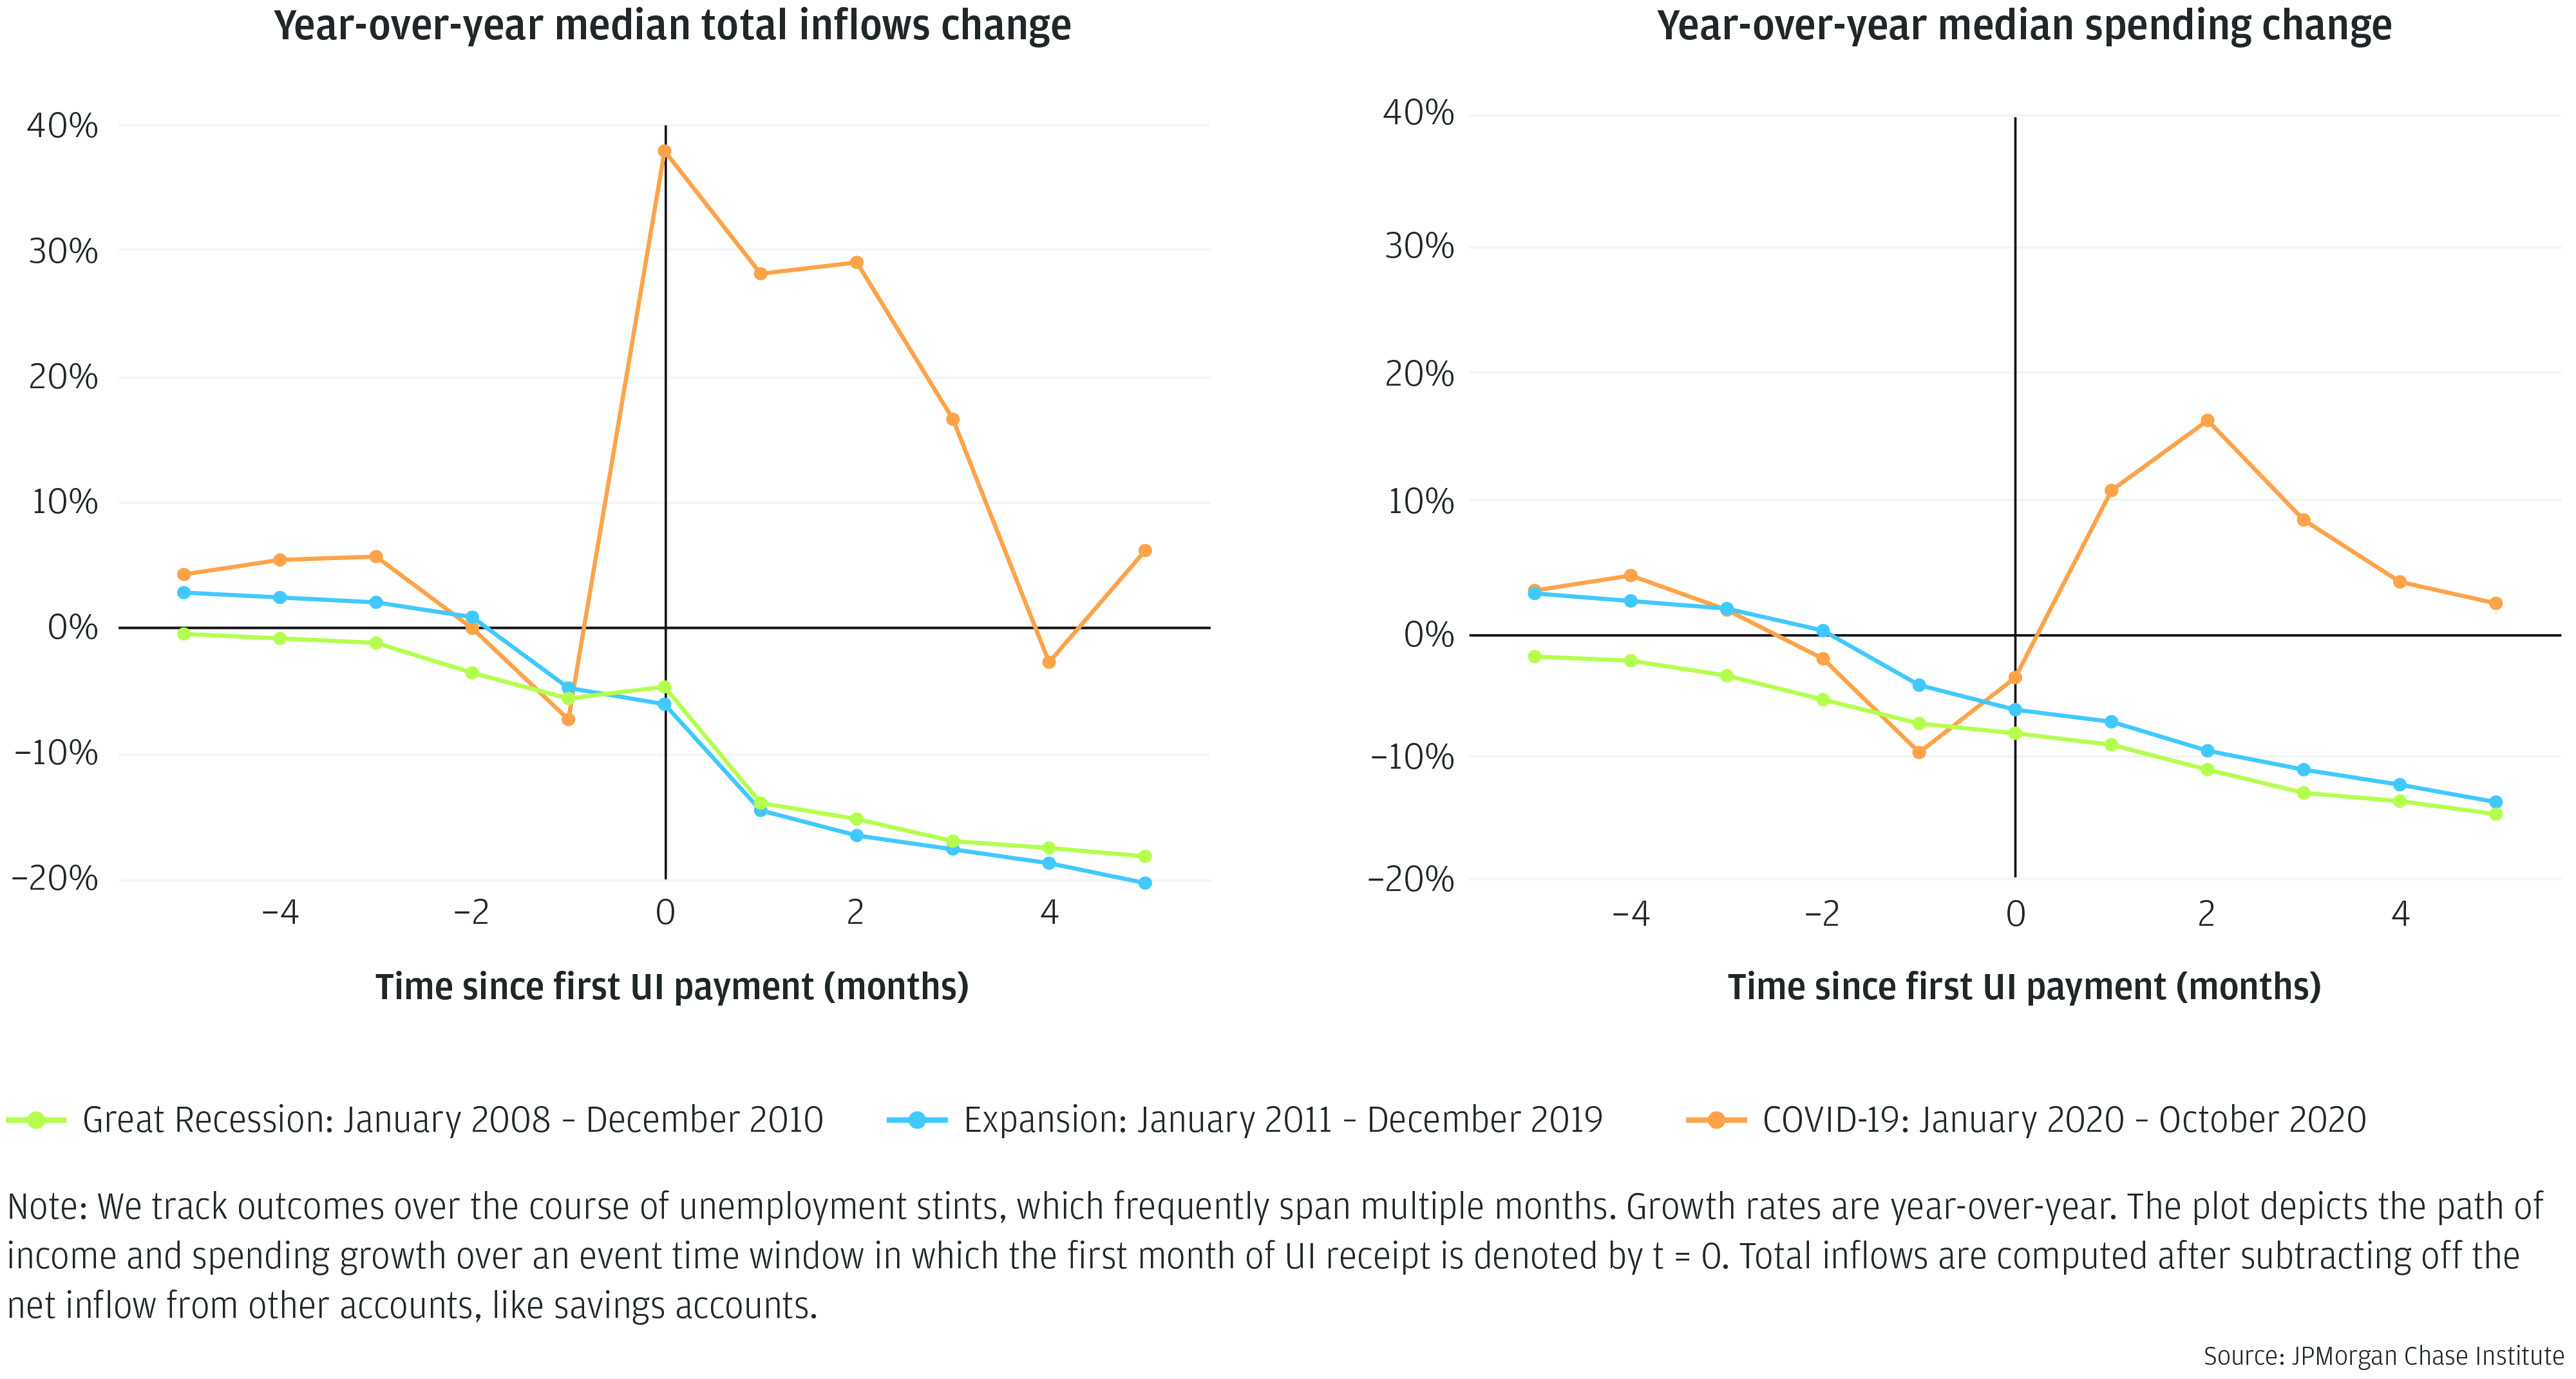
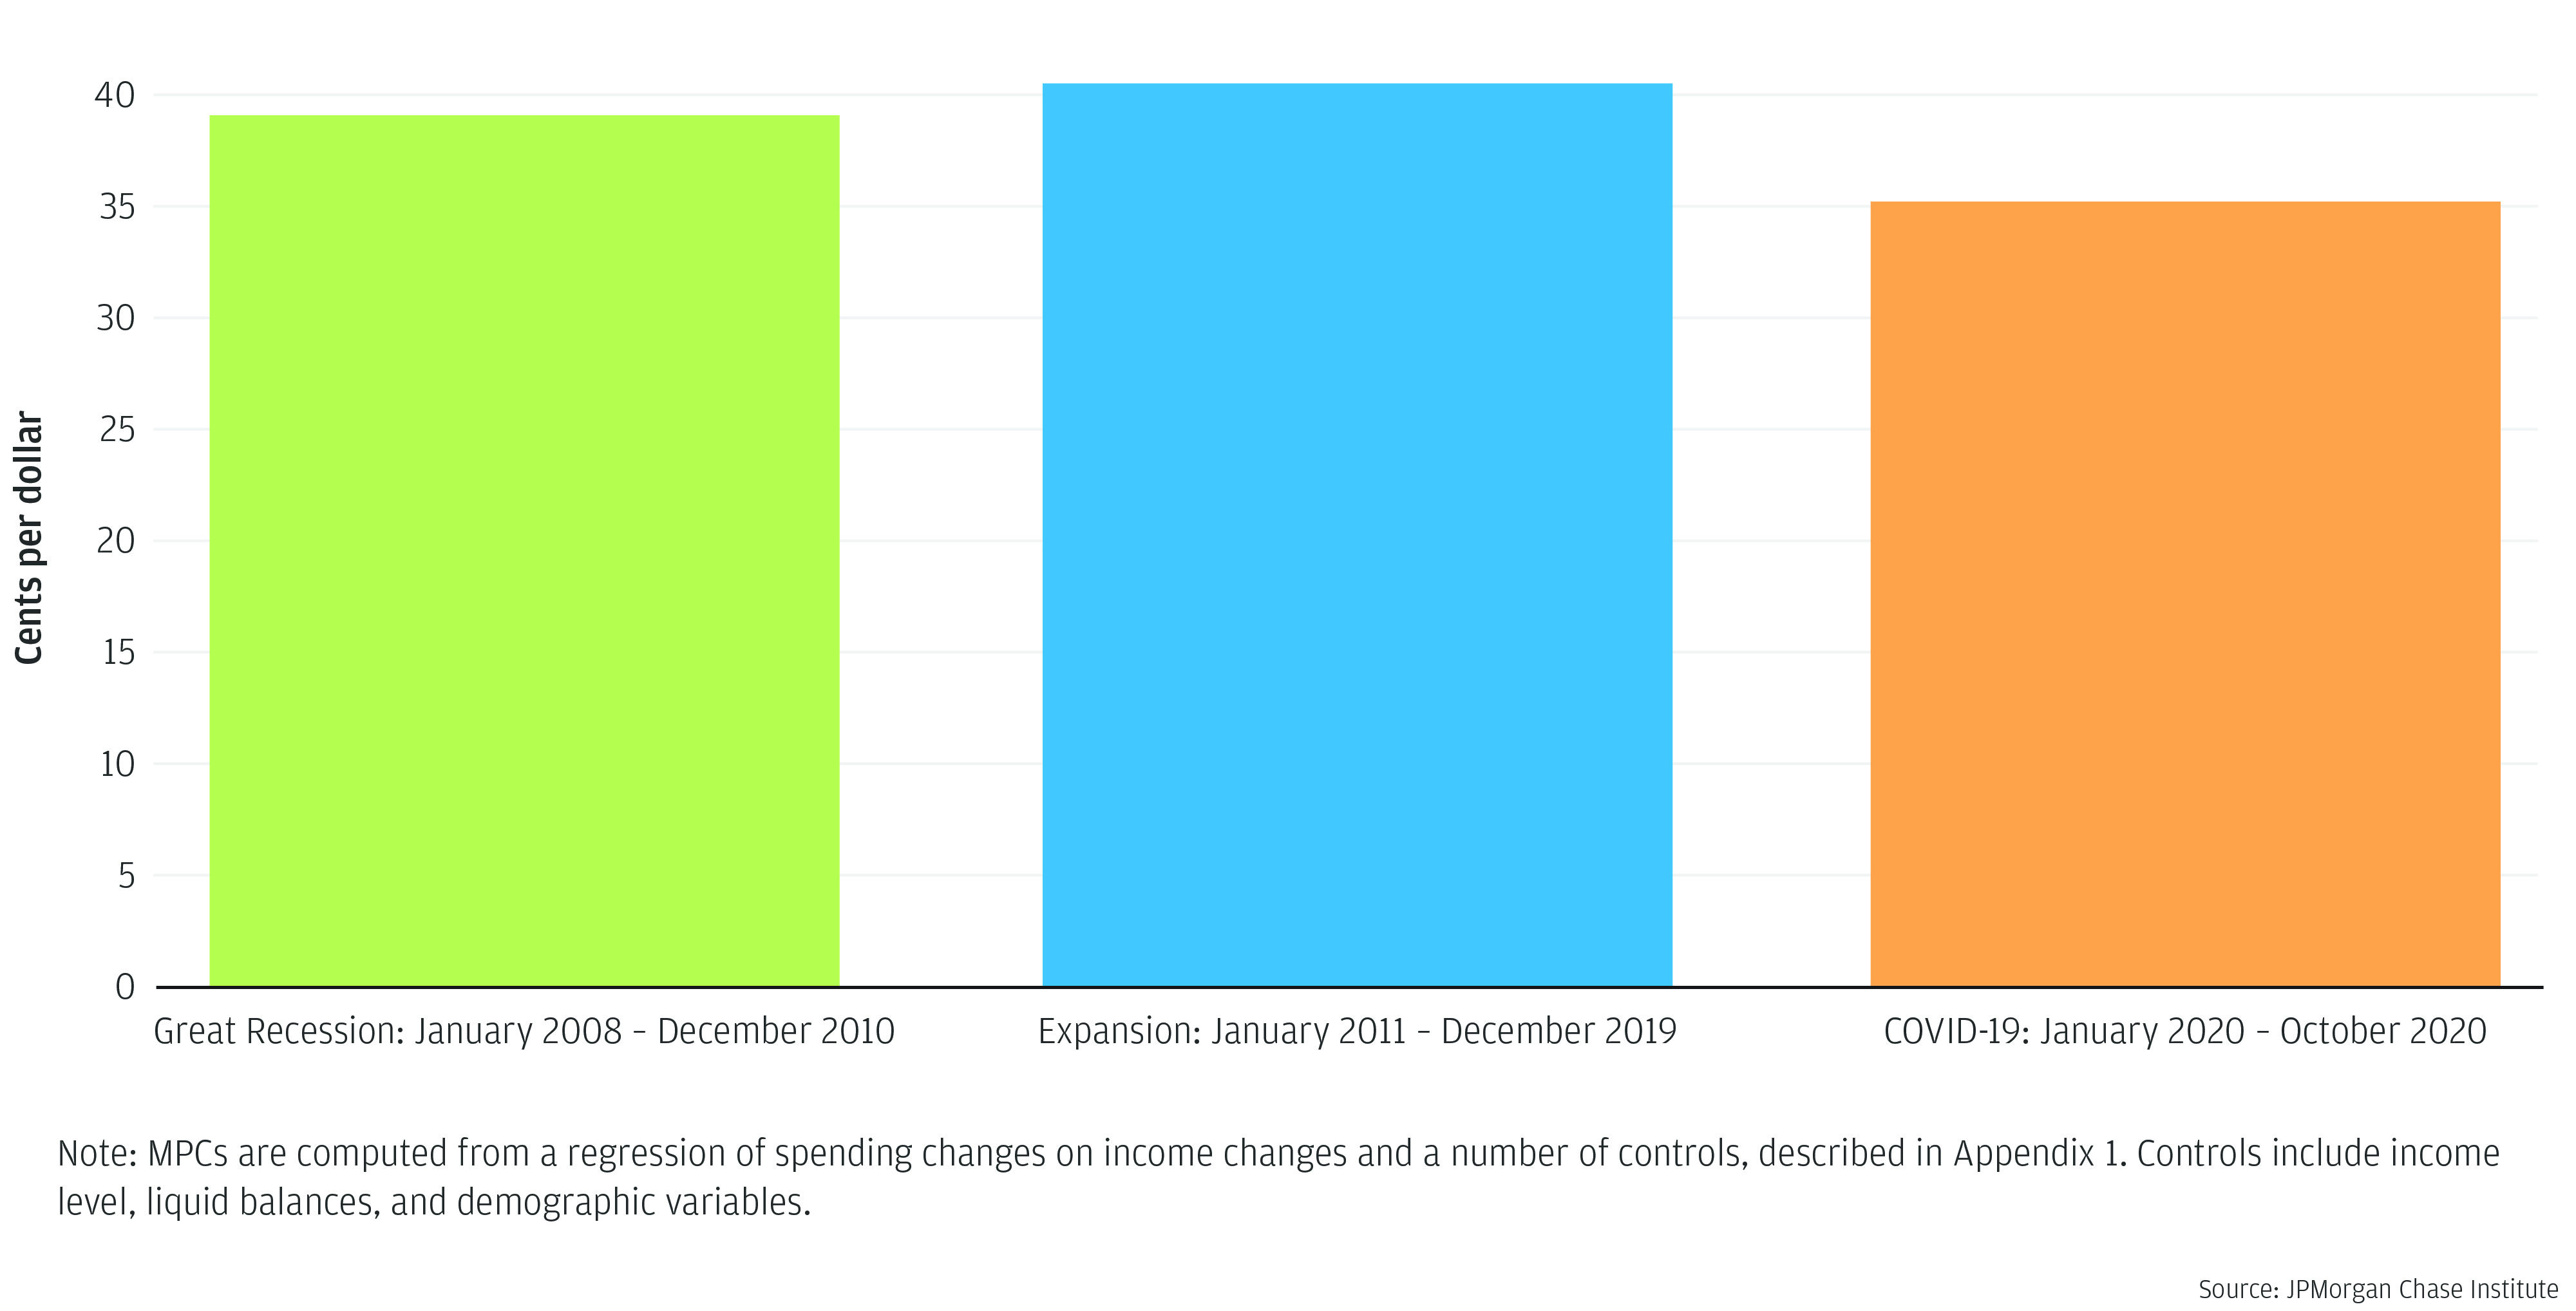
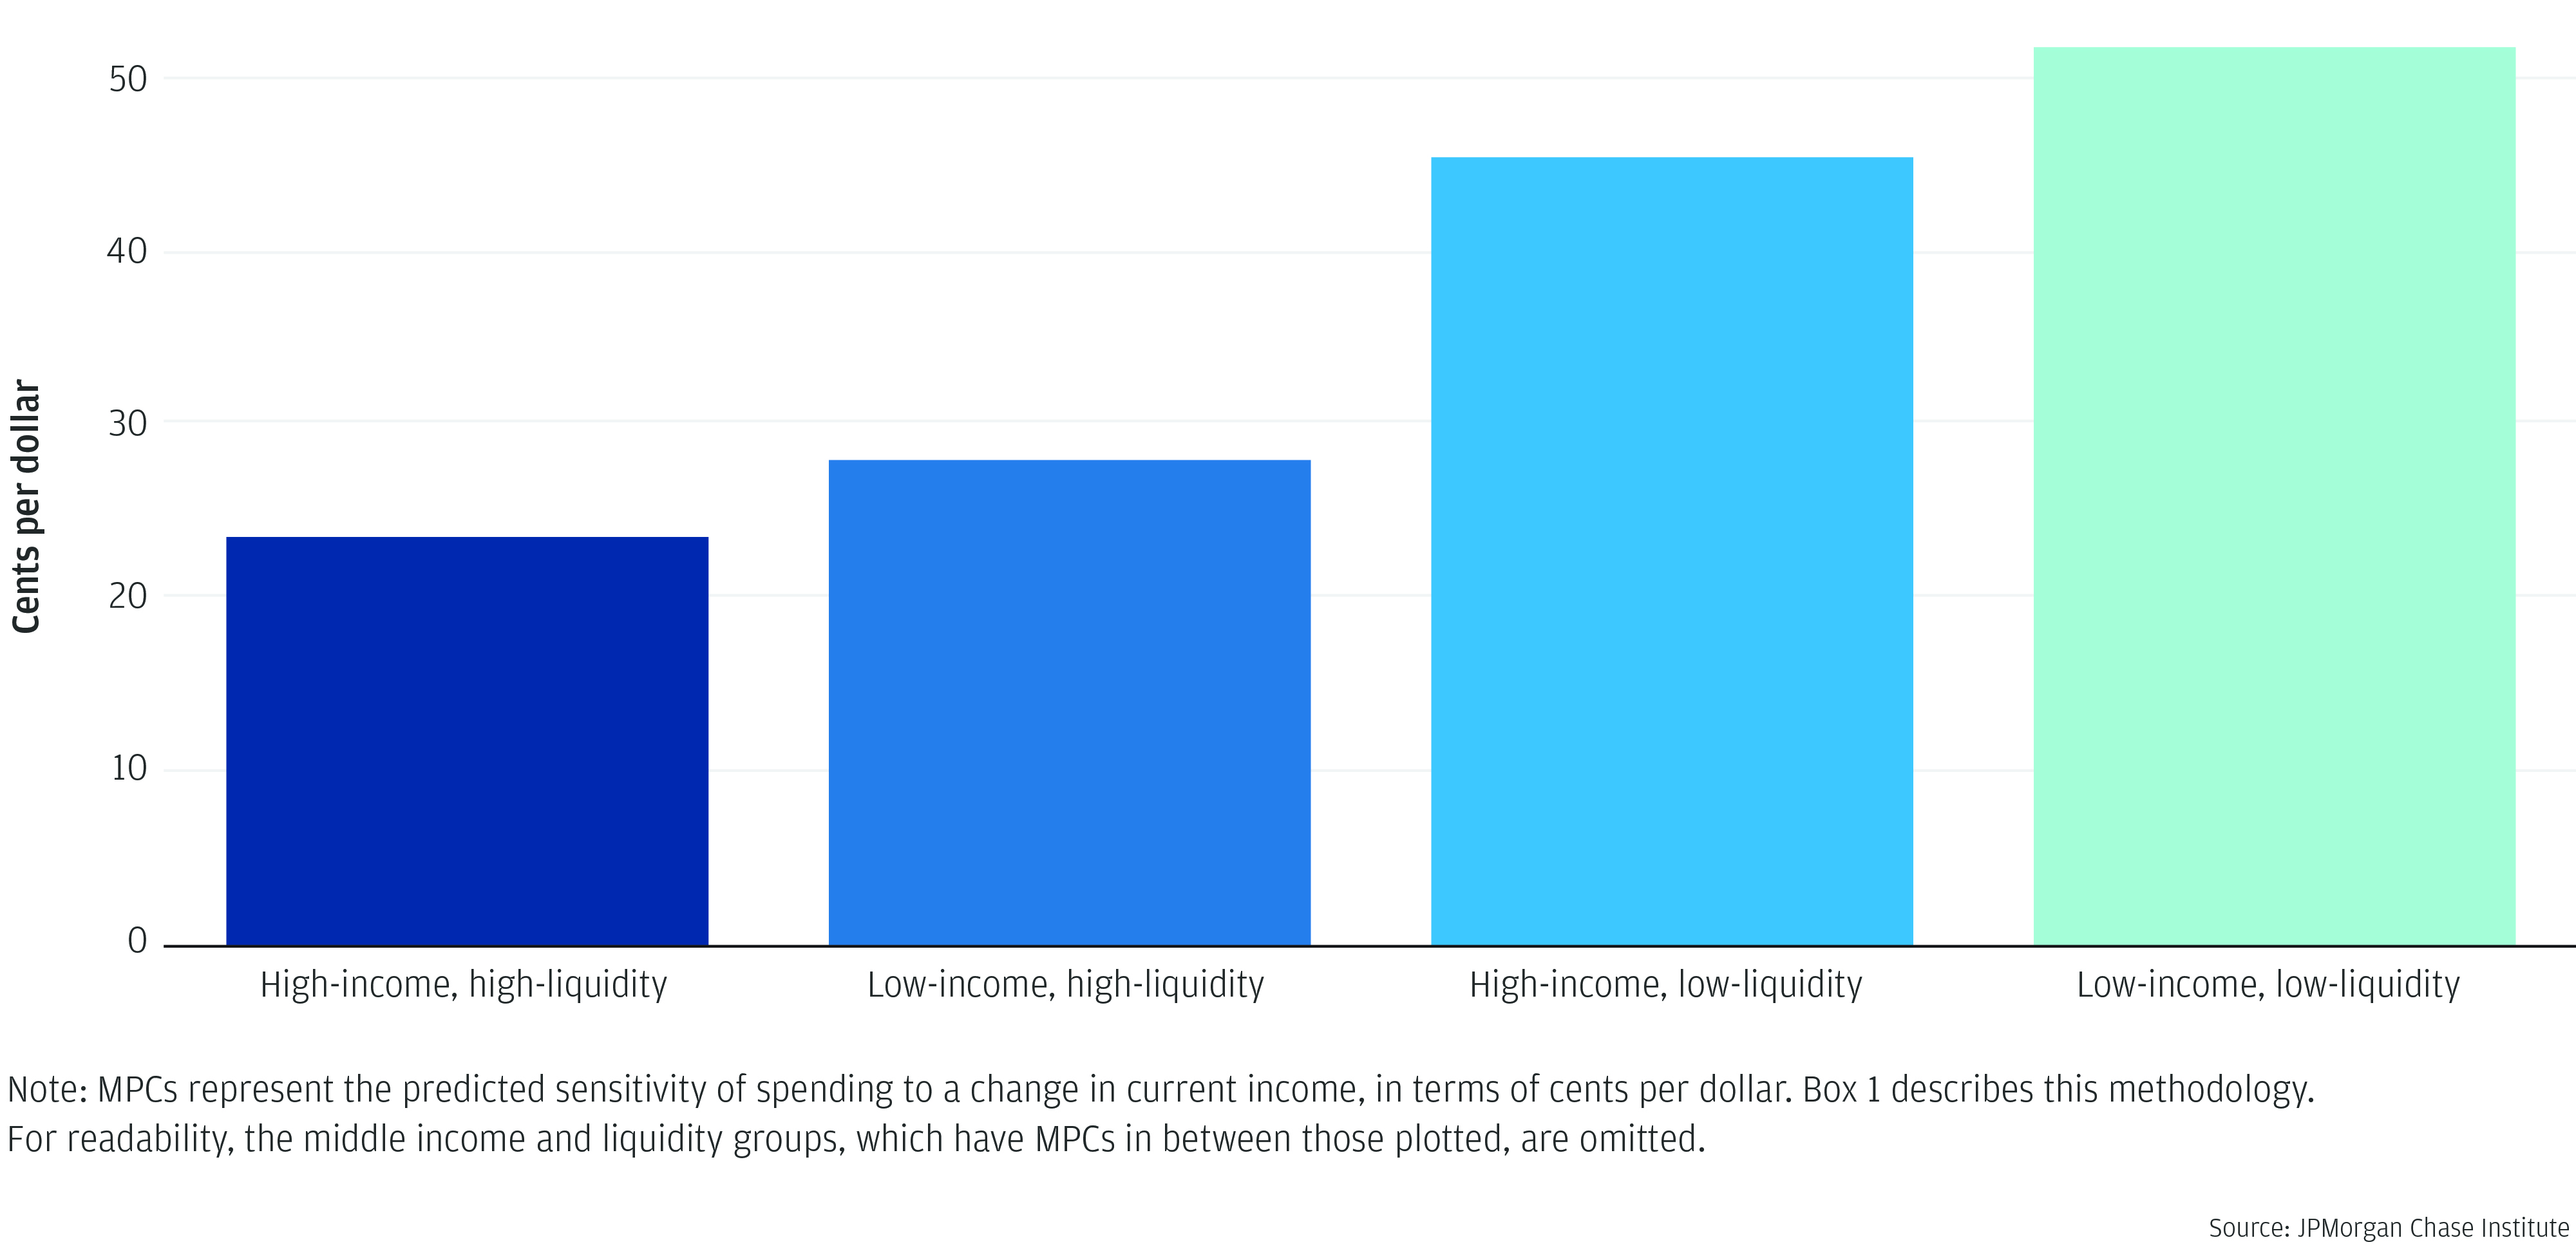
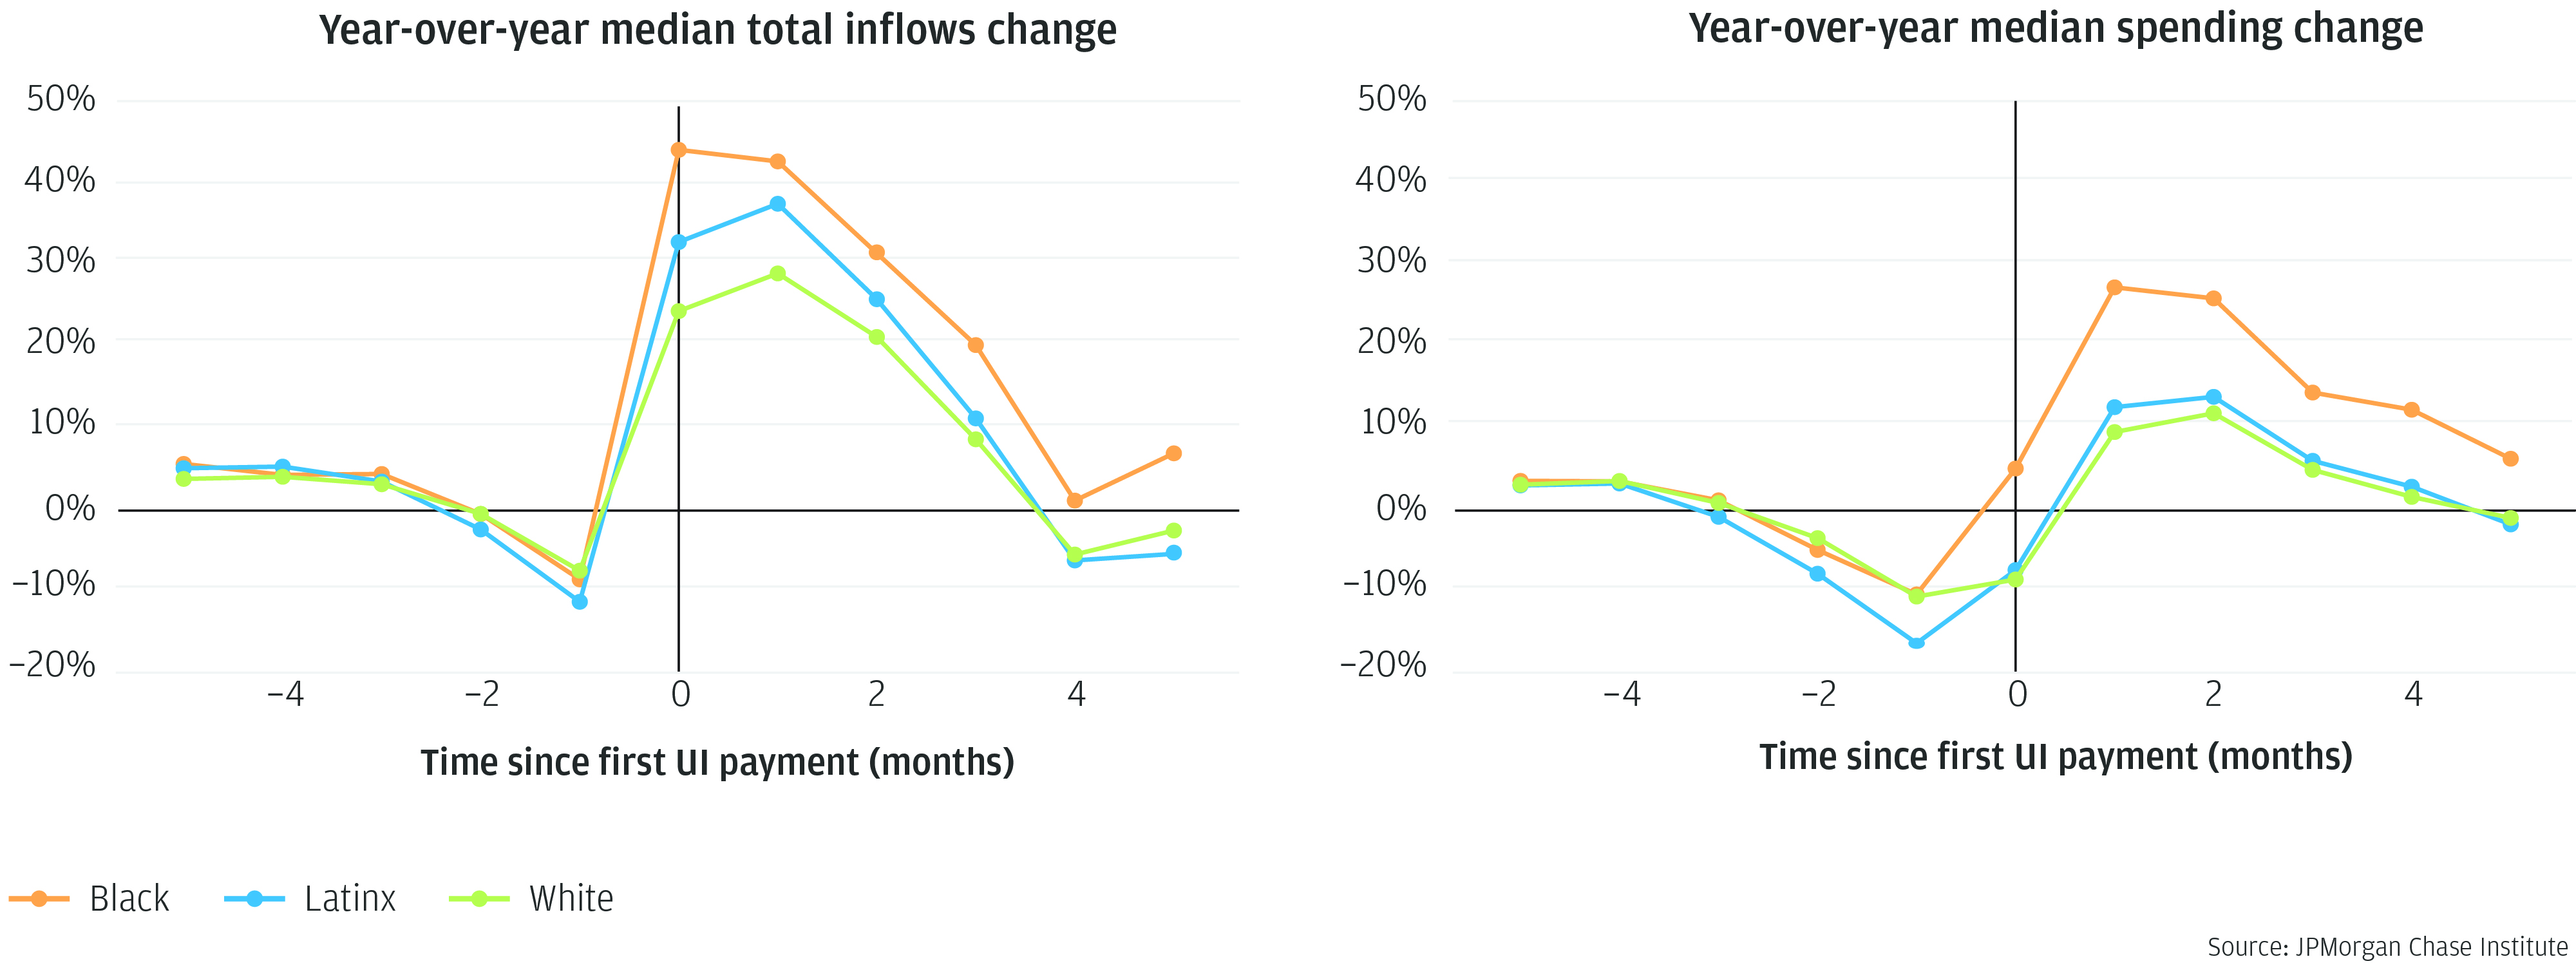
Our data show that household characteristics, such as liquidity and race, play a much larger role in explaining the consumption response to job loss than business cycle or local labor market conditions. Low-liquidity households are most prone to sharp spending declines after income drops, suggesting that targeting can be a useful way to support current consumption levels for financially vulnerable households. We also find that the tendency to spend out of unemployment insurance (UI) payments is fairly stable over disparate economic conditions. This implies that countercyclical payment levels could enhance the role of UI in supporting aggregate demand during recessions, because it channels government stimulus to the people most likely to spend.

The report is organized around four Findings, which are summarized below.

01

UI supplements implemented during COVID-19 prevented spending declines for the majority of people who lost their job, providing valuable support to the economy as overall demand was contracting sharply. This pattern contrasts with the sizable spending cuts observed for households experiencing unemployment in the Great Recession and subsequent expansion.

UI supplements implemented during COVID-19

Line graph of event studies around job loss at t = 0, spanning from 5 months before job loss to 5 months after job loss. The lines show year-over-year median total inflows change and year-over-year median spend change, split into three time period-based sub groups: the Great Recession, the expansion, and the COVID-19 pandemic. The lines for the expansion and the Great Recession show inflow and spending decreases after job loss, while the line for COVID-19 shows inflow and spending increases due to different government policies including expanded unemployment insurance.

Source: JPMorgan Chase Institute

01

Estimates of the propensity to spend out of UI payments are relatively stable over different economic environments.

Estimated marginal propensity to consume out of $1 of UI payments

three marginal propensities to consume (MPCs) by time periods

Line graph of event studies around job loss at t = 0, spanning from 5 months before job loss to 5 months after job loss. The lines show year-over-year median total inflows change and year-over-year median spend change, split into three time period-based sub groups: the Great Recession, the expansion, and the COVID-19 pandemic. The lines for the expansion and the Great Recession show inflow and spending decreases after job loss, while the line for COVID-19 shows inflow and spending increases due to different government policies including expanded unemployment insurance.

Source: JPMorgan Chase Institute

01

By contrast, we find stark differences in the spending response to income changes across households with different liquidity buffers; households with lower cash balances are more likely to experience sharp spending drops after job loss.

find stark differences in the spending response to income changes

Bar plot showing four marginal propensities to consume (MPCs) by archetypes of consumers. The high income, high-liquidity households have an MPC of 23.7 cents per dollar; high income, low-liquidity households have an MPC of 28.2 cents per dollar; high income, low-liquidity households have an MPC of 45.8 cents per dollar; high income, low-liquidity households have an MPC of 52.1 cents per dollar.

Source: JPMorgan Chase Institute

01

Black and Latinx households cut their spending to a greater extent than White families when faced with job loss, partially explained by their lower cash buffers and indicators of wealth.

Expanded UI benefits during COVID supported income and spending increases for all households regardless of race, but the fixed dollar value of the supplement mattered more for Black and Latinx households, given their lower incomes (see figure below).

During the most volatile months of the COVID-19 pandemic

Line graph of event studies around job loss at t = 0, spanning from -5 months before job loss to +5 months after job loss from the period of January 2020 to October 2020. The lines show year-over-year median total inflows change and year-over-year median spend change, split into three race sub groups: White, Black, and Latinx. The lines show spending increases after job loss for all three groups, but overall Latinx and Black households had higher spending and income incomes then White households, showing the importance of unemployment insurance for Black and Latinx households.

Source: JPMorgan Chase Institute

Authors

Chris Wheat

President, JPMorganChase Institute

Fiona Greig

Former Co-President

George Eckerd

Financial Markets Research Lead

Melissa O’Brien

Data Science Lead

SONY DSC

Shantanu Banerjee

Financial Markets Research Associate