

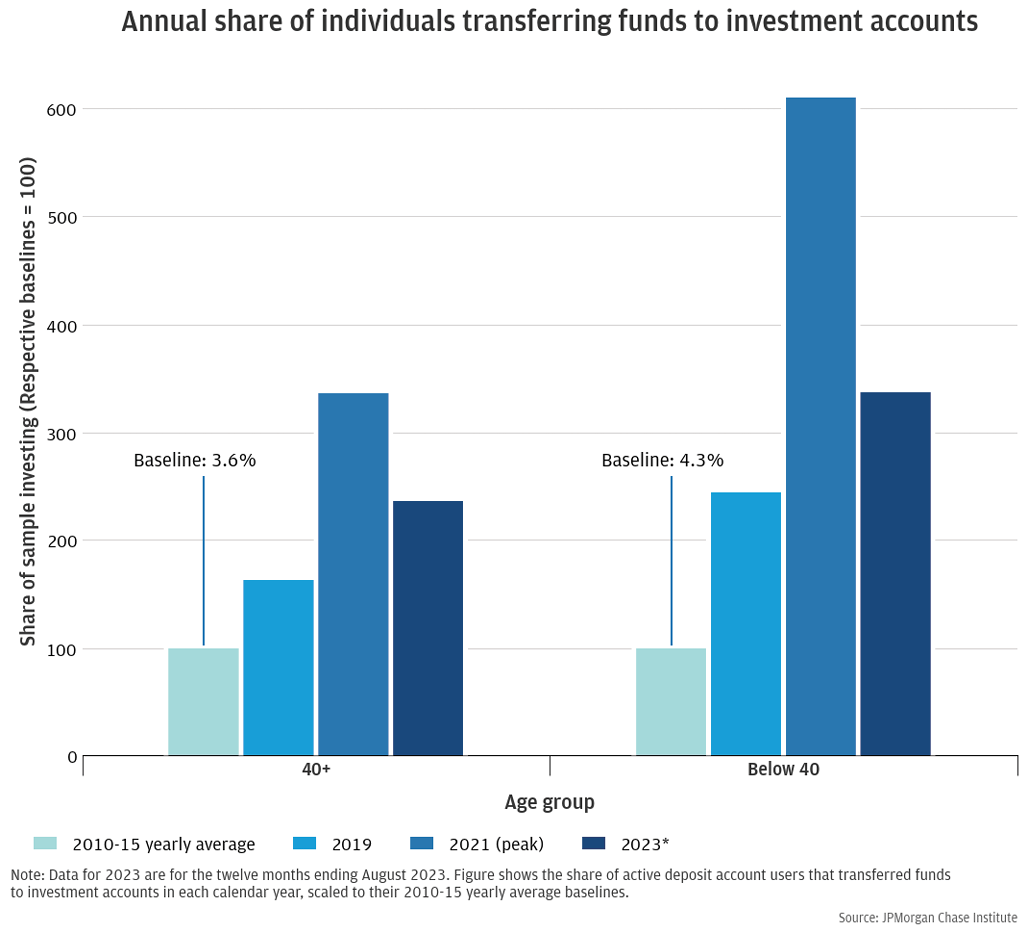
Figure 1: Growth in investment account use has been more pronounced for those under 40 years old.
Latest news

An Ohio-based company is protecting first responders around the world
With support from JPMorganChase, Fire-Dex is providing protective equipment to firefighters in 100 countries and all 50 states.
Learn moreLatest news

Veteran’s Unconventional Path to Landing her Dream Job in Tech
U.S. Army Veteran Ashley Wigfall transitioned to a civilian role and charted her path to technologist through mentorship and skills training at the JPMorgan Chase tech hub in Plano, Texas.
Learn more
Research
May 23, 2024
Access to financial markets can have a material impact on the financial health trajectory of families and individuals seeking to build wealth. In aggregate and over the long run, financial assets have offered solid returns in exchange for accepting market volatility. Alongside a decline in the cost of retail investing in recent years, financial market investment has broadened from an activity dominated by higher-income individuals to one with a much broader base.1 Market commentators and other researchers have cited increased access to information, reduction in trading commissions, and social media networks as contributing to the demographic trends.2
This report provides a more comprehensive view of the recent broadening of retail investing by characterizing activity by age, gender, and race. Demographic attributes may correlate income growth and liquidity—two features of financial flexibility that predict investing transactions.3 Each of the population subgroups we study increased their transfers to investment accounts out of their take-home income as of 2023 compared to pre-pandemic levels, and each group experienced a peak during the pandemic-era savings boom.
Higher frequency investing dynamics reveal sharp differences in behavior among certain groups during the pandemic. Transfers from checking accounts to investment accounts of younger individuals and men increased more aggressively around the historic March 2020 volatility in stocks and during a stimulus-driven investing fad in early 2021. In recent U.S. business cycles, men and younger individuals have been disproportionately exposed to economic risk through their labor earnings, according to academic research.4 The relative increase in exposure to financial market risk of the same groups may amplify negative outcomes in the case of prolonged downturns in markets and the economy. Future crises may feature analogous investing behavior, and a sharp rebound—as experienced in the wake of the pandemic—is not guaranteed.
We base our analysis on a sample of over 10 million active checking account users spanning 2008 to 2023. We use transfers from checking accounts to external investment accounts to identify investing transactions.5 Taking differences by age, gender, and race6 in turn, we find the following:
Finding 1. The monthly share of individuals below 40 years old transferring funds to investments has more than tripled over the past decade, outstripping increases for those 40 and over.
Finding 2. Peaks in market volatility in 2020 and a fiscal stimulus-fueled investing surge in early 2021 were associated with a temporary increase in the share of investment transfers for men.
Finding 3. The share of Black and Hispanic individuals transferring money to investment accounts increased relative to White individuals over the past decade and peaked around the timing of pandemic-era fiscal stimulus.
Decisions to participate in financial investments involve a range of factors that may correlate with the demographic groups considered. Having the financial flexibility to generate savings is essential, as indicated by the roles of income growth and liquidity highlighted in the prior Institute report.
Decision makers and industry practitioners can use this report’s findings to gauge the evolving population investing through brokerage accounts and consider the results in understanding the needs and recent behaviors of investors, particularly new entrants to the market.
Younger individuals have been increasingly engaged with investing in recent years, at least in terms of putting after-tax discretionary money to work in financial markets. Following the global financial crisis, the share of adults investing was about the same among working-age adults above and below 40 years old, respectively. By 2019, the younger age group’s annual investing share had more than tripled, compared to a 60 percent increase for 40 plus. And the spike in 2021 relative to 2019 was twice as large in percentage point terms for those under 40 years old compared with the 40 and over group. As of last year, the investing share for the below and above 40 groups settled at about 9 percent and 14 percent, respectively.
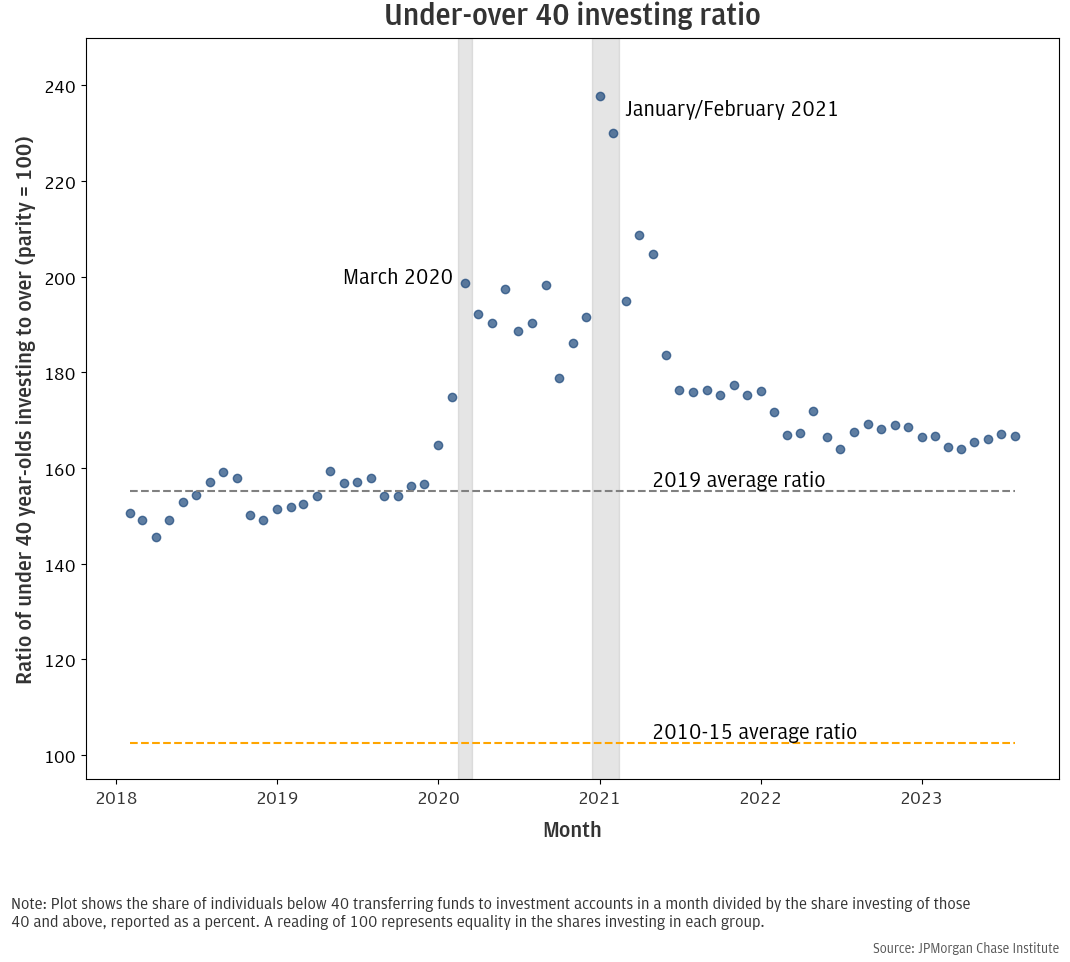
The rise of younger investors followed a nonlinear path during the pandemic. Figure 2 depicts a temporary surge in the share of younger individuals investing relative to those above forty years old. Starting in early 2020, the number of individuals under 40 years making investments rose sharply culminating in January and February 2021 peak. This timing coincided with widespread reports of social-media-driven retail investing fads that included concentrated positions in single stocks.
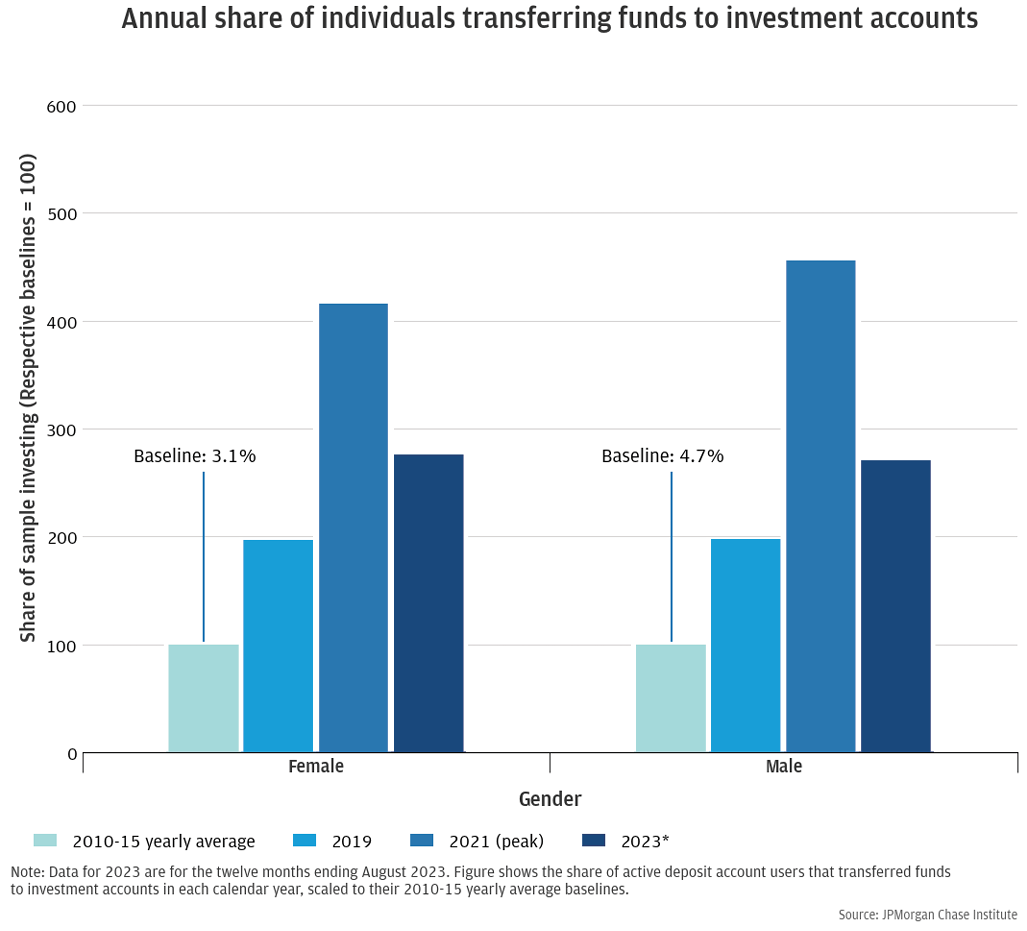
Building on prior research that found that men were more likely to use investment accounts to save take-home pay, our data extend the analysis to the pandemic era.7 Figure 3 shows the annual share of men and women in our active checking account user sample transferring funds to investment accounts.
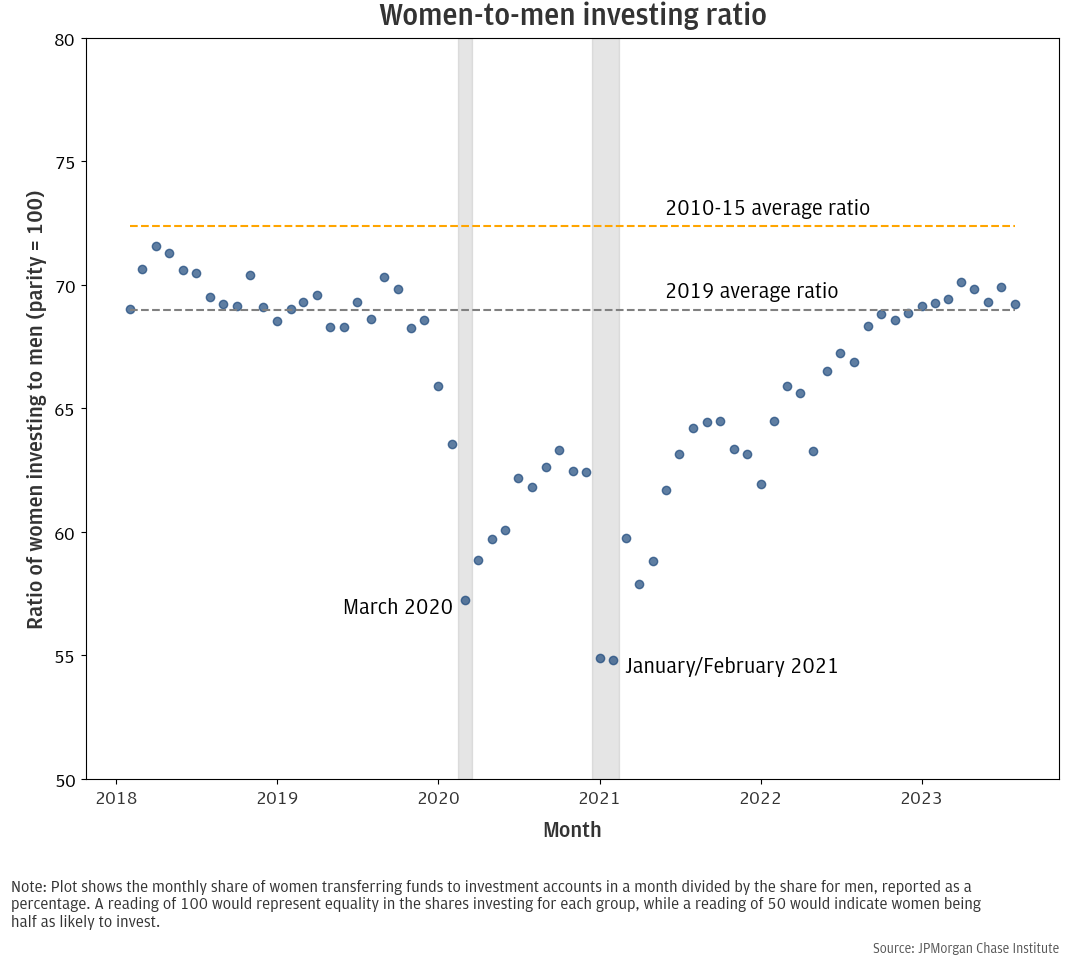
Zooming in to a monthly view, we can see sharp gender differences in investing around particular market and social events during the pandemic.8 March 2020 was one of the most volatile months for the stock market in decades, as prices reacted to the pandemic economic disruption. The S&P 500 declined by as much as one-third from February 19 to March 23, 2020. This was paired with a large spike in the savings rate, which increased the amount of investable funds. That March, the share of women investing fell from a recent average of about 70 per 100 men, to 57. Later in the pandemic, additional government stimulus and heightened interest among new investors coincided in the early months of 2021, and the share of women making new investments fell to below 55 per 100. The increase in men investing was a temporary phenomenon during the pandemic. The ratio of women-to-men making investments gradually recovered to the 2019 average ratio by late 2022, albeit still well below parity or even the decade-ago average.
Black and Hispanic individuals’ transfers of funds to investment accounts increased on an absolute and relative basis over the past decade, as shown in Figure 5. In terms of the annual share of individuals transferring money to investment accounts, the rate for Black and Hispanic individuals increased to over 3 times the 2010-15 average as of 2023, compared to a little over 2 times for White and Asian. In 2023, the share of Black and Hispanic individuals making investment transfers had fallen notably from its 2021 peak but remained significantly above pre-pandemic levels. Trends in investment transfers by race have mirrored dynamics observed in the distribution of income growth. That is, from 2016 to 2021, Black and Hispanic individuals’ incomes experienced relative gains, which fell from stimulus-fueled peaks in 2022-23.9
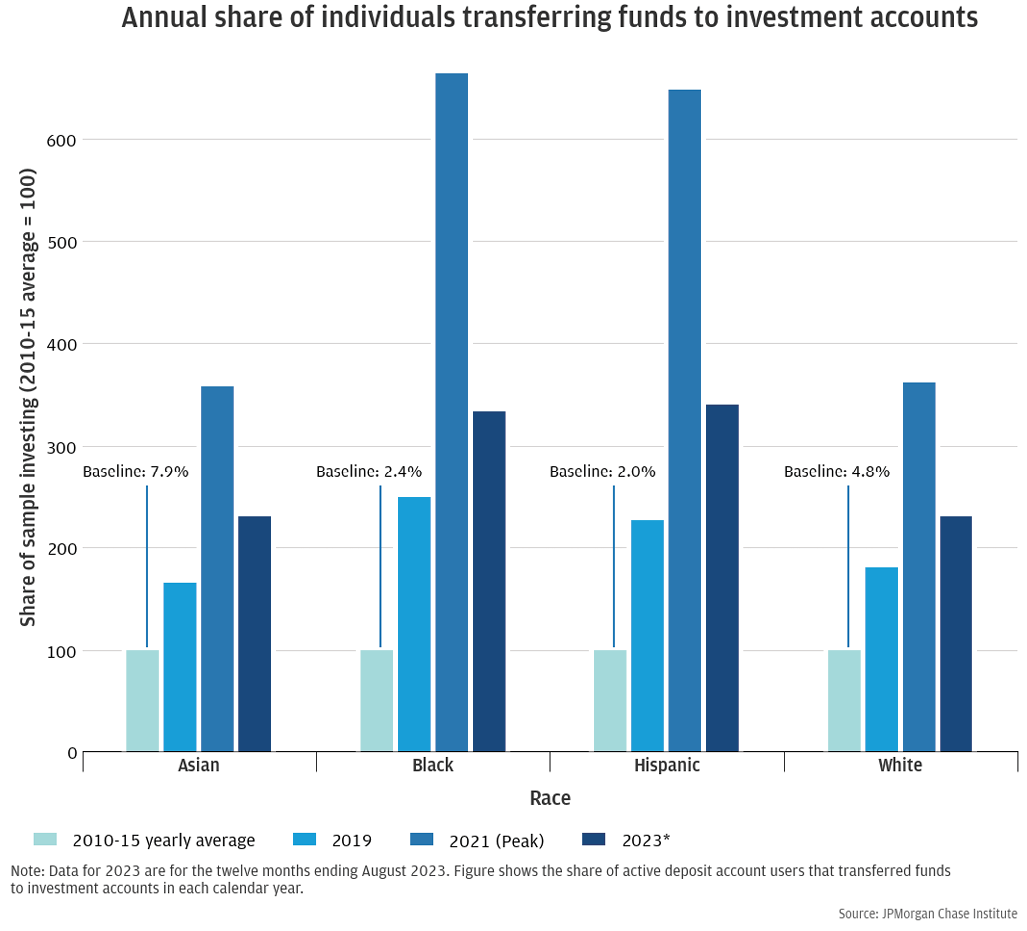
Even after the progress over the last decade, Black and Hispanic individuals still make up a disproportionately small share of the population making such investments. Moreover, the more volatile pandemic-era rise and fall of these racial groups’ investing activities suggests potential vulnerability to temporary asset price shocks. That is, steady investing over time can help reduce the potential impact of market volatility on investment performance, whereas concentrating purchases in time increases the chances that temporary price swings could lower investment returns.
Investors in brokerage accounts are less likely to be White and more likely to be under forty years old than five or ten years ago. Women have maintained a roughly constant share of the investing population on net, notwithstanding short-term fluctuations. Sharp, temporary increases in the relative number of younger investors and men transferring money into investment accounts during acute phases of the pandemic-era market volatility suggest a potential high degree of heterogeneity in investing patterns during times of heightened uncertainty.
The trends presented in this report reflect complex interactions between the unique pandemic-era economic environment (e.g., excess savings and fiscal stimulus), social-median-driven investing fads, and a changing investment platform landscape. With respect to wealth accumulation dynamics, demographic shifts have been stark. In addition to prior Institute findings10 involving trend-chasing in stock and crypto markets—apparent differences in use of financial investment accounts across population subgroups during the pandemic may inform policymakers seeking to understand and adapt to a changing retail investing landscape. New market entrants may provide a potential opportunity for innovations in financial education, and effective solutions are unlikely to be one-size-fits-all.
Relative increases of market risk-taking around pockets of extreme market volatility for men and younger individuals may suggest that future crises could feature pockets of “doubling down” of risk-taking at a time when those individuals’ jobs may be more at risk.11 During the pandemic, a strong government response—both fiscal and monetary—supported a rapid rebound that insulated individuals who added market risk in March 2020 (ex post a likely fruitful move): job security improved to historically favorable levels by mid-2021 and the stock market had recouped losses even earlier.12 The prolonged downturn of the Great Recession illustrates a counterpoint that may have carried less favorable outcomes for analogous investing behavior.13
Guvenen, Fatih, Sam Schulhofer-Wohl, Jae Song, and Motohiro Yogo. “Worker Betas: Five Facts about Systematic Earnings Risk.” The American Economic Review 107, no. 5 (2017): 398–403. https://doi.org/10.1257/aer.p20171094.
See Institute report “The Rise in Retail Investing: Roles of the Economic Cycle and Income Growth” (Wheat and Eckerd 2024)
See coverage in Wall Street Journal articles, “More Americans Than Ever Own Stocks” (December 2023) and “Black Investors Are the Biggest New Group of Stock Buyers,” (January 2024).
As discussed in Wheat and Eckerd (2024).
In analysis based on large-scale earnings data of U.S. individuals, Guvenen et al. (2017) measure average earnings sensitivity by income and demographic groups. Across the income distribution, men and younger individuals’ earnings fluctuate more widely alongside nationwide economic growth, as seen in Figure 1 of that paper.
As discussed in Wheat and Eckerd (2024).
Self-identified demographic data was obtained in 2021 from a third party for the JPMorgan Chase Institute to conduct economic research examining financial outcomes by race, ethnicity, and gender. The demographic data was matched to internal banking records using encrypted quasi-identifiers. This de-identified file that contains banking records and demographics is only available to the JPMorgan Chase Institute.
See Institute report “The Stock Market and Household Financial Behavior” (January 2021).
Note, differences in the frequency of investment transfers may drive a gap between the yearly figures for investing shares (Figure 3) relative to the monthly view (Figure 4).
See Institute report “Racial Income Inequality Dynamics” (2022).
As in Institute reports: The Stock Market and Household Financial Behavior (2021) and The Dynamics and Demographics of U.S. Household Crypto-Asset Use (2023).
As discussed in Guven et al. (2017) these groups face greater sensitivity of their labor earnings to economic growth.
We thank our research team, for their work and contribution to this research. Additionally, we thank Elizabeth Ellis, Robert Caldwell, Oscar Cruz, Alfonso Zenteno, and Annabel Jouard for their support. We are indebted to our internal partners and colleagues and acknowledge their contributions to each and all releases.
We would like to acknowledge Jamie Dimon, CEO of JPMorgan Chase & Co., for his vision and leadership in establishing the Institute and enabling the ongoing research agenda. We remain deeply grateful to Peter Scher, Vice Chairman, Tim Berry, Head of Corporate Responsibility, Heather Higginbottom, Head of Research, Policy, & Insights, and others across the firm for the resources and support to pioneer a new approach to contribute to global economic analysis and insight.
This material is a product of JPMorgan Chase Institute and is provided to you solely for general information purposes. Unless otherwise specifically stated, any views or opinions expressed herein are solely those of the authors listed and may differ from the views and opinions expressed by J.P. Morgan Securities LLC (JPMS) Research Department or other departments or divisions of JPMorgan Chase & Co. or its affiliates. This material is not a product of the Research Department of JPMS. Information has been obtained from sources believed to be reliable, but JPMorgan Chase & Co. or its affiliates and/or subsidiaries (collectively J.P. Morgan) do not warrant its completeness or accuracy. Opinions and estimates constitute our judgment as of the date of this material and are subject to change without notice. No representation or warranty should be made with regard to any computations, graphs, tables, diagrams or commentary in this material, which is provided for illustration/reference purposes only. The data relied on for this report are based on past transactions and may not be indicative of future results. J.P. Morgan assumes no duty to update any information in this material in the event that such information changes. The opinion herein should not be construed as an individual recommendation for any particular client and is not intended as advice or recommendations of particular securities, financial instruments, or strategies for a particular client. This material does not constitute a solicitation or offer in any jurisdiction where such a solicitation is unlawful.
Wheat, Chris, and George Eckerd. 2024. “The changing demographics of retail investors.” JPMorganChase Institute. https://www.jpmorganchase.com/institute/all-topics/financial-health-wealth-creation/the-changing-demographics-of-retail-investors

Chris Wheat
President, JPMorganChase Institute

George Eckerd
Wealth and Markets Research Director, JPMorganChase Institute