
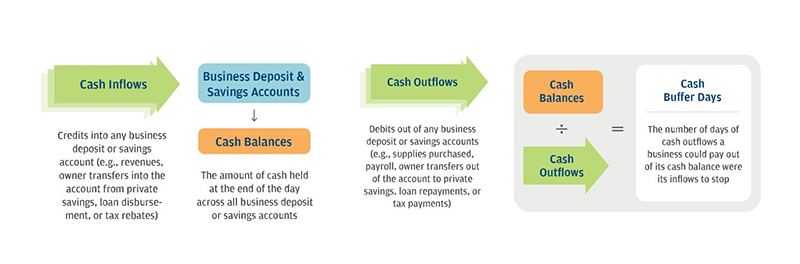
Measuring cash inflows, outflows, balances, and buffer days
Latest news

An Ohio-based company is protecting first responders around the world
With support from JPMorganChase, Fire-Dex is providing protective equipment to firefighters in 100 countries and all 50 states.
Learn moreLatest news

The consistency of health insurance coverage in small businesses: industry challenges and insights
Learn moreLatest news

Veteran’s Unconventional Path to Landing her Dream Job in Tech
U.S. Army Veteran Ashley Wigfall transitioned to a civilian role and charted her path to technologist through mentorship and skills training at the JPMorgan Chase tech hub in Plano, Texas.
Learn more
Research
Cash is King: Flows, Balances, and Buffer Days
Evidence from 600,000 Small Businesses
September 1, 2016
For most small business, cash reserves are a critical tool for meeting liquidity needs. Cash reserves provide a readily available means to pay employees and suppliers in normal times and are an important buffer to draw upon during adverse times. This is particularly true for small businesses with limited access to credit and other sources of liquidity. In other words, cash reserves are a key measure of the vitality and security of a small business.
In this inaugural report on the small business sector, the JPMorgan Chase Institute explores the financial lives of small business through the lens of cash inflows, outflows, and account balances. We find that, despite the importance of cash reserves, most small businesses hold a level of cash reserves that would provide an insufficient cushion in the face of a significant economic downturn or other disruption. Using a new data asset constructed from over 470 million transactions conducted by 597,000 small businesses from February to October 2015, our analysis shows that half of all small businesses hold a cash buffer large enough to support 27 days of their typical outflows.
This report also explores key industry characteristics that help explain the drivers of cash buffers. Additionally, it offers a new synthesis of publicly available data to begin to draw together a comprehensive view of the small business sector.
These findings are relevant to policy makers who seek to assist small businesses; to nonprofit organizations that coach small business owners; to financial services firms that help small businesses manage their liquidity; and to owners of small businesses who seek benchmarks for guidance in managing their own liquidity.
We hope this report draws attention to cash balances as an important issue, helps people better understand differences among small businesses, and helps in the development of smarter programs, products, and policies that enable small businesses to flourish.
Measuring cash inflows, outflows, balances, and buffer days
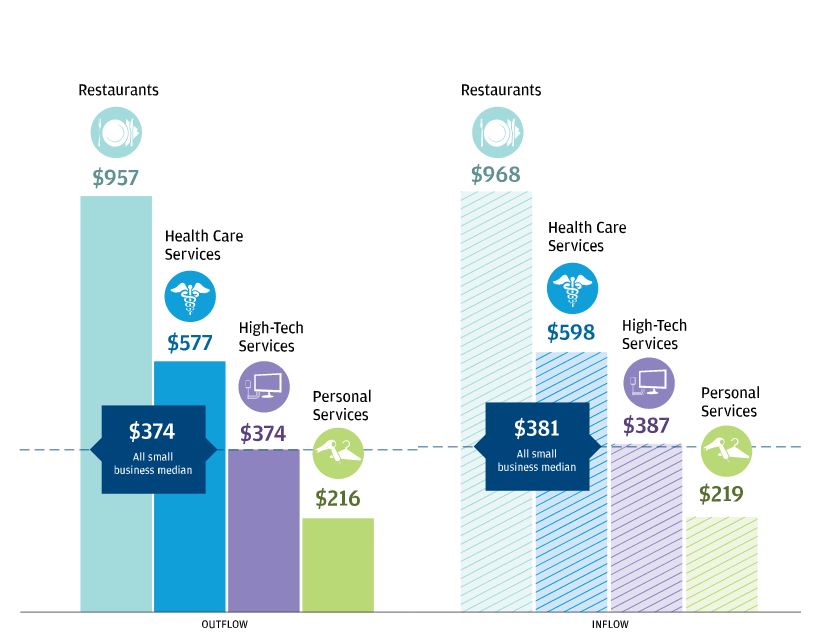
The median small business has average daily cash outflows of $374 and average daily cash inflows of $381, with wide variation across and within industries.
Outflows refer to debit transactions paid out of any business deposit or savings accounts, such as the purchase of material and payroll, owner transfers out of the account to private savings, loan repayments, or tax payments.
Inflows refer to credit transactions into any business deposit or savings account, such as revenues, owner transfers into the account from private savings, loan funding, or tax rebates.
Individual small business average daily inflows and outflows are highly correlated.
Average daily cash inflows and outflows vary widely by industry:
Average daily cash outflows vary substantially within industries as well:
The median small business holds an average daily cash balance of $12,100, with wide variation across and within industries.
Balances refer to the amount of cash held by a business across all its business deposit or savings accounts.
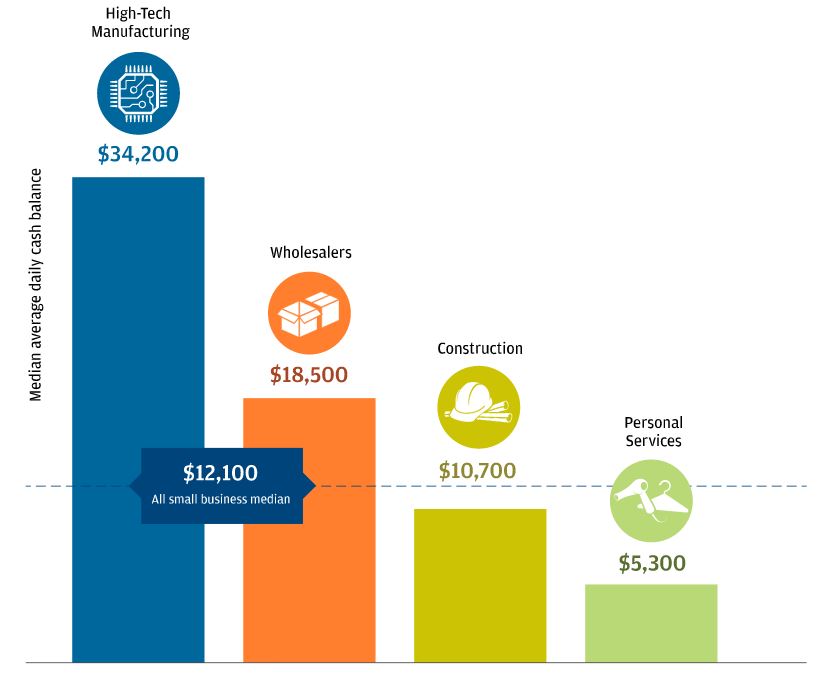
Cash balances vary widely by industry:
Cash balances vary substantially within industries as well:
Half of all small businesses hold a cash buffer of less than one month.
Cash buffer days are the number of days of cash outflows a business could pay out of its cash balance were its inflows to stop. We estimate cash buffer days for a business by computing the ratio of its average daily cash balance to its average daily cash outflows.
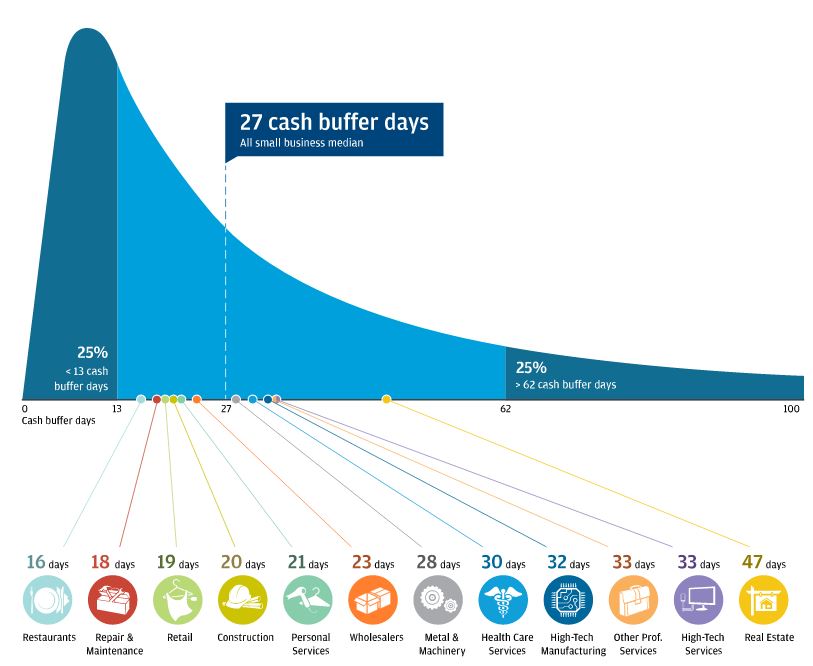
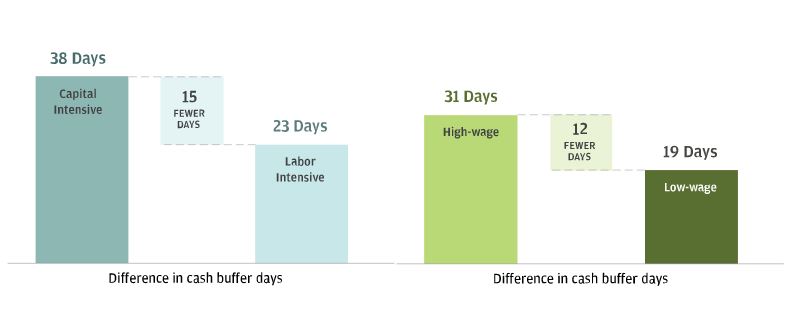
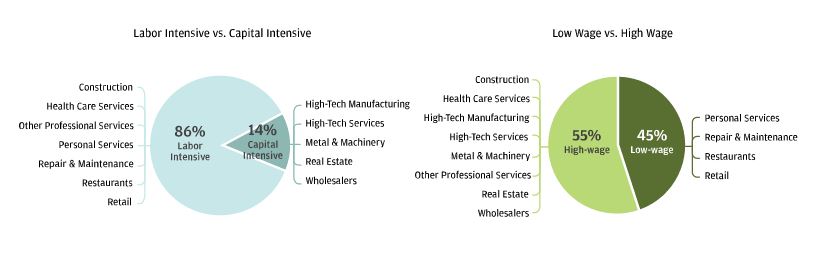
Small businesses in labor-intensive or low-wage industries hold fewer cash buffer days than those in capital-intensive or high-wage industries.
Share of Total US Small Business Employment within Each Segment
Share of Total US Small Business Employment within Each Segment
Small businesses in industries with a high amount of information technology or intellectual property (IT/IP) do not hold cash buffer days that are very different from low IT/IP industry businesses.
Similarly, small businesses in business-to-business (B2B) industries do not hold cash buffer days that are very different from business-to-consumer (B2C) industry businesses.
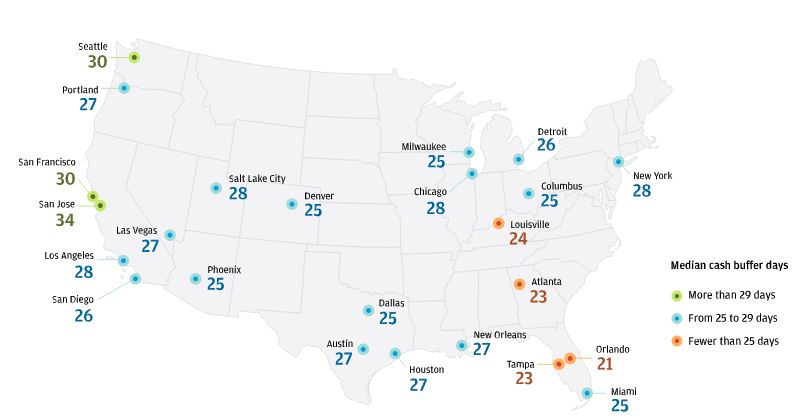
Small business cash buffer days vary across metropolitan areas, but no clear pattern emerges from this variance.
Median cash buffer days in our 24 selected cities vary from 21 days in Orlando to 34 days in San Jose, a spread of 60 percent. Differences in industry mix and population between metropolitan areas do not explain this variation.
Cash buffer days are the number of days of cash outflows a business could pay out of its cash balance were its inflows to stop. We estimate cash buffer days for a business by computing the ratio of its average daily cash balance to its average daily cash outflows.
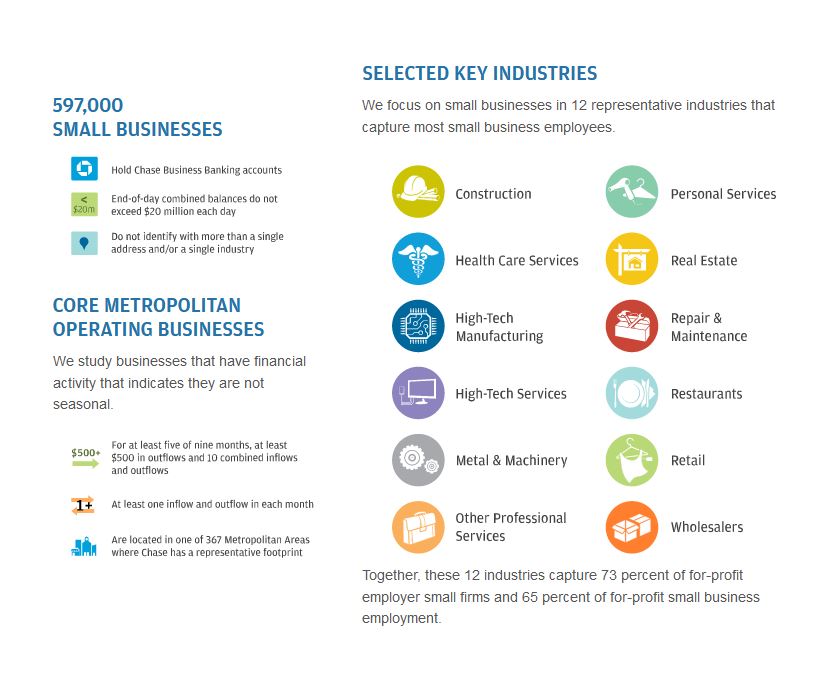
We constructed a sample of 597,000 businesses who hold Chase Business Banking deposit accounts and meet our criteria for small, core metropolitan operating businesses. We then used 470 million anonymized transactions from these businesses to produce a daily view of cash inflows, cash outflows, and end-of-day balances over the nine non-holiday months from February 2015 to October 2015.
This study leverages a new JPMorgan Chase Institute small business data asset to highlight cash buffer days as a key financial vitality indicator for small businesses. Our research shows substantial variation in cash buffer days for small businesses across and within industries and by region. Many small businesses may not have enough cash to continue operations in the face of a month-long loss of cash inflows due to an economic downturn or other negative shock.
Interventions that help small business owners better understand and manage cash could support the financial health of a sector that provides the economic base for a large portion of the U.S. population. Specifically, our new industry segmentation draws attention to an opportunity to develop new policies that target large numbers of especially financially fragile small businesses in labor-intensive or low-wage industries, in contrast to policies that target small businesses in high-technology, capital intensive, high-wage, or business-serving industries.
Finally, cash buffer days can focus the attention of policymakers, advocates, and private-sector partners on liquidity as an important feature of the credit landscape. New educational programs and diversified credit offerings can help small business owners better understand and manage their liquidity, and substantially improve the financial resilience of the small business sector.
Authors

Diana Farrell
Founding and Former President & CEO

Chris Wheat
President, JPMorganChase Institute