Research

Growth, Vitality, and Cash Flows

High-Frequency Evidence from 1 Million Small Businesses

July 1, 2018

Findings

Executive summary

The small business sector, comprised of businesses with fewer than 500 employees, is an important contributor to overall US economic growth. However, the heterogeneity of the sector can obfuscate the ways in which it actually does or does not contribute to economic growth, making it difficult to develop targeted policies to support these contributions.

In this report, the JPMorgan Chase Institute introduces a newly augmented small business data asset to empirically address questions of small business growth, vitality, and economic contribution. We built a sample of 1.3 million de-identified small businesses with Chase Business Banking accounts active between October 2012 and February 2018. The over 3.1 billion transactions we analyze from these businesses provide a novel view of daily revenues, expenses, and financing cash flows for individual small businesses. We use this data asset to develop a revised segmentation of the small business sector, and a new typology of cash flow patterns. These frameworks allow us to inform the contributions of different kinds of small businesses to the US economy, as well as offer new insights about the importance of cash flow management to small business outcomes.

Part I:

The Stability and Dynamics of Small Business Segments

We propose a refined segmentation of the small business sector based on size, complexity, and dynamism, and use this segmentation to identify the contributions of different small business segments to the U.S. economy.

Infographic describes about The Stability and Dynamics of Small Business Segments

PART I

The small business sector can be segmented by size and complexity on one axis and dynamism on another. On the far end of the size and complexity spectrum is a very small segment of financed growth firms, which are large and complex. Although they aspire to grow, their observed dynamism varies. Organic growth firms are a large segment of very dynamic firms that can vary greatly by size and complexity. Among less dynamic firms, the stable micro segment includes smaller firms, and the stable small employer segment consists of larger, more complex firms.

Source: JPMorgan Chase Institute

01

Organic growth businesses in aggregate generate the majority of small business revenue and payroll, but are also individually the most likely to exit.

Small businesses are dynamic: Six out of 10 small businesses are organic or financed growth firms.

Dynamic small businesses take big risks: 31 percent of organic growth and 20 percent of financed growth firms do not survive four years.

Financing is not the only way to grow: More than half of small businesses are organic growth firms, and they generate the majority of revenue and payroll in the small business sector.

Bar garph describes about Organic growth businesses in aggregate generate the majority of small business revenue and payroll

FINDING ONE

Organic growth firms contributed 51 percent of small business aggregate revenues in year four. Financed growth firms contributed 22 percent, and stable micro and stable small employer firms each contributed 14 percent.

Organic growth firms contributed 52 percent of small business aggregate payroll in year four. Financed growth firms were 25 percent, stable micro firms were 4 percent, and stable small employer firms contributed 19 percent.

Thirty-one percent of organic growth firms, 20 percent of financed growth firms, 15 percent of stable micro firms, and 12 percent of stable small employer firms exited within four years.

Source: JPMorgan Chase Institute

01

Financed growth firms may be concentrated in some industries and cities, but organic growth firms abound in every industry and city.

Cities with the highest concentration of financed growth small businesses had twice the incidence of financed growth firms, compared to cities with the lowest concentration, but all cities have large shares of organic growth firms.

Small businesses in high-tech manufacturing are significantly more likely to be financed growth firms, but all industries have sizable shares of organic growth firms.
 

Bar garph describes about Cities with the highest and lowest share

FINDING TWO

Cities with the highest and lowest share of firms

A relatively large share of small businesses, 4.7 percent, in San Jose, CA were financed growth firms. This is 2.9 times the share in Denver, CO, where 1.6 percent of small businesses were financed growth firms. Fifty-eight percent of small businesses in Portland, OR were organic growth firms. This is only 1.1 times the share in San Francisco, CA, which had the lowest share at 52 percent.

Industries with the highest and lowest share of firms

In the high-tech manufacturing industry, 16.5 percent of small businesses were financed growth firms. This is 27.5 times the share in the repair and maintenance industry, where only 0.6 percent were financed growth firms. Sixty-one percent of small businesses in high-tech services were organic growth firms. This is only 1.3 times that of personal services, the industry with the lowest share of organic growth firms.

Source: JPMorgan Chase Institute

01

Nonemployer small businesses are more likely to exit than to hire employees.

We tracked employer status during the first four years of operations for our cohort of 138,000 firms founded in 2013, 5 percent of which were employers in their first year.

Each year, a small percentage of nonemployers become employers, and that likelihood only decreases as firms mature.

Infographic describes about  Nonemployer small businesses are more likely to exit than to hire employees

FINDING THREE

Of the 131,300 nonemployer firms in year one, most remained nonemployer firms in year two. Of the remaining firms, some became employers in year two, but more than five times that amount exited. Of the 6,800 employer firms in year one, most remained employer firms in year two, and the rest either became nonemployers, or exited. This pattern is consistent through year four.

  • 75% of employer firms continue being employers between year 1 and year 2.
  • 9% of employer firms exit between year 1 and year 2.
  • 16% of employer firms become nonemployers between year 1 and year 2.
  • 2% of nonemployer firms become employers between year 1 and year 2.
  • 14% of nonemployer firms exit between year 1 and year 2.
  • 84% of nonemployer firms continue being nonemployers between year 1 and year 2.
  • 77% of employer firms continue being employers between year 2 and year 3.
  • 7% of employer firms exit between year 2 and year 3.
  • 16% of employer firms become nonemployers between year 2 and year 3.
  • 2% of nonemployer firms become employers between year 2 and year 3.
  • 14% of nonemployer firms exit between year 2 and year 3.
  • 84% of nonemployer firms continue being nonemployers between year 2 and year 3.
  • 79% of employer firms continue being employers between year 3 and year 4.
  • 6% of employer firms exit between year 3 and year 4.
  • 15% of employer firms become nonemployers between year 3 and year 4.
  • 2% of nonemployer firms become employers between year 3 and year 4.
  • 11% of nonemployer firms exit between year 3 and year 4.
  • 87% of nonemployer firms continue being nonemployers between year 3 and year 4.

Source: JPMorgan Chase Institute

Part II:

Cash Flow Patterns and Small Business Performance

We identify seven cash flow patterns that represent different cash flow management problems, and then use these patterns to explore the relationship between cash flow management and small business performance.

Individual firms may experience different cash flow patterns at different stages of their lifecycles. Moreover, some cash flow patterns are more prevalent in some segments.

01

New small businesses achieve more stable and regular cash flow patterns over time, or exit.

Most new small businesses, regardless of their initial cash flow patterns, transition into more regular patterns as they mature.

Small businesses with volatile expenses (relative to revenues) are much more likely to exit than those with other cash flow patterns, suggesting that large and perhaps unexpected expenses could be especially difficult to manage.

Small businesses can and do mitigate irregular cash flows by holding more cash.

Bar garph describes about Share of firms exiting in year 4 by cash flow pattern in year 3

FINDING FOUR

In year one, 69 percent of firms had regular cash flow patterns. In year four, 78 percent of surviving firms had regular cash flow patterns. Most of these had regular cash flow patterns in year one as well, but about a quarter of them were formerly irregular.

Share of firms exiting in year four by cash flow pattern in year three

Regular cash flow patterns

Cash flow pattern Exit share
Regular weekly 3%
Regular weekly + financing 5%
Semimonthly revenues 7%
Semimonthly revenues + financing 7%


Irregular cash flow patterns

Cash flow pattern Exit share
Sporadic revenues 13%
Erratic timing 14%
Volatile expenses 21%


Source: JPMorgan Chase Institute

01

Growing dynamic firms transition from irregular cash flow patterns in different ways, stable firms survive, and dynamic firms that fail to grow exit.

Every small business segment has firms with each of the seven cash flow patterns, but some patterns are more prevalent in some segments, especially as firms mature.

New dynamic small businesses are particularly prone to certain types of irregularity: Financed growth firms are particularly likely to have sporadic revenues, and organic growth firms are especially likely to experience erratic timing of both revenues and expenses. These types of irregularity become less common for firms that grow.
 

Bar garph describes about Cash flow patterns of growing dynamic firms

FINDING FIVE

Cash flow patterns of growing dynamic firms

Among growing financed growth firms, 66 percent had regular cash flow patterns in year one. The most common type of irregular cash flows in the first year was sporadic revenues. In year four, 80 percent of surviving firms were regular, and the share of firms with sporadic revenues dropped dramatically.

Among growing organic growth firms, 61 percent had regular cash flow patters in year one. The most common type of irregular cash flows in the first year was erratic timing. In year four, 85 percent of surviving firms were regular, and the share of firms with erratic timing dropped dramatically.

  • Fifty-three percent of declining firms exit by year four.
  • Eight-nine percent of stable firms survive four years.

Source: JPMorgan Chase Institute

Infographic describes about Cash flow patterns of growing dynamic firms

Finding Five

Cash flow patterns of growing dynamic firms

Among growing financed growth firms, 66 percent had regular cash flow patterns in year one. The most common type of irregular cash flows in the first year was sporadic revenues. In year four, 80 percent of surviving firms were regular, and the share of firms with sporadic revenues dropped dramatically.

Among growing organic growth firms, 61 percent had regular cash flow patters in year one. The most common type of irregular cash flows in the first year was erratic timing. In year four, 85 percent of surviving firms were regular, and the share of firms with erratic timing dropped dramatically.

  • Fifty-three percent of declining firms exit by year four.
  • Eight-nine percent of stable firms survive four years.

Source: JPMorgan Chase Institute

© 2018 JPMorgan Chase & Co.

Data

We constructed a sample of 1.3 million firms who hold Chase Business Banking deposit accounts and meet our criteria for small operating businesses in core metropolitan areas. We then used over 3.1 billion anonymized transactions from these businesses to produce a daily view of revenues, expenses, and financing flows for the five years between October 2012 and February 2018.

We also constructed a cohort of firms which opened their business banking accounts in 2013. Firm cash flow patterns and behavior can vary as they mature, and this longitudinal sample controls for age by comparing firms of similar age.
 

Infographic describes about The full sample is comprised of 1.3 million small businesses

DATA

Full Sample

The full sample is comprised of 1.3 million small businesses that meet the following criteria:

  • Hold a Chase Business Banking account at any point between October 2012 and February 2018.
  • Satisfy the following criteria for every month of at least one consecutive 12 month period:
    • Hold at most two business deposit accounts
    • End-of-day combined balances never exceed $20 million
    • Operate in one of the twelve industries that are characteristic of the small business sector
    • Operate in one of 386 metropolitan areas where Chase has a representative footprint
    • Show no evidence of operating in more than a single location or industry
  • Satisfy criteria that indicate they are operating businesses by having, in at least one consecutive 12 month period, three months with the following activity in each month:
    • At least $500 in outflows
    • At least 10 transactions

2013 Founding Longitudinal Sample

The 2013 Founding Longitudinal sample is comprised of 138,000 small businesses that meet the following criteria:

  • Satisfy all “full sample” criteria.
  • Opened a Chase Business Banking account in 2013:
    • Opening a dedicated business account is an important milestone, and we used this event to determine firm age

Source: JPMorgan Chase Institute

Conclusion

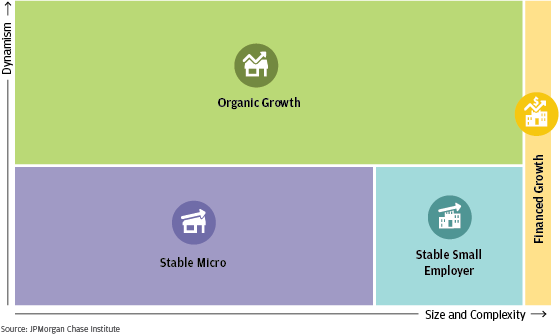
In this report, we brought new data to two conversations about the economic contributions of the small business sector—a first concerning the large contributions of a potentially small set of high-growth businesses, and a second concerning the contributions of the majority of small businesses to widespread and diverse economic growth. We use these data to offer two new frameworks in which to consider these questions—a revised segmentation of the small business sector, and a new typology of cash flow patterns.

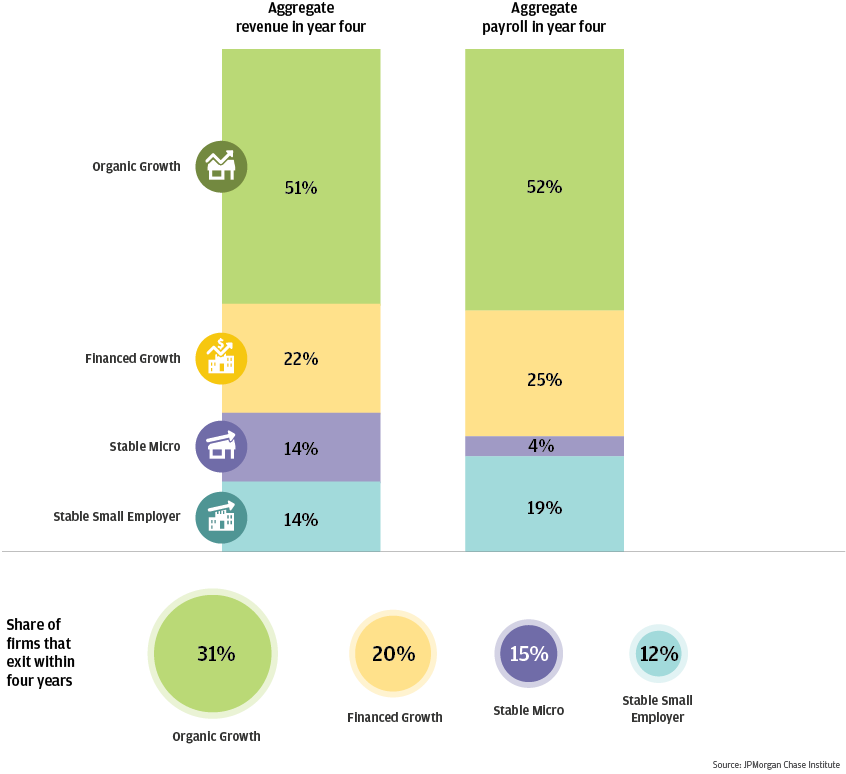
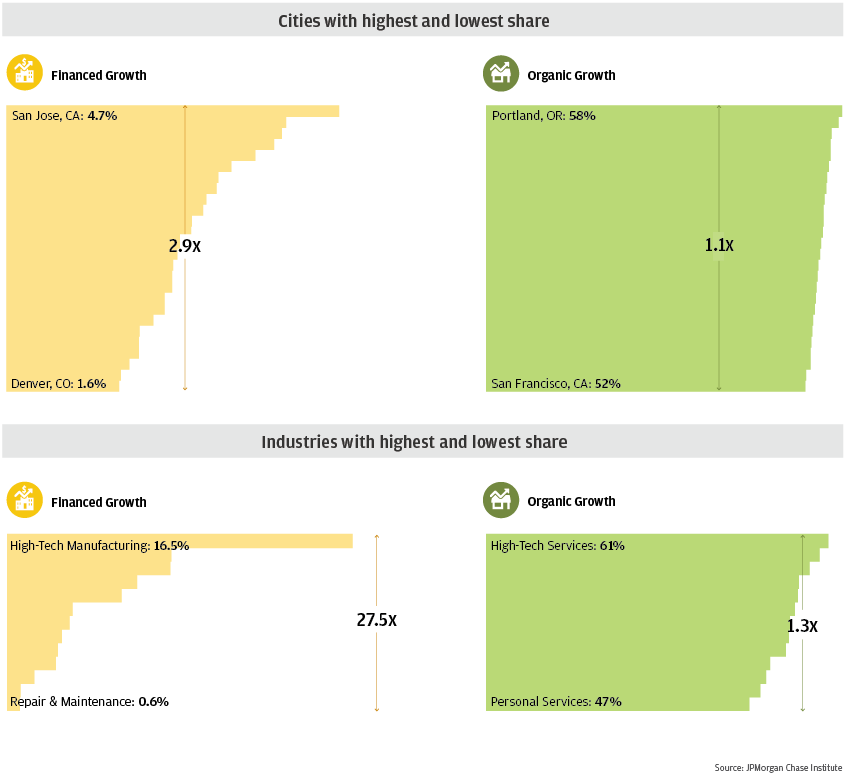
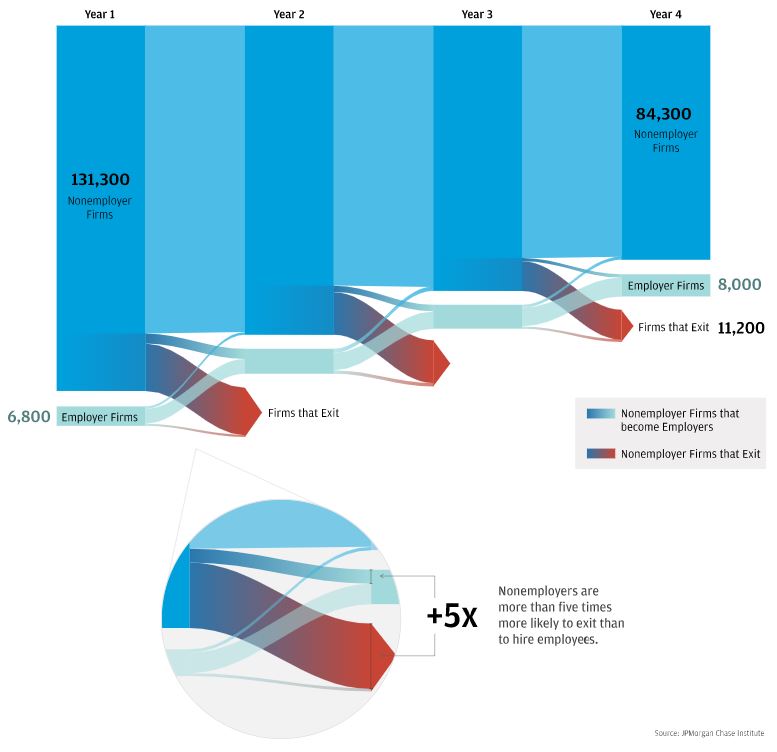
Our findings highlight the existence and economic importance of a large segment of dynamic small businesses that grow organically without heavy reliance on external financing. In aggregate, these small businesses generate substantial shares of both revenue and payroll, and importantly, are widely distributed across regions and industries. While the nonemployer small businesses that make up the majority of the sector are unlikely to transition to employer status, many are nevertheless important when viewed through other lenses of economic growth.

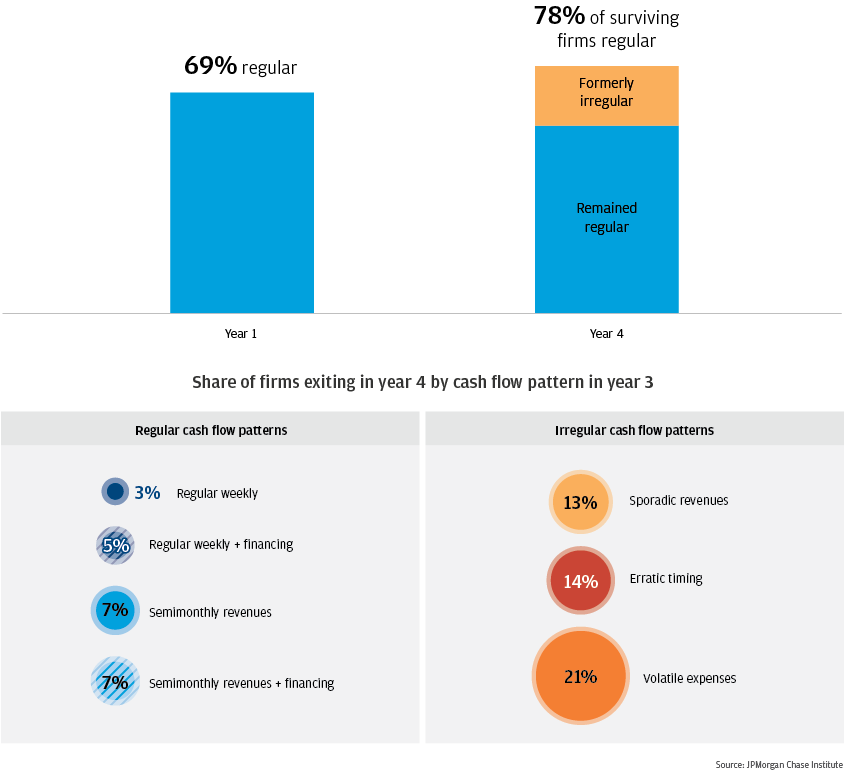
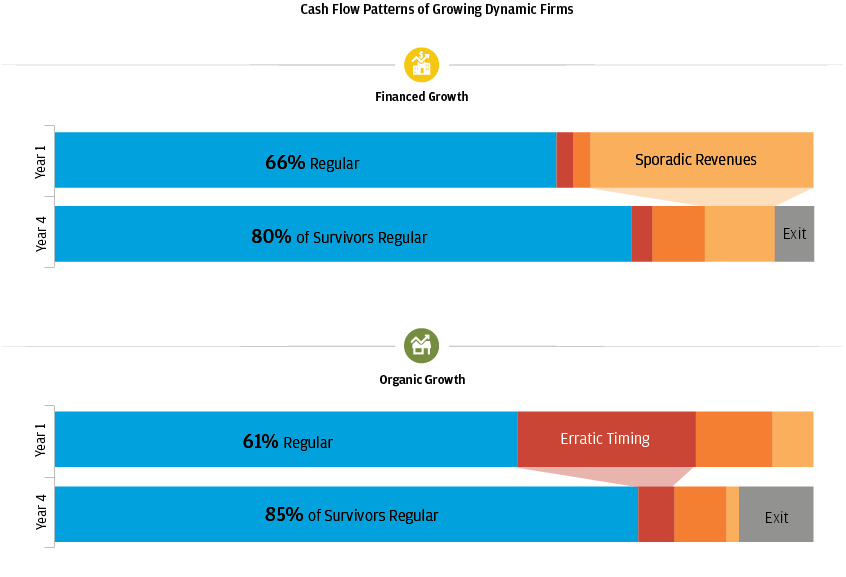
Our findings also offer a first high-frequency view of the cash flow dynamics of small businesses. Across the board, small businesses have volatile, irregular, and potentially unpredictable cash flows. Many small businesses transition to more regular cash flows as they age, though many that fail to do so exit. Notably, the kinds of cash flow issues that small business navigate vary meaningfully by segment—financed growth firms were particularly likely to face and resolve cash flow problems related to the uncertainties around revenue, while organic growth firms were more likely to experience a broader array of unexpected cash flow timing.

These findings suggest that policy makers interested in economic growth have an opportunity to focus on a wider range of small businesses than the financing-intensive high growth firms that often are the focus of small business policy, and that opportunities for productive action may exist across a wider variety of regions and industries than previously thought. While the irregularity of cash flow we observe across segments warrants a continued focus on ensuring that small businesses have sufficient liquidity to grow, our findings suggest that programs that help small businesses better manage their cash flows may be equally, if not more, impactful in supporting the overall growth of the U.S. economy.
 

Authors

Diana Farrell

Founding and Former President & CEO

Chris Wheat

President, JPMorganChase Institute

Chi Mac

Business Research Director