Figure 1: While small business cash balances were elevated through September, expenses by the end of September 2020 were 7 percent lower than they were at the end of September 2019

As the COVID-19 pandemic continues to affect the physical and economic health of the U.S., policymakers continue to have an incomplete view of the financial response of the small business sector. In the early months of the pandemic, the typical small business saw substantial revenue and cash liquidity declines (Farrell, Wheat, and Mac, 2020a, 2020c); moreover, there were high observed rates of small business failures. (Bartik et al., 2020; Fairlie 2020a, 2020b). These observations are consistent with the view that revenues and cash liquidity are strongly related to small business survival (Farrell, Wheat, and Mac, 2020b). However, in subsequent months, cash balances saw substantial increases and remained at levels substantially higher than they were prior to the pandemic (Farrell, Wheat, and Mac 2020c, Census Bureau 2020).1 Notably, these balance increases occurred while small business revenues remained at levels meaningfully below levels observed prior to the pandemic.2
The trajectory of cash balances and revenues since April raises an important question for policymakers about the extent to which small businesses continue to make payments to employees and other suppliers. In the early months of the pandemic, expenses fell sharply along with revenues (Farrell, Wheat, and Mac, 2020a). From mid-April to May, cash balances increased sharply, but with a timing that was consistent with the arrival of cash inflows from federal programs including, but not limited to, the Payroll Protection Program and other CARES Act programs (Farrell, Wheat, and Mac 2020c). Less clear is whether expense growth accelerated after these liquidity increases, or whether they continued to track the slow recovery of revenues. A more detailed understanding of the progression of expenses is critical to ongoing policy debates around the appropriate provision of cash liquidity to the sector, and the potential for further shutdowns and revenue losses in the future.
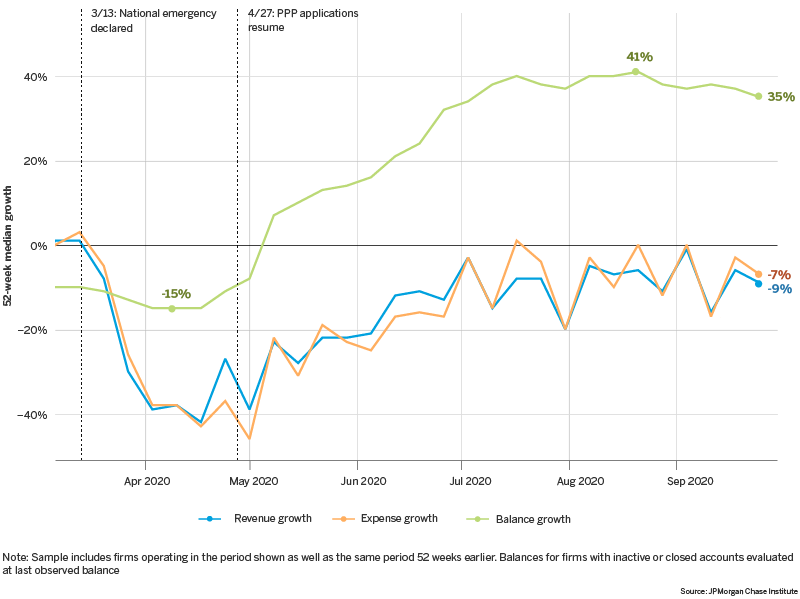
Figure 1: While small business cash balances were elevated through September, expenses by the end of September 2020 were 7 percent lower than they were at the end of September 2019

JPMC Institute data shows that while many small businesses had substantially increased cash liquidity over the summer months, expense growth did not materially outpace revenue growth through September. Figure 1 depicts weekly median balance, revenue, and expense growth for firms in our sample from the week ending March 3rd until the week ending September 25th. In these data, median balance growth dropped to -15 percent during the week ending April 10th, reached its peak during the week ending August 21st at 41 percent, and then gradually tapered to 35 percent by the week ending September 25th. As noted in prior research, large increases in cash balances followed just after PPP applications resumed in late April, and the immediate subsequent growth in balances is likely attributable to receipt of PPP funds—it is unlikely that this increase resulted from small businesses generating savings by cutting expenses more than revenues (Farrell, Wheat, and Mac, 2020c). However, our most recent data show that median balances continued to climb for several months after that point. Specifically, the trajectory of balance growth from early May to late September may be driven both by operational and financing cash flows.
Notwithstanding higher levels of cash liquidity, Figure 1 also shows that typical small business expenses remained depressed, down 7 percent by the end of September, and closely tracking the slow recovery in revenues. Administrative data from payroll processors indicate similar declines in small business payroll in September, suggesting that small businesses have reduced payments to both employees and other suppliers.3 Notably, expenses may be beginning to climb more quickly than revenues. Between early May and early July, median revenue growth was often higher than median expense growth, consistent with the continued upward trajectory of balances, and small business financial responses after other disasters (Farrell and Wheat, 2018). In contrast, from early July until the end of September, median expense growth was often higher than revenue growth, consistent with flattening balance growth and the beginning of a decline in median balances.
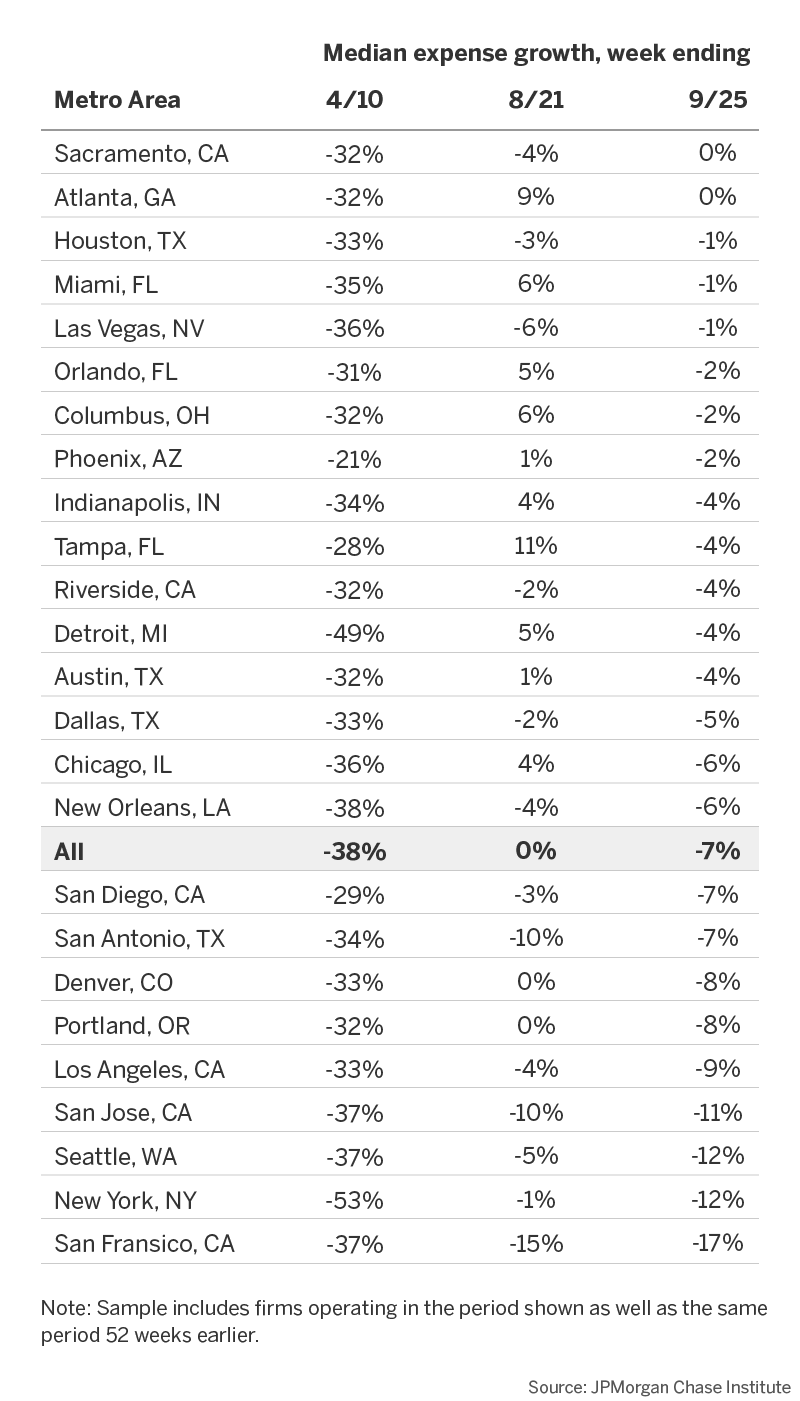
Table 1: Expense growth varies widely across cities

The overall shape of expense trajectories was similar across cities, though the extent of expense growth and decline varied widely. Table 1 presents median expense growth for three weeks—the week with the largest overall decline in median cash balances in April, the week with peak median balance gains in August, and the last week in our data series in September—across 25 metro areas. In San Jose, Seattle, New York, and San Francisco, most small businesses had expenses at least 10 percent lower than they were 52 weeks earlier by the end of September. In contrast, in Sacramento and Atlanta, expenses had returned to levels observed 52 weeks prior.
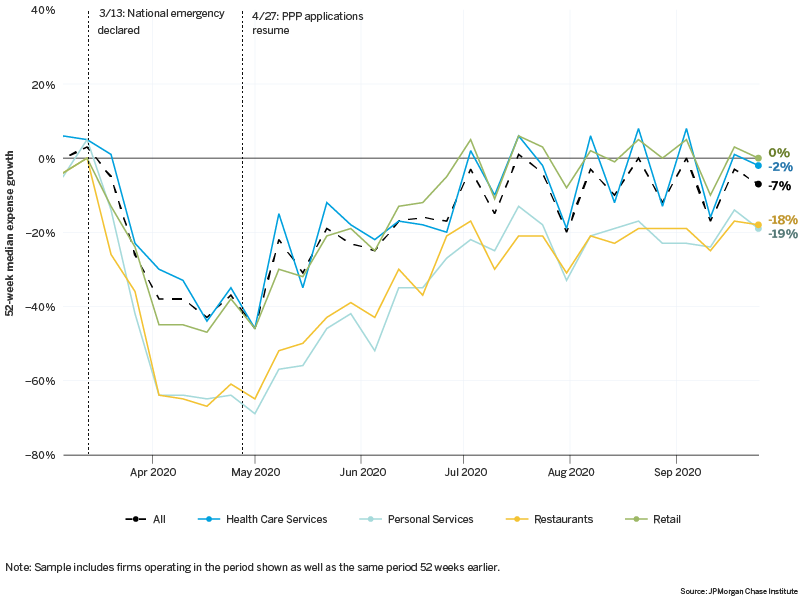
Figure 2: Typical small restaurant expenses were 18 percent lower at the end of September 2020 as compared to the end of September 2019

Finally, our data illustrate that small businesses experienced this overall pattern of expense growth across a wide range of industries. Figure 2 shows median expenses growth for four industries: restaurants, personal services, retail, and health care services. At the onset of the pandemic, restaurants and personal services saw some of the most severe drops in revenue and balances, retail small businesses saw declines that were still large if less so, while health care services firms experienced a more modest decline (Farrell, Wheat, and Mac, 2020a). Over the summer, restaurants and personal services continued to see the largest decreases in expenses, with expenses still lower by 18 and 19 percent by the end of September, respectively. To the extent that these lower expenses reflect the relative inability of businesses in these industries to attract and serve customers over the summer months, their owners might be even more inclined to limit payments facing the challenges in upcoming winter months. Notably, by the end of September, expenses at health care service providers were only two percent lower than 52 weeks prior, and expenses at retail firms had returned to parity with expenses from the prior year.
This brief provides a view of the progression of typical small business cash balances, revenues, and expenses during the months following the onset of the COVID-19 pandemic and into the early fall of 2020, using administrative banking data. Initial policy efforts at both federal and local levels focused on injecting liquidity into small businesses facing a likely shortfall in revenue of unknown duration. Our data show that, despite a slow recovery of revenues in the sector, many small businesses continue to retain cash at levels well above typical reserves.
Specifically, our view on expenses and cash balances show how small businesses expanded their cash reserves through policies that injected cash into businesses, and by keeping expenses low in the face of prolonged exposure to lower revenues. Notably, the typical small business in prior years operated with a cash buffer only large enough to support 2-3 weeks of cash outflows, suggesting that recent balances may be large in relative rather than absolute terms. While early trends suggest that these balances are beginning to decline, our data do not provide evidence that suggests that many small businesses have less cash than they did prior to the pandemic. At a minimum, this suggests that policy interventions to support the stability of the sector through cash injections have achieved that goal to a greater extent than revenue data might suggest.
With this context in mind, we offer the following implications for leaders and decision makers seeking to sustain the sector and support its recovery:
Small business owners may be limiting cash payments in order to maintain liquidity. Given the criticality of maintaining cash to survive, many small business owners may have rationally reduced, delayed, or otherwise chosen not to make payments related to their business. This may include deferring maintenance and upkeep of key assets, limiting wages or employee benefits, or other choices that may undermine the medium-term viability of their firms. A sector with depleted assets or growing accounts payable may be less well positioned for a recovery than basic measures of the share of operating small businesses may indicate.
Expense reduction may not be a viable long-run strategy for many small businesses. Overall, we do observe that expense growth outpaced revenue growth in many recent weeks. This may suggest that small business owners are less able to defer payments in recent weeks than they were earlier in the pandemic. If so, policymakers may soon need to consider other mechanisms to support the liquidity of businesses in the small business sector.
We thank Anuradha Raghuram for her hard work and vital contributions to this research.
This effort would not have been possible without the critical support of our partners from the JPMorgan Chase Consumer & Community Bank and Corporate Technology Solutions teams of data experts, including Michael Aguilar, Kyung Cho-Miller, Anoop Deshpande, Andrew Goldberg, Melissa Goldman, Senthilkumar Gurusamy, Derek Jean-Baptiste, Brian Maddox, Albert Raymond, Anthony Ruiz, Subhankar Sarkar, Breann Zickafoose, and from our internal partners and JPMorgan Chase Institute team members including Haley Dorgan, Elizabeth Ellis, Alyssa Flaschner, Fiona Greig, Courtney Hacker, Chris Knouss, Sarah Kuehl, Sruthi Rao, Parita Shah, Tremayne Smith, Gena Stern, Nicholas Tremper, and Preeti Vaidya.
We would like to acknowledge Jamie Dimon, CEO of JPMorgan Chase & Co., for his vision and leadership in establishing the Institute and enabling the ongoing research agenda. Along with support from across the Firm—notably from Peter Scher, Max Neukirchen, Joyce Chang, Marianne Lake, Jennifer Piepszak, Lori Beer, Derek Waldron, and Judy Miller—the Institute has had the resources and support to pioneer a new approach to contribute to global economic analysis and insight.
Bartik, Alexander, Marianne Bertrand, Zoe Cullen, Edward L. Glaeser, Michael Luca, and Christopher Stanton. 2020. "How are Small Businesses Adjusting to COVID-19? Early Evidence from a Survey." National Bureau of Economic Research.
Fairlie, Robert W. 2020a. “The Impact of Covid-19 on Small Business Owners: Evidence of Early-Stage Losses From the April 2020 Current Population Sruvey.” National Bureau of Economic Research Working Paper 27309.
Fairlie, Robert W. 2020b. “The Impact of Covid-19 on Small Business Owners: The First Three Months after Social-Distancing Restrictions.” National Bureau of Economic Research Working Paper 27462.
Farrell, Diana, and Christopher Wheat. 2018. “Bend Don’t Break: Small Business Financial Resilience After Hurricanes Harvey and Irma.” JPMorgan Chase Institute.
Farrell, Diana, Chris Wheat, and Chi Mac. 2020a. “Small Business Financial Outcomes during the Onset of COVID-19.” JPMorgan Chase Institute.
Farrell, Diana, Chris Wheat, and Chi Mac. 2020b. “Small Business Owner Race, Liquidity, and Survival.” JPMorgan Chase Institute.
Farrell, Diana, Chris Wheat, and Chi Mac. 2020c. “Small Business Financial Outcomes during the COVID-19 Pandemic.” JPMorgan Chase Institute.
U.S. Census Bureau. 2020. Small Busienss Pulse Survey. https://portal.census.gov/pulse/data/
Data from the U.S. Census Bureau’s Small Business Pulse Survey, which covers employer businesses, suggest that the amount of cash on hand has increased since April 2020. For example, during the week of October 4, 2020, 26.9 percent of small businesses reported having cash on hand sufficient for more than three months of business operations, compared to 16.7 percent during the week of April 26th
Data from the Opportunity Insights Economic Tracker suggest that total small business revenue decreased 22.8 percent on September 25, 2020 as compared to January 2020.
Specifically, the Paychex Small Business Jobs Index declined from 98.22 in September 2019 to 94.44 in September 2020—a decline of 3.8 percent. Over the same time period, data from the ADP National Employment Report show a decline in employment decline of 6.2 percent among firms with less than 50 employees.
Authors

Diana Farrell
Founding and Former President & CEO

Chris Wheat
President, JPMorganChase Institute

Chi Mac
Business Research Director

Bryan Kim
Research Engineer, JPMorgan Chase Institute