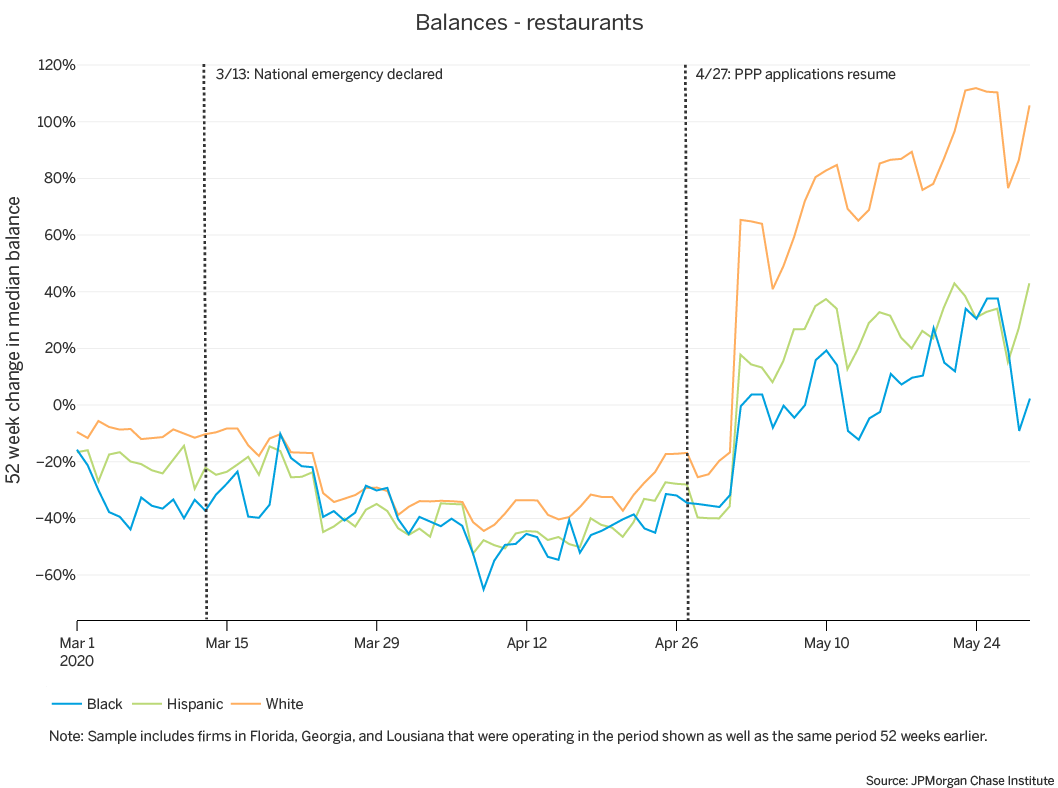
Figure 1: Cash balances of White-owned restaurants doubled in May, compared to a 38 percent increase for Black-owned restaurant
The COVID-19 pandemic has profoundly affected the small business sector. A previous JPMC Institute report provided estimates of the impact during the initial weeks after a national emergency was declared on March 13, 2020 and as many states issued stay-at-home orders that restricted many businesses (Farrell, Wheat, and Mac 2020a). Firms adjusted their operations not only in light of these restrictions but also as consumers cut their spending (Farrell, Greig, et al. 2020a) and shifted some of it online (Farrell, Wheat, et al. 2020). Some businesses temporarily closed (Bartik, et al. 2020). While cash balances rebounded, bolstered by pandemic-related relief programs, revenues in May remained materially lower than they were a year ago.
This report provides a closer look at the small businesses affected by COVID-19 and the ensuing economic downturn, focusing on the industries where Black- and Hispanic-owned firms are overrepresented (personal services, repair and maintenance, and construction) as well as the industries that have been hardest hit. Prior research identified the restaurant, retail, and personal services industries as the most severely affected at the onset of COVID-19 (Farrell, Wheat, and Mac 2020a). The financial impact across the sector and especially in these industries may have been especially impactful for Black- and Hispanic-owned businesses. These businesses are more financially fragile, with lower revenues and less cash liquidity than White-owned firms (Farrell, Wheat, and Mac 2020b). Accordingly, they may have been more vulnerable to adverse shocks, especially if they were also operating in industries that were severely impacted.
We examine changes in small business cash balances, revenues, and expenses through May 2020 using a de-identified sample of nearly 1.3 million small firms nationwide. This sample is based on the anonymized transactions of deposit accounts1 and represents both nonemployer and employer firms, mostly in urban areas. The vast majority—over 80 percent—of small businesses are nonemployers2,which is reflected in our sample. In addition, we used a de-identified sample of small firms matched to owner race data obtained from publicly available voter registration records. (See Farrell, Greig, et al. (2020b) for details about the matching algorithm.) Out of the states in which race/ethnicity data is collected in voter registration records, Chase had a footprint in three as of 2018: Florida, Georgia, and Louisiana. For this subset of 92,000 small businesses in those three states, we can provide insight on the differential impact of COVID-19 on White-, Black-, and Hispanic-owned small businesses.3
Together, cash balances, revenues, and expenses provide a summary of small business financial health. Balances provide the liquidity firms need, especially when they experience an adverse shock. Operating cash flows—revenues and expenses—indicate the amount of business activity, which may be reflected in cash balances. However, cash balances are not simply the result of net changes in revenues and expenses: business owners may also transfer personal assets or secure other financing to replenish their balances. Our estimates of operating cash flows do not include these types of financial transfers.4 Our revenue estimates also exclude transactions that appear to be CARES Act stimulus payments,5 Economic Injury Disaster Loan (EIDL) advances, or Paycheck Protection Program (PPP) loan proceeds.6However, all inflows and outflows are reflected in balances.
We examined these financial health measures for all firms in our sample through May 2020, focusing on industries in which Black- and Hispanic-owned firms are overrepresented and industries where the impact of COVID-19 has been particularly severe. In particular, we found:
Based on administrative data from bank accounts, our findings complement studies based on survey data7 and provide additional insights. In particular, we provide estimates of the effect of the pandemic on small business financial outcomes. It is not surprising that small businesses are enduring hardship, but these data quantify the magnitude and variation of the effects and inform policymakers of the industries and demographic groups which were more deeply impacted. For these small businesses, recovery may be even more challenging than it already is.
In the current economic downturn, many policymakers are concerned that Black- and Hispanic-owned firms are especially vulnerable, particularly to the extent that they are overrepresented in some severely affected industries. The differences by owner race within an industry can be seen in their respective cash balances relative to the same period a year ago. Despite lower revenue levels among Black- and Hispanic-owned firms in the same industry (Farrell, Wheat, and Mac 2020b), we do not find that changes in the median revenue varied meaningfully by owner race within the same industry during this period. That is, the differential changes in revenues by owner race during this downturn appear to be driven by differences in the industry distribution by owner race.
The combination of irregular cash flows among small businesses generally (Farrell, Wheat, and Mac 2018), relatively small within-industry sample of firms with owner race data, and short time frame through the end of May 2020, could be concealing trends that may be more evident in a larger sample or over a longer period. In Findings 1 and 2, we show changes in balances for small businesses in the three states for which we have owner race data. We show changes in revenues and expenses for the national sample in order to leverage a larger set of high-frequency transactions.
As a particularly visible industry in the small business sector, the impact of COVID-19 on restaurants has drawn considerable attention. At the onset of the pandemic, cash balances fell the most among restaurants as compared to other industries, falling over 40 percent in mid-April as compared to balances a year prior, with substantial declines in revenues as well (Farrell, Wheat, and Mac 2020a). Cash balances and revenues are important not only because they are a critical correlates of small business performance, but also because they vary significantly by owner race. Specifically, in the years prior to the current pandemic, Black- and Hispanic-owned businesses had significantly less cash liquidity and lower revenues than their White-owned counterparts (Farrell, Wheat, and Mac 2020b). With this background in mind, we examined differences in cash balance trajectories among Black-, Hispanic-, and White-owned businesses in the restaurant industry.
Figure 1: Cash balances of White-owned restaurants doubled in May, compared to a 38 percent increase for Black-owned restaurant

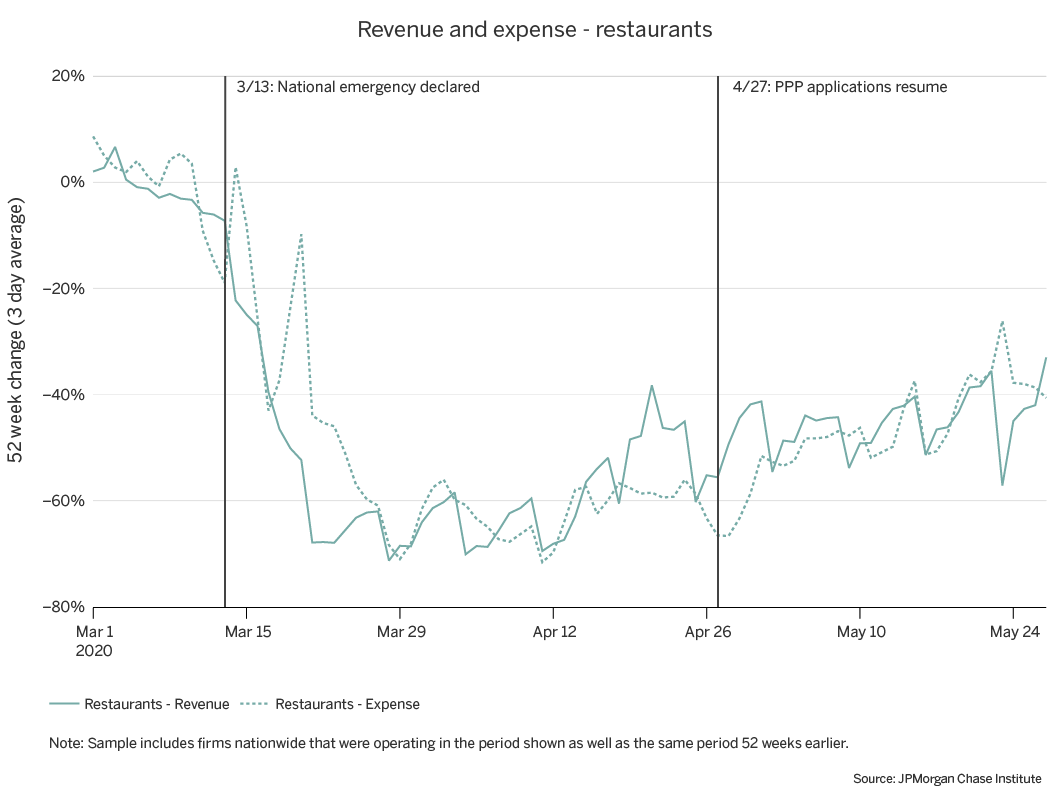
The top panel of Figure 1 shows that median balances declined in March and early April. The typical balance for a Black-owned restaurant declined by more than 60 percent, relative to last year, compared to 44 percent for a White-owned restaurant. In mid-April, balances increased, which may reflect not only improving business conditions but also inflows related to pandemic-related relief efforts, including CARES Act stimulus payments. At the beginning of May, median balances increased dramatically, potentially driven by inflows such as PPP loan funds. This increase was considerably larger for the typical White-owned restaurant than the typical Black- or Hispanic-owned restaurant. By late May, median balances for White-owned restaurants were about 100 percent higher than the previous year, compared to less than 40 percent higher for Hispanic- and Black-owned restaurants. Median restaurant revenues declined in March and started improving in the latter half of April. However, at the end of May, typical revenues were still 37 percent below their values in the prior year.
While this report uses outcomes in the prior year as the relevant comparison to identify the effects of COVID-19 on small business financial health, we previously found that Black- and Hispanic-owned businesses were more financially fragile in the years preceding the current economic downturn. They generated lower revenues and held less cash liquidity than their White-owned counterparts, and these two factors contribute significantly to a firm’s ability to survive (Farrell, Wheat, and Mac 2020b). As small businesses rebuild and recover, Black- and Hispanic-owned firms will need to do more than just return to their prior financial situation if they are to survive and thrive. Further research is needed to evaluate the longer-term impact of the pandemic on Black- and Hispanic-owned businesses.
While the composition of the restaurant industry is largely comparable to the composition of the small business sector in terms of owner race, Black- and Hispanic-owned businesses are especially concentrated in some industries, several of which were also strongly impacted at the onset of the COVID-19 pandemic. Specifically, Black-owned firms are overrepresented in the personal services industry, Hispanic-owned firms are overrepresented in the construction industry, and both are overrepresented in repair and maintenance (McManus 2016; Farrell, Wheat, and Mac 2020b). Personal services, which includes salons and dry cleaners, includes many businesses that were restricted from operating during the public health emergency. The effects of these restrictions are apparent in balances and revenues. With revenue declines of over 80 percent in mid-April, personal services experienced the greatest losses among all industries (Farrell, Wheat, and Mac 2020a). With this in mind, we first explore differences in cash balance trajectories by owner race within the personal services industry.
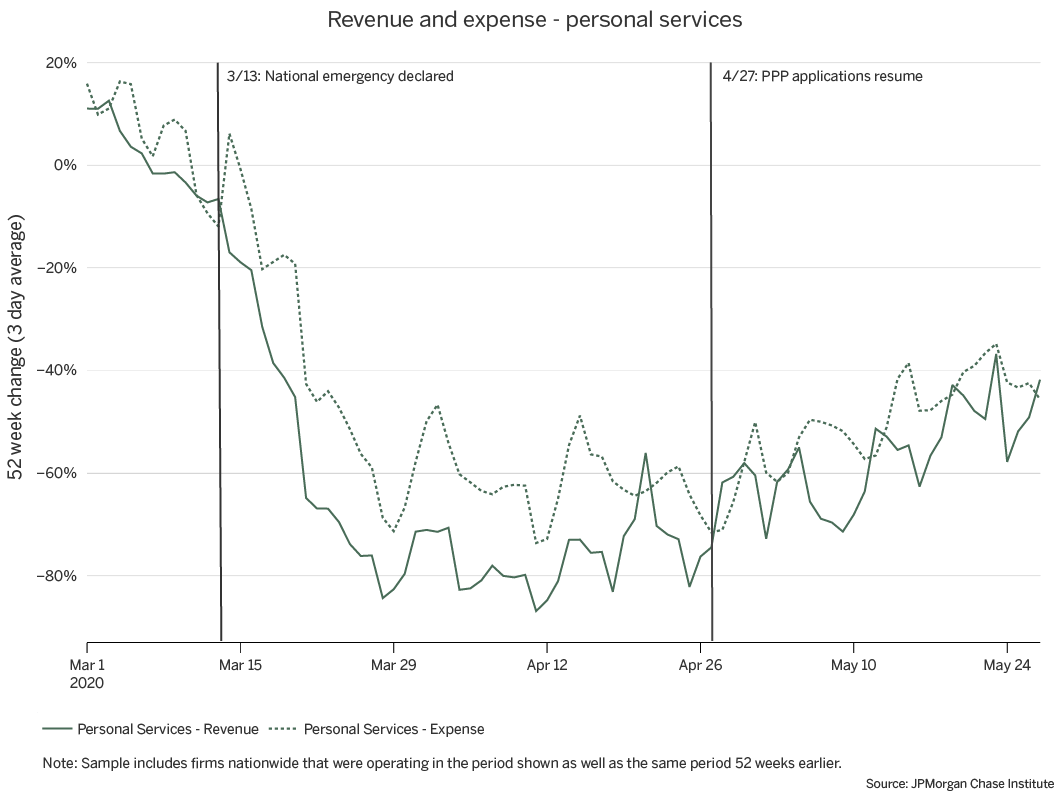
Figure 2: Cash balances of Black-owned personal services increased by 62 percent in May, but increased by less than 25 percent among Hispanic- and White-owned firms
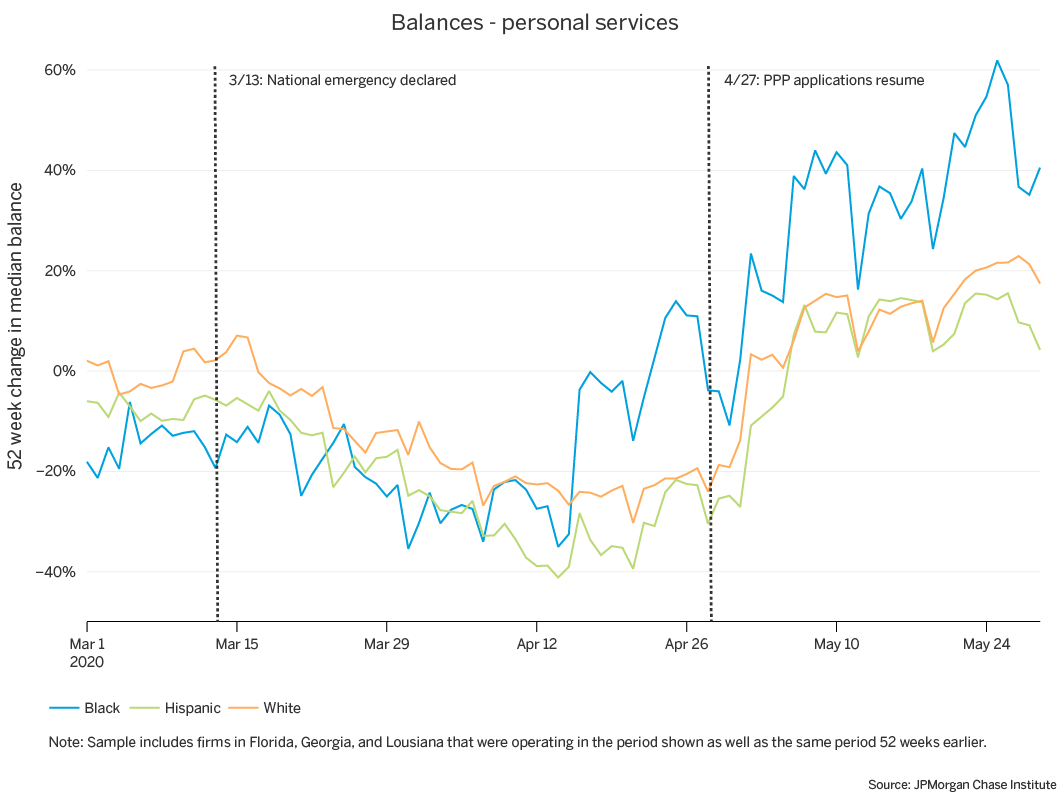
The top panel of Figure 2 shows the changes to a typical firm’s balance when compared to the same period in the prior year. There was a sharp decline in balances until mid-April, particularly for Hispanic-owned personal service firms, where balances in April were over 40 percent lower than they were a year ago. Shortly thereafter, balances increased, coinciding with the beginning of the arrival of CARES Act stimulus payments, followed by loan proceeds from the second round of PPP.
These balance changes were particularly dramatic for Black-owned personal services firms, which typically have less cash liquidity than White-owned firms (Farrell, Wheat, and Mac 2020b). Because the change is based on the prior year’s levels, inflows of a fixed amount—such as a $1,200 stimulus payment—would increase smaller balances by a larger percentage. In addition, because of income limits for stimulus recipients and lower incomes of Black and Hispanic families (Farrell, Greig, et al. 2020b), a larger share of Black- and Hispanic-owned firms could have received this inflow. While this relief was targeted towards individuals and not firms, it does appear to have bolstered the balances of small businesses.
The bottom panel of Figure 2 puts these balance changes in context by showing the progression of revenues and expenses for the overall sample of personal services firms. Revenues for these firms declined precipitously in March and remained depressed in April, with revenues declining by more than 80 percent. Expenses also decreased but not by the same magnitude until April and May, which would have contributed to stabilizing balances. While revenues have improved, at the end of May they were nevertheless over 40 percent lower than they were a year ago.
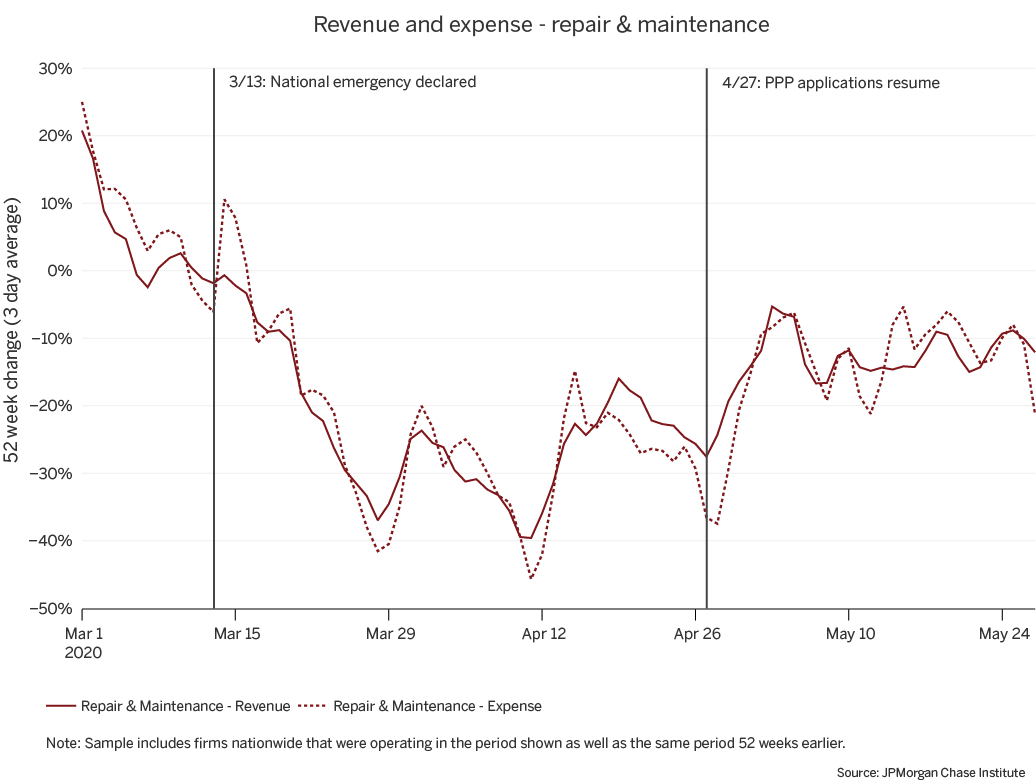
Figure 3: Cash balances of Black-owned repair and maintenance firms increased by as much as 56 percent in May, as compared to less than 40 percent among Hispanic- and White-owned firms
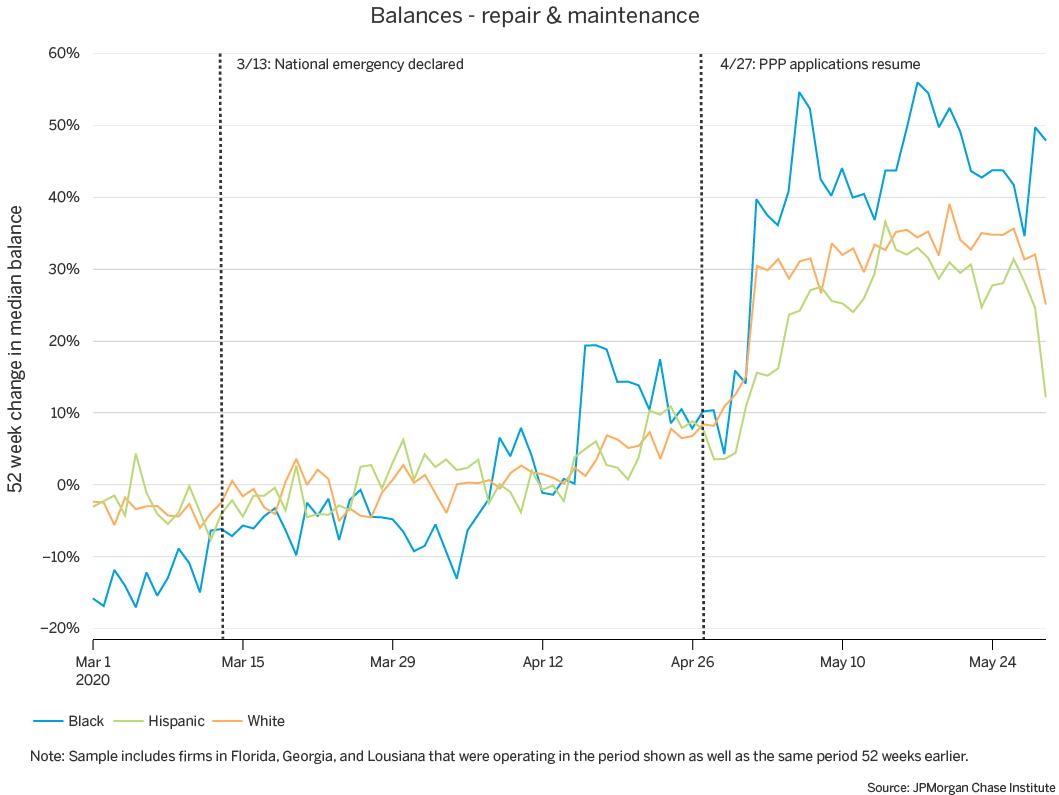
Both Black and Hispanic business owners are overrepresented in the repair and maintenance industry (Farrell, Wheat, and Mac 2020b). While functions in repair and maintenance were deemed essential in some localities,8 firms in this industry likely faced lower demand for their services as consumers reduced their spending or refrained from nonessential in-person contact. Perhaps as a result, while cash balances in the industry dropped substantially, balances for these firms did not fall as low as those for restaurants or personal services firms (Farrell, Wheat, and Mac 2020a). However, given the overall lower levels of cash liquidity among Black- and Hispanic-owned businesses and the concentration of Black- and Hispanic-owned businesses in the industry, we explored differences in cash balances by owner race among these firms.
The top panel of Figure 3 shows the change in median balances for firms in the repair and maintenance industry by owner race. In mid-April, balances of Black-owned repair and maintenance firms increased materially before moderating. This coincided with the beginning of CARES Act stimulus payments. As noted earlier, percentage increases among Black-owned firms may be larger because their prior year balances were lower than those of White-owned firms and because more Black business owners may have received these payments. In May, balances once again increased noticeably, coinciding with the beginning of the second round of PPP. At certain points, the magnitude of the increase was larger for Black-owned firms, but those increases do not persist for long, quickly dropping to magnitudes similar to those of White-owned firms. The balance changes for Black-owned firms were more volatile, perhaps due to lower initial balances. However, it is encouraging that even at the lower points in May, balance growth for Black-owned firms was of a similar magnitude as their White-owned counterparts.
The bottom panel of Figure 3 shows revenues and expenses for all firms in the industry. Revenue declines were paired with decreases in expenses of a similar magnitude. In the month after the national emergency declaration, balances of typical firms in this industry were somewhat lower than they were at the same time in the prior year but more stable than in the restaurant or personal services industries. Nevertheless, they experienced large declines in revenues. However, the decreases in revenues were matched by similar decreases in expenses. In other industries, firms initially did not cut expenses by the same magnitude as the decrease in revenues.
Figure 4: Balance growth in the construction industry did not vary meaningfully by owner race
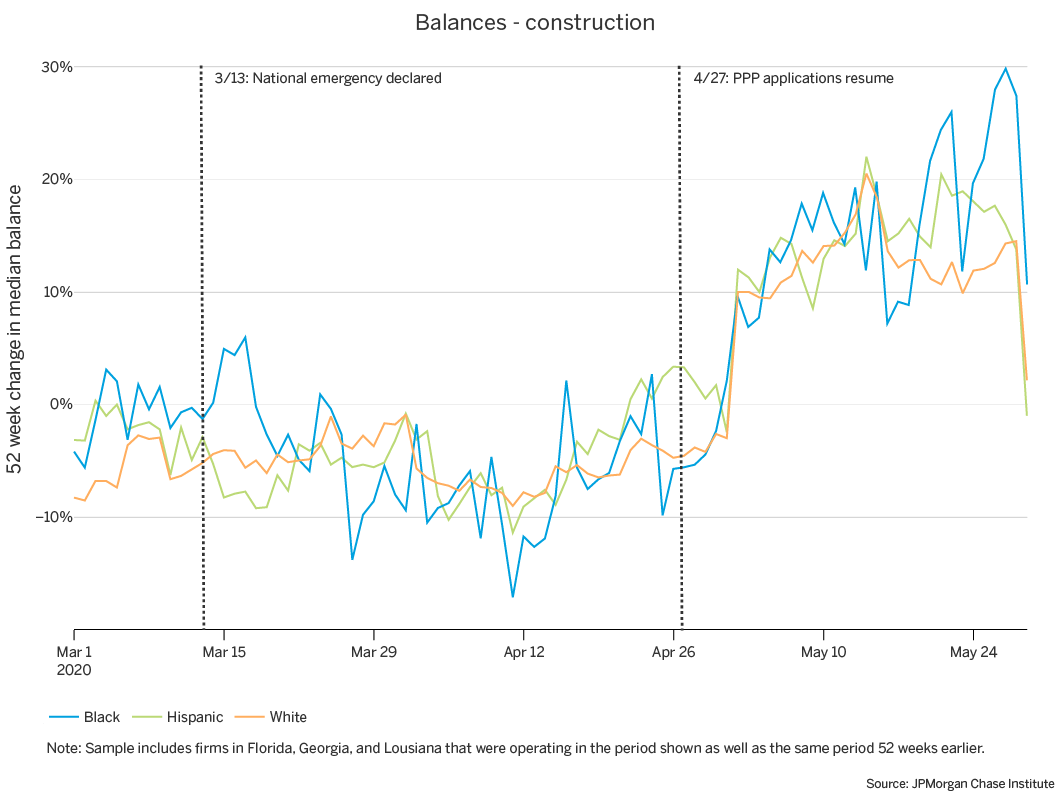
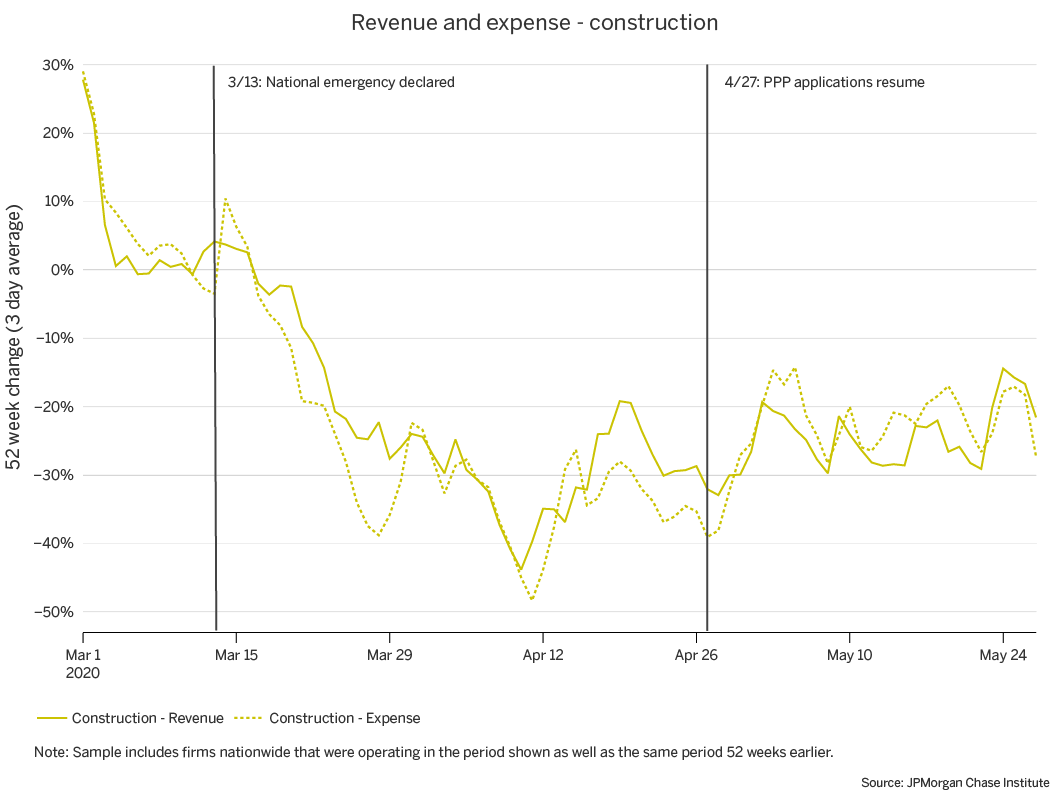
Finally, Hispanic-owned firms are overrepresented in the construction (Farrell, Wheat, and Mac 2020b), an industry which experienced balance decreases of the same magnitude as the median firm across all industries (Farrell, Wheat, and Mac 2020a). The top panel of Figure 4 shows that, among construction firms, the recovery in cash balances has been similar across owner races. However, Hispanic-owned construction firms saw a somewhat larger increase in median balances in mid-April than their White-owned counterparts, coinciding with the beginning of CARES Act stimulus payments. For Black-owned construction firms, the changes to balances were relatively more volatile. The bottom panel of Figure 4 shows that, like firms in repair and maintenance, small businesses in construction were able to reduce expenses to match their decreased revenue streams in the overall sample, mitigating the effect on balances. At the end of May, revenues for a typical construction firm were more than 20 percent lower than they were a year ago.
In industries where they are overrepresented, Black- and Hispanic-owned businesses have experienced balance growth that is similar or greater than that of White-owned businesses. However, these changes were measured relative to their values a year ago, when Black- and Hispanic-owned firms typically had lower revenues and lower cash reserves than their White-owned counterparts. Returning to similar prior circumstances is a start, but programs to aid small business recovery should also consider opportunities for Black- and Hispanic-owned firms to achieve the scale that will help them weather future shocks.
Revenues at grocery stores grew while other retailers experienced declines in revenues.
Although the effects of COVID-19 were global in scope, the severity of its impact on small business finances varied depending on industry. State and local policies often severely restricted or closed certain businesses, while simultaneously deeming other businesses essential. Firms that continued operating nevertheless modified their business models in response to restrictions to capacity as well as changes in demand for their goods and services.
In prior research we noted that retail, restaurants, and personal services were among the industries that were most severely impacted at the onset of COVID-19 (Farrell, Wheat, and Mac 2020a). However, an industry may consist of different segments, some of which fared relatively better than others during this period. For these three industries, we provide additional granularity about small business financial outcomes during the continuing public health emergency. A disaggregated view of financial outcomes within broader industry categories provides further insight about the small businesses that may need the most assistance in recovery efforts.
Figure 5: Unlike other retailers, grocery stores experienced positive revenue growth
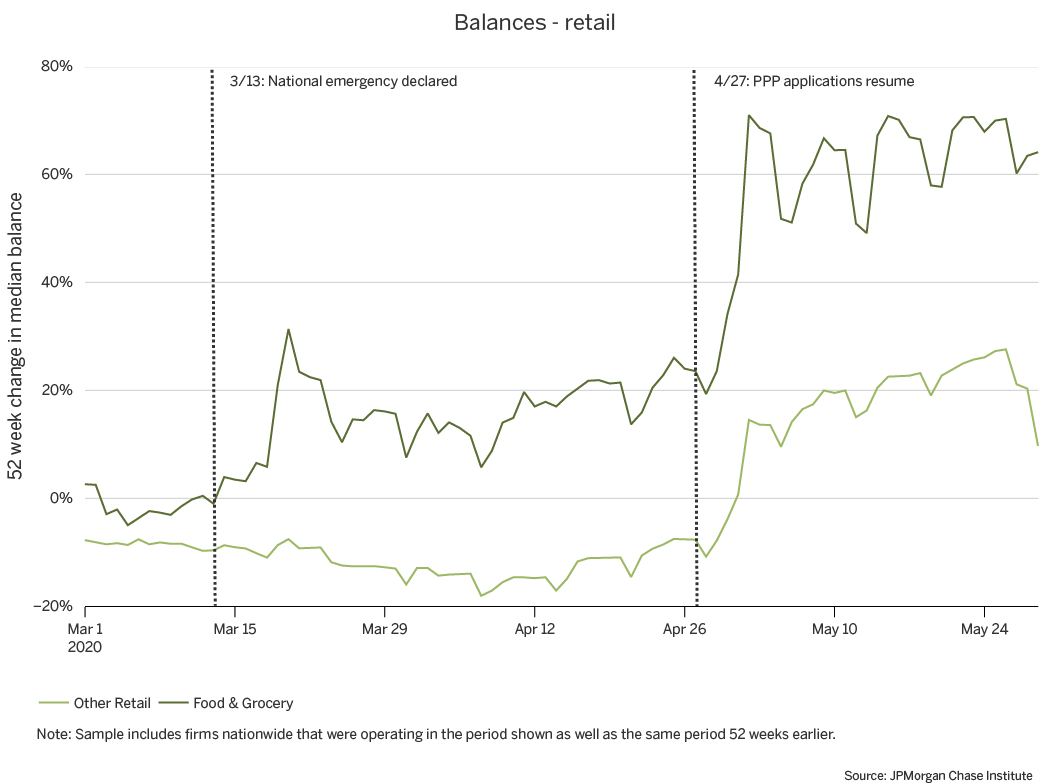
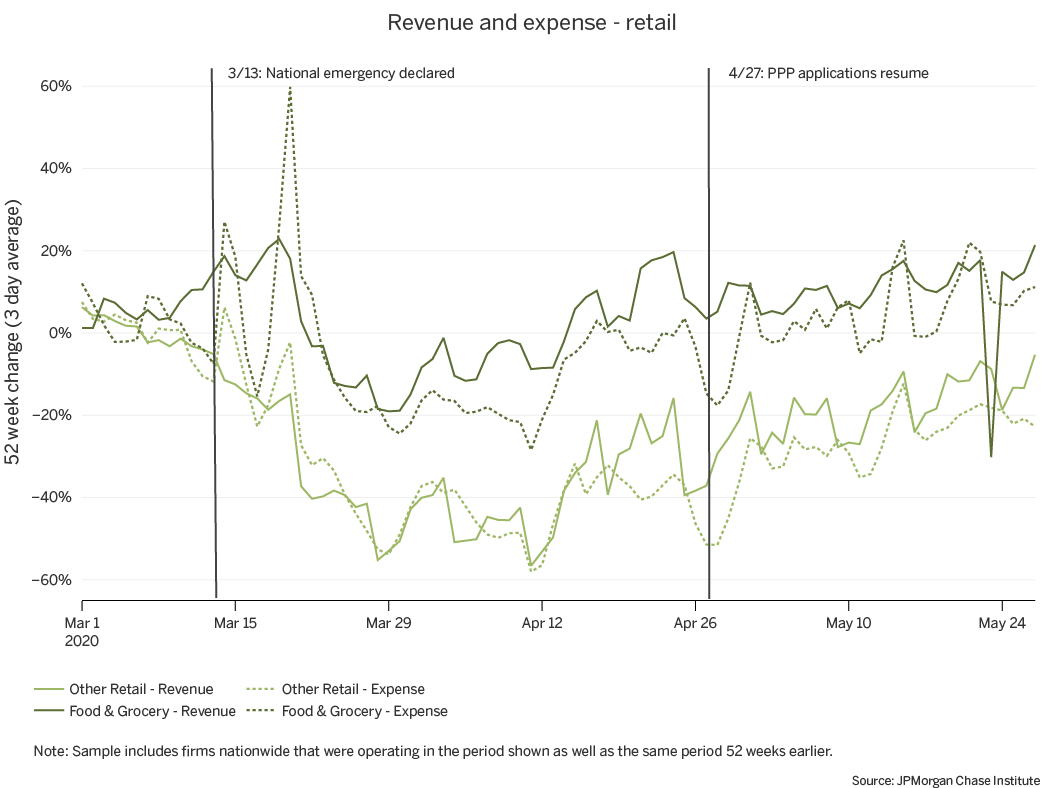
The retail industry was particularly hard hit by the effects of COVID-19 related restrictions and shifts in consumer behavior (Farrell, Wheat, and Mac 2020a). However, certain segments of the retail industry were considered essential and allowed to operate with minor modifications, while other retail stores were ordered to severely curtail or even completely discontinue in-person trading. Grocers, which account for about 10 percent of our sample of retail firms, are a notable example of businesses that were considered essential in every locality.
The top panel of Figure 5 shows that median balances were higher for grocers than other retail firms. However, there was a noticeable increase in median balance growth as funding from various relief programs (e.g. PPP Loans) were deposited. In fact, the consistent trend of balance contractions throughout March and April 2020 was reversed in May for non-grocery retail firms.Grocers experienced even stronger growth in balances following the influx of funds, going from typical balances that were 34 percent higher than usual in the end of April, to balances that were 64 percent higher than usual by the end of May.
The bottom panel of Figure 5 shows that after the national emergency declaration, grocers continued to experience positive growth in their revenues, while other retail firms faced contractions in their revenue streams, relative to the prior year. By the end of May, grocers continued to experience strong revenue growth, with typical revenues 21 percent higher than they were a year ago. In contrast, despite subtle improvements in revenue contraction rates, other retail firms still had revenues 5 percent below their values from the prior year. One notable exception in grocery revenues is May 23, 2020, in which median revenue dropped by 30 percent. One potential explanation for this anomaly is the timing: spending at grocery stores just before Memorial Day this year was much lower than it was at the same time last year.
Figure 6: Limited-service restaurants experienced less severe declines
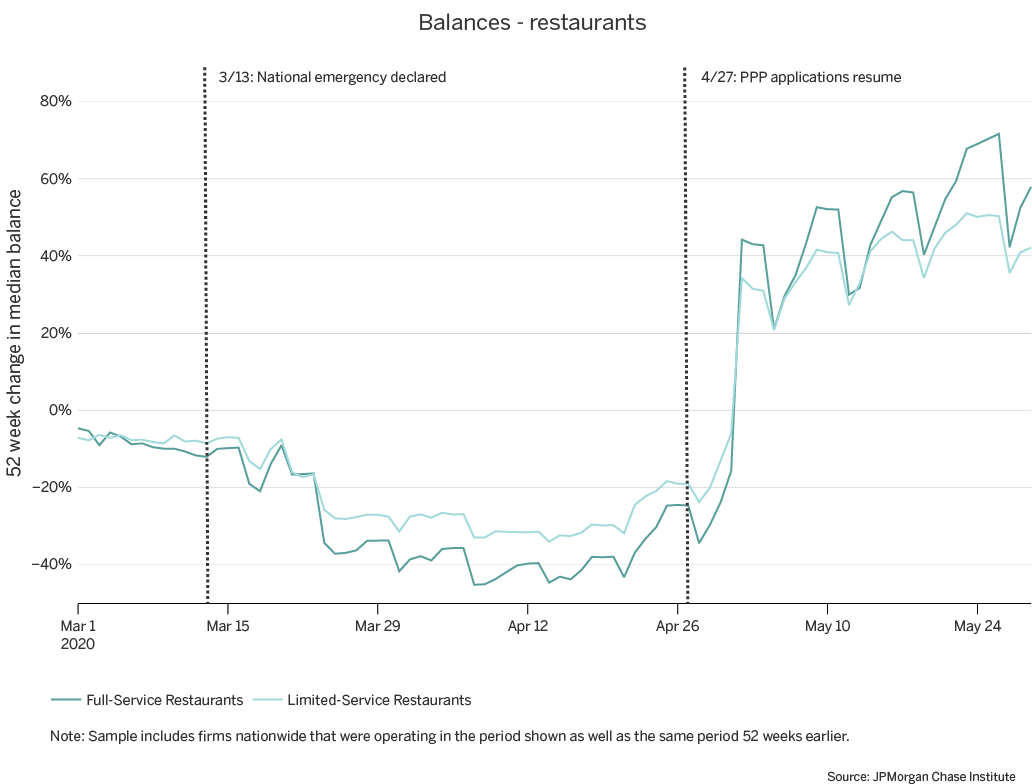
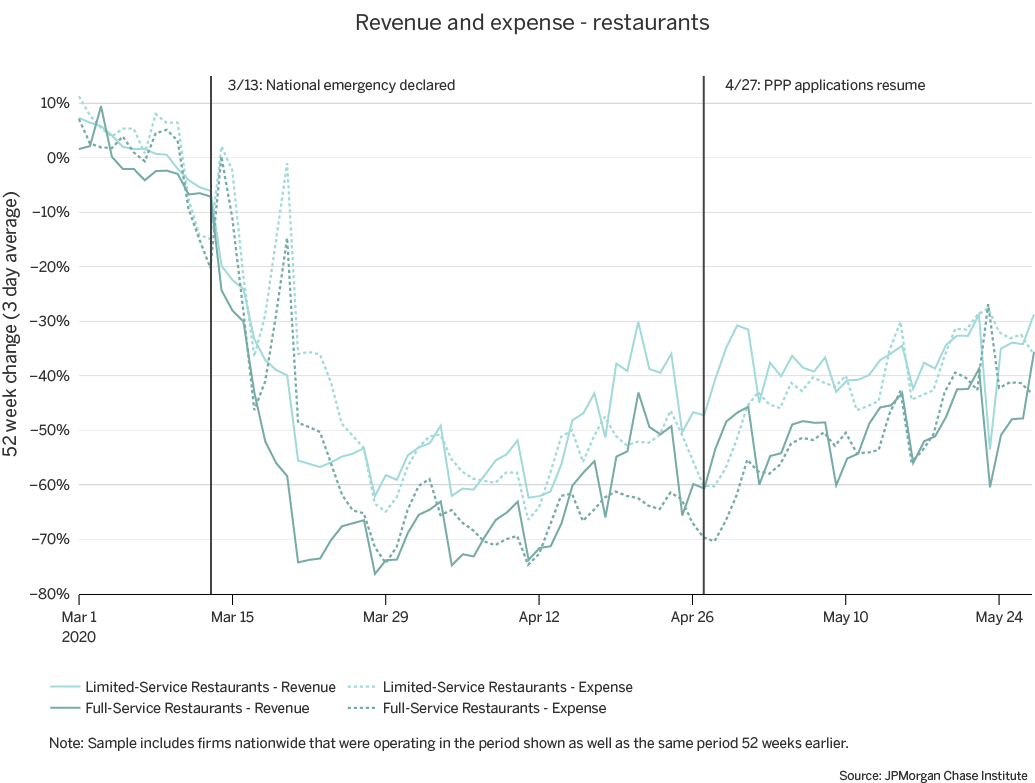
Prior research showed that the restaurant industry also experienced strong disruptions to their finances due to COVID-19 (Farrell, Wheat, and Mac 2020a). In the bottom panel of Figure 6, we observe that both full-service (56 percent of the sample) and limited-service (44 percent of the sample) restaurants experienced sharp contractions to their revenue streams following the declaration of a national emergency. Notably, limited-service restaurants consistently experienced slightly milder revenue contractions in comparison to their full-service counterparts, with revenues down by 29 percent and 36 percent for limited-service and full-service restaurants, respectively, by the end of May. This slight difference may be driven by the ability of limited-service restaurants to transition to business models that require less face-to-face interaction (e.g. carryout or delivery).
For balances, however, full-service restaurants fared slightly better compared to limited-service restaurants starting in May. This may be driven by a larger proportion of full-service restaurants receiving PPP loans or receiving larger amounts in comparison to limited-service restaurants.
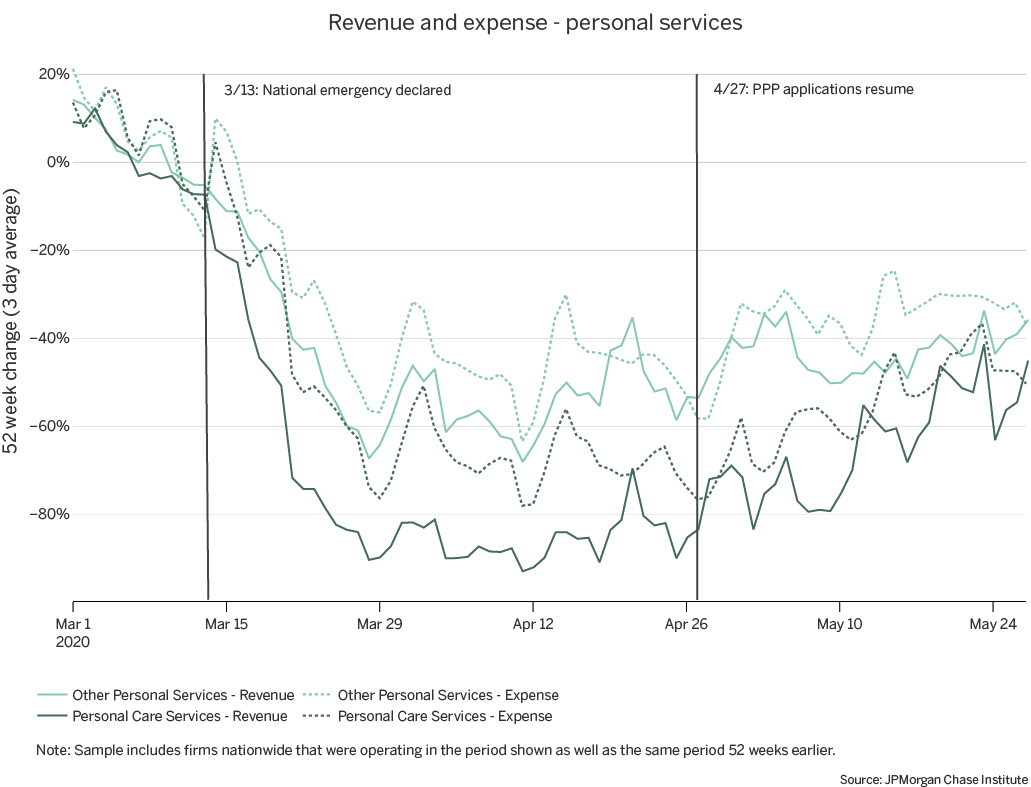
Figure 7: Personal care services fared worse in comparison to other personal services
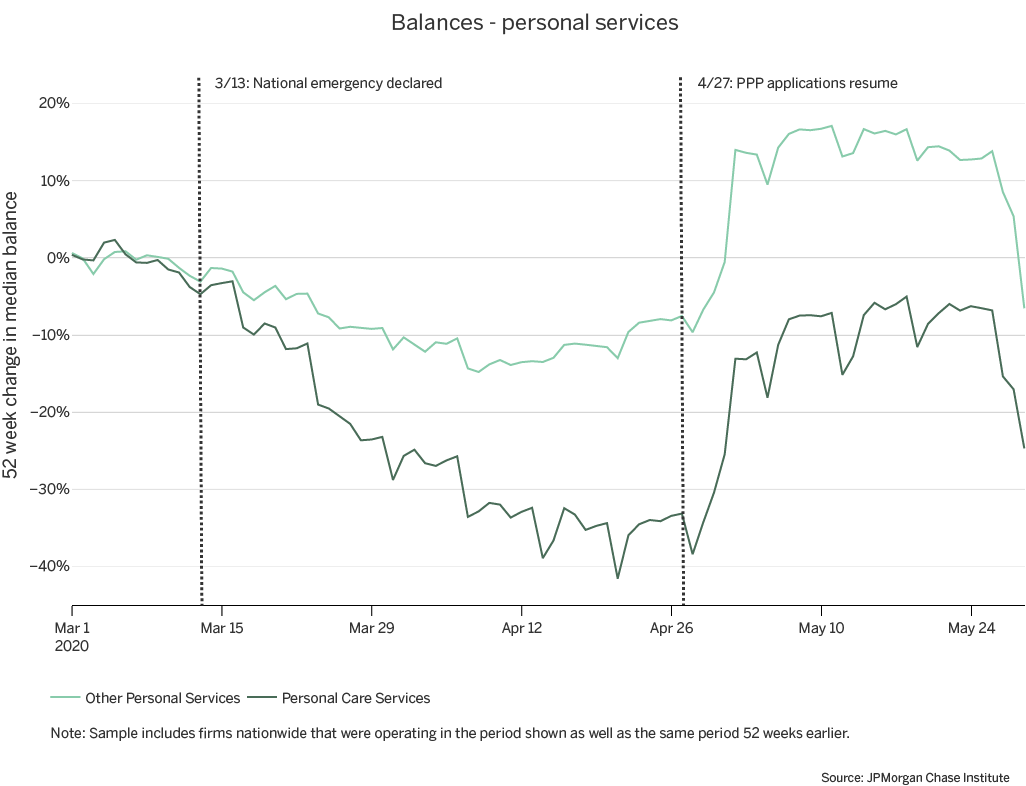
Similarly, personal care providers (e.g. salons) fared worse in comparison to providers of other personal services (e.g. laundries). The top panel of Figure 7 shows a stark gap between the balances personal care and other personal service providers. Both segments saw changes in balances that may be driven by an influx of funding from relief programs. However, for the typical personal care provider, these inflows were not sufficient to return balances to prior year levels. In contrast, other personal service providers largely experienced higher balances throughout May than they had a year ago.
In the bottom panel of Figure 7, revenue contractions for providers of other personal services (35 percent of the sample) were consistently milder than the revenue contractions experienced by personal care service providers (65 percent of the sample). Although this gap began to narrow in the latter half of May (potentially driven by phased re-openings, which allowed limited personal care services), the gap persisted. By the end of May, personal care service providers had revenues 45 percent lower than the prior year, while other personal service providers had revenues 36 percent lower than the prior year.
The distinct experiences of different segments within the same industry underscore the wide variation in effects on small businesses during this pandemic. For some firms, existing programs bolstered their cash balances, potentially allowing them to withstand continued weak revenues. For others, the inflows merely mitigated the decline in balances.
We provide a recent snapshot of small business financial outcomes during the COVID-19 pandemic using administrative banking data, focusing on industries that have been severely impacted or where Black and Hispanic business owners are overrepresented. Policies and programs providing relief to affected small businesses or support as they rebuild can use this research to target sectors that have been more adversely affected by the public health emergency. With these objectives in mind, we offer the following implications for leaders and decision makers:
We thank our research team, specifically Bryan Kim, Olivia Kim, and Anuradha Raghuram for their hard work and contributions to this research.
This effort would not have been possible without the critical support of our partners from the JPMorgan Chase Consumer & Community Bank and Corporate Technology Solutions teams of data experts, including Michael Aguilar, Kyung Cho-Miller, Anoop Deshpande, Andrew Goldberg, Melissa Goldman, Senthilkumar Gurusamy, Derek Jean-Baptiste, Brian Maddox, Albert Raymond, Anthony Ruiz, Subhankar Sarkar, Breann Zickafoose, and from our internal partners and JPMorgan Chase Institute team members including Haley Dorgan, Elizabeth Ellis, Alyssa Flaschner, Fiona Greig, Courtney Hacker, Chris Knouss, Sarah Kuehl, Sruthi Rao, Parita Shah, Tremayne Smith, Gena Stern, Nicholas Tremper, and Preeti Vaidya.
We would like to acknowledge Jamie Dimon, CEO of JPMorgan Chase & Co., for his vision and leadership in establishing the Institute and enabling the ongoing research agenda. Along with support from across the Firm—notably from Peter Scher, Max Neukirchen, Joyce Chang, Marianne Lake, Jennifer Piepszak, Lori Beer, Derek Waldron, and Judy Miller—the Institute has had the resources and support to pioneer a new approach to contribute to global economic analysis and insight.
Bartik, Alexander, Marianne Bertrand, Zoe Cullen, Edward L. Glaeser, Michael Luca, and Christopher Stanton. 2020. "How are Small Businesses Adjusting to COVID-19? Early Evidence from a Survey." National Bureau of Economic Research.
Farrell, Diana, Chris Wheat, and Chi Mac. 2020a. “Small Business Financial Outcomes during the Onset of COVID-19.” JPMorgan Chase Institute.
Farrell, Diana, Chris Wheat, and Chi Mac. 2020b. “Small Business Owner Race, Liquidity, and Survival.” JPMorgan Chase Institute.
Farrell, Diana, Chris Wheat, and Chi Mac. 2018. "Growth, Vitality, and Cash Flows: High-Frequency Evidence from 1 Million Small Businesses." JPMorgan Chase Institute,
Farrell, Diana, Fiona Greig, Natalie Cox, Peter Ganong, and Pascal Noel. 2020a. “The Initial Household Spending Response to COVID-19: Evidence from Credit Card Transactions.” JPMorgan Chase Institute.
Farrell, Diana, Fiona Greig, Chris Wheat, Max Liebeskind, Peter Ganong, Damon Jones, and Pascal Noel. 2020b. "Racial Gaps in Financial Outcomes: Big Data Evidence." JPMorgan Chase Institute.
McManus, Michael. 2016. "Minority Business Owners: Data from the 2012 Survey of Business Owners." SBA Issue Brief (202): 1-13.
Our sample is comprised of firms that hold Chase Business Banking deposit accounts and meet our criteria for small operating businesses in core metropolitan areas. These firms hold at most two business deposit accounts with combined balances not exceeding $20 million. They operate in one of the twelve industries that are characteristic of the small business sector: Construction, health care services, metals and machinery manufacturing, real estate, repair and maintenance, restaurants, retail, personal services (e.g. dry cleaning, beauty salons, etc.), other professional services (e.g. lawyers, accountants, consultants, marketing, media, and design), wholesalers, high-tech manufacturing, and high-tech services and show no evidence of operating in more than a single location or industry. They must also satisfy criteria indicating that they are operating businesses by having, in at least one consecutive 12 month period, three months with at least $500 in outflows and at least 10 transactions.
The U.S. Small Business Administration noted that in 2016, there were 30.7 million small businesses, 24.8 million of which had no employees. https://cdn.advocacy.sba.gov/wp-content/uploads/2019/09/24153946/Frequently-Asked-Questions-Small-Business-2019-1.pdf.
Farrell, Wheat, and Mac (2020b) includes analyses that compares our sample to available state and national benchmarks.
Financial transfers cannot always be distinguished from operating cash flows.
Although these payments were made to eligible individuals as opposed to firms, the majority of small businesses at large and in our sample are nonemployer firms. Pass-through entities, such as sole proprietorships, report net income on their owners’ tax returns. If those tax returns used the business’s direct deposit information, the stimulus payments would have been deposited into the business checking accounts.
These include loans processed by Chase as well as other banks and financial service providers.
For example, the U.S. Census Bureau’s Small Business Pulse Survey measures changes in business conditions during the pandemic. https://www.census.gov/data/experimental-data-products/small-business-pulse-survey.html.
For example, Miami-Dade County identified “contractors and other tradesmen, appliance repair personnel, exterminators, and other service providers who provide services that are necessary to maintaining the safety, sanitation, and essential operation of residences and other structures” as essential businesses: https://www.miamidade.gov/global/initiatives/coronavirus/emergency-orders/emergency-order-7-20.page
Authors

Diana Farrell
Founding and Former President & CEO

Chris Wheat
President, JPMorganChase Institute

Chi Mac
Business Research Director