

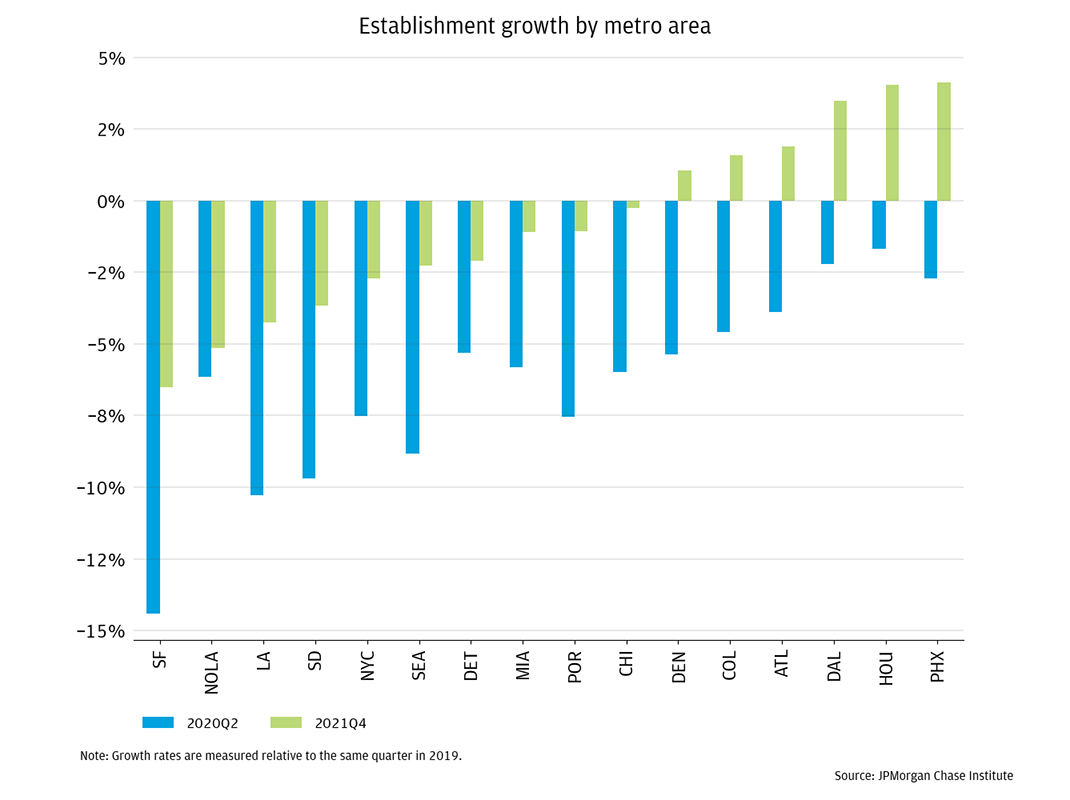
Figure 1: By Q4 2021, only six of the cities we track saw growth relative to their pre-pandemic levels
Latest news

An Ohio-based company is protecting first responders around the world
With support from JPMorganChase, Fire-Dex is providing protective equipment to firefighters in 100 countries and all 50 states.
Learn moreLatest news

Veteran’s Unconventional Path to Landing her Dream Job in Tech
U.S. Army Veteran Ashley Wigfall transitioned to a civilian role and charted her path to technologist through mentorship and skills training at the JPMorgan Chase tech hub in Plano, Texas.
Learn more
Nearly three years after its onset, work-from-home (WFH) technologies and their effects are one of the most important and enduring economic legacies of the COVID-19 pandemic (Barrero, et al., 2021). According to the U.S. Census Bureau, 27.6 million Americans reported primarily working from home in 2021, triple the size of that population in 2019.1 In response to this revolution in work and commuting patterns, high-income residents in primarily business services industries have moved from downtown to suburban neighborhoods and out of large, expensive cities (Ferreira & Wong, 2022; Ding & Hwang, 2022; Athloff, et al., 2022; Li & Su, 2022; Brueckner, et al., forthcoming; Ramani & Bloom, 2021). To date, most of the literature on the responding change in firm locations has focused on those whose workers have made the WFH transition. They find that these firms are also leaving downtown locations and substantially reducing the size of their commercial office space (Dalton & Groen, 2022; Rosenthal, et al., 2022; Gupta, et al., 2022).
Less well studied is the impact of WFH on the location decisions of brick-and-mortar establishments owned by retail firms. For retail establishments, exposure to WFH adoption happens more directly through changes to the location and behavior of their customer base, rather than through their workforce (which remains largely in-person). For instance, a substantial share of consumer shopping trips begin or end at home locations, leading many firms to locate near residential areas (Relihan, 2022; Farrell, et al., 2017). This may drive retail firms to similarly shift to where consumers have moved residency. In addition, consumers tend to chain visits to retail stores with their commutes (Miyauchi, et al., 2022). With fewer consumers commuting each day and commuting from different locations, traditional employment centers may be unable to support the same level of retail establishments. Furthermore, this retail activity may not simply move to residential locations if consumers who work from home make fewer and different trips—for instance, people who work at home can prepare their own lunches instead of visiting a local restaurant.2
This report provides the first detailed evidence on the changing locations of retail establishments due to the widespread adoption of WFH technologies. To do so, we build a novel dataset to track the entry and exit of retail establishments through Q4 2021 based on the credit and debit card activity at card terminals located in each establishment. With this dataset, we show that there is wide variation in the extent of the retail establishment recovery across space. We find that retail establishments have paralleled the exodus of populations from large, expensive cities in preference for smaller, Sun Belt cities and from city centers to suburbs. These effects counterbalance, such that the aggregate number of establishments is almost equal to its pre-pandemic baseline. In addition, we show that neighborhood exposure to the WFH shock is a key driver of the changing composition of retail establishments in downtown versus suburban areas, even controlling for neighborhood changes in population. This is likely due to the different shopping behaviors of those who work from home, such as reduced demand for clothing and personal care services.
Understanding the scale and nature of the effects of population growth and WFH on retail locations is important because these establishments account for a large portion of commercial space and economic activity. Prior to the pandemic, retail goods and services accounted for 29 percent of principal commercial building activities, compared to 16 percent for office.3 If establishments are changing in composition and location, then this will have important spillover effects to other sectors of the economy, including labor and housing markets. These effects also have implications for the production and consumption value of cities and the policy interventions, such as changes in land use regulations and tax codes, that may be necessary to support continued urban economic health.
We use transaction data from over 70 million Chase customers to identify brick-and-mortar establishments from Q1 2017 to Q2 2022. Our definition of an establishment is the unique combination of a merchant identifier (e.g. “Bob’s Restaurant #1234”), ZIP Code Tabulation Area (ZCTA), and product corresponding to a point of sale where in-person transactions take place. To ensure sufficient card activity to pinpoint the entry and exit of establishments, we limit our study of establishments to 16 major cities in which JPMorgan Chase has a significant customer base and make observations at a quarterly frequency.4 Our definition of a city is a Core-Based Statistical Area, which includes both the primary city and outlying suburbs.
We focus on a subset of everyday retail products that are well-captured by card transaction data. These include groceries, general goods, clothing, restaurants, home goods, leisure, personal care services, professional consumer services, and pharmacies. The following are non-exhaustive lists of examples for select product types: grocery stores include traditional grocers and specialty food stores. General goods include department stores, discount stores, and other retailers that sell everyday goods (e.g., florists or booksellers). Restaurants includes bars that sell food to be consumed on premises in addition to full-service and fast-food restaurants. Home goods includes furniture and home improvement stores. Personal care services includes salons, barbershops, and dry cleaners. Leisure includes venues like movie theaters, bowling alleys, and gyms. Professional consumer services includes veterinarians, tax preparation, and childcare.
Our establishment identification process defines activity for over 1.7 million establishments during our study period. We consider an establishment to be active in each quarter that we observe any transaction at that establishment, while we consider establishments to exist for all quarters inclusive of their first and last active quarters. For example, consider an establishment that is first active in Q3 2019, is active for the next two quarters before becoming inactive during a local shutdown in Q2 2020 and Q3 2020, and then is active again in Q4 2020 until Q2 2021. We identify the entry date for this establishment as Q3 2019 and its exit date as Q2 2021. For an external benchmark, we compare our results for establishment levels in 2019 and changes from 2018 to 2019 to the establishment survey conducted by the Census County Business Patterns and find them sufficiently consistent.
Interpretation of our establishment measure depends on several important features. The first is that we do not cover all establishments. Absent from this dataset are establishments with cash-only payments and those outside retail goods and services, such as in manufacturing and business services. The second is that establishments are distinct from firms. This can lead to a different pattern in entry and exits when the focus is establishments versus firms. For instance, a firm may close an establishment but still exist. A firm can also open and close establishments at the same time across a city leading us to measure entry and exits across space without any change in the number of firms.
We combine these data with information on consumer locations from the residential addresses reported by customers with at least 10 transactions in each reference month, changes in neighborhood spending offline and online derived from Chase card data, pre-pandemic neighborhood demographic data from the 2015-2019 American Community Survey (ACS), and residential and employment workforce data from the 2019 Longitudinal Employer-Household Dynamics Origin-Destination Employment Statistics (LODES). Data is merged by the ZCTA geography. Throughout the analysis we refer to ZCTAs as neighborhoods for ease of exposition.
Figure 1 shows that each city we track experienced precipitous declines in establishments followed by recoveries, though most cities remain below their pre-pandemic levels. Of the cities we track, San Francisco, Los Angeles, and San Diego saw the steepest initial decline and remain among the cities with the lowest growth rates. By Q4 2021, San Francisco still had 6.5 percent fewer establishments than it did in Q4 2019, while Los Angeles had 4.2 percent fewer, and San Diego had 3.7 percent fewer. Phoenix, Houston, and Dallas-Ft. Worth had the highest growth in establishments. By Q4 2021, Phoenix had 4.1 percent more establishments than it did in Q4 2019, Houston had 4.0 percent more, and Dallas-Ft. Worth had 3.5 percent more.
Figure 1: By Q4 2021, only six of the cities we track saw growth relative to their pre-pandemic levels
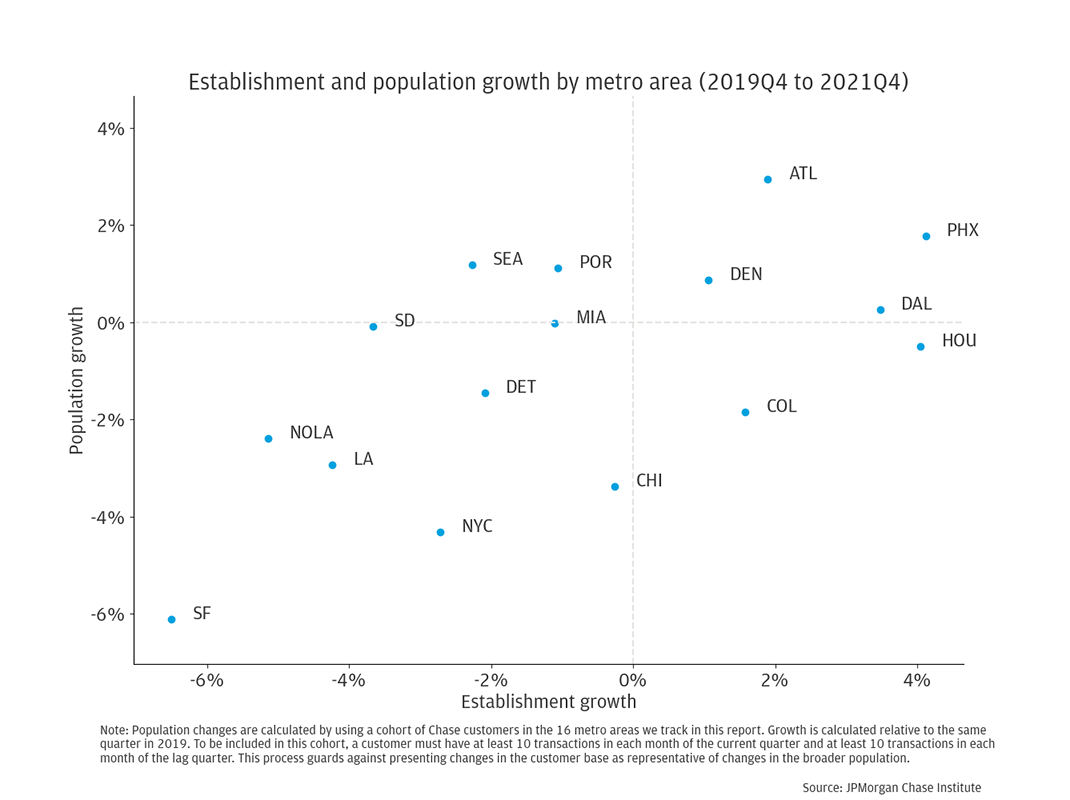
We find that this wide variation across cities in establishment recovery reflects population changes that happened during the pandemic. This relationship can be seen in the scatterplot in Figure 2. Cities such as San Francisco, Los Angeles, San Diego, and New York City experienced some of the largest declines in establishments in addition to large population declines. This is consistent with data from Bureau of Labor Statistics Business Employment Dynamics and Business Formation Statistics showing strong establishment growth in the Sun Belt and weak or negative growth in urban areas on the coasts (Decker & Haltiwanger, 2022). Outside this central pattern, New Orleans stands out as the city with the least evidence of pandemic recovery. Over two years, the city has only regained 1 percentage point of its initial 6.2 percent decline and has lost 2.4 percent of its population.
Figure 2: High-cost coastal metro areas have lost population and retail establishments while Sun Belt metro areas show gains
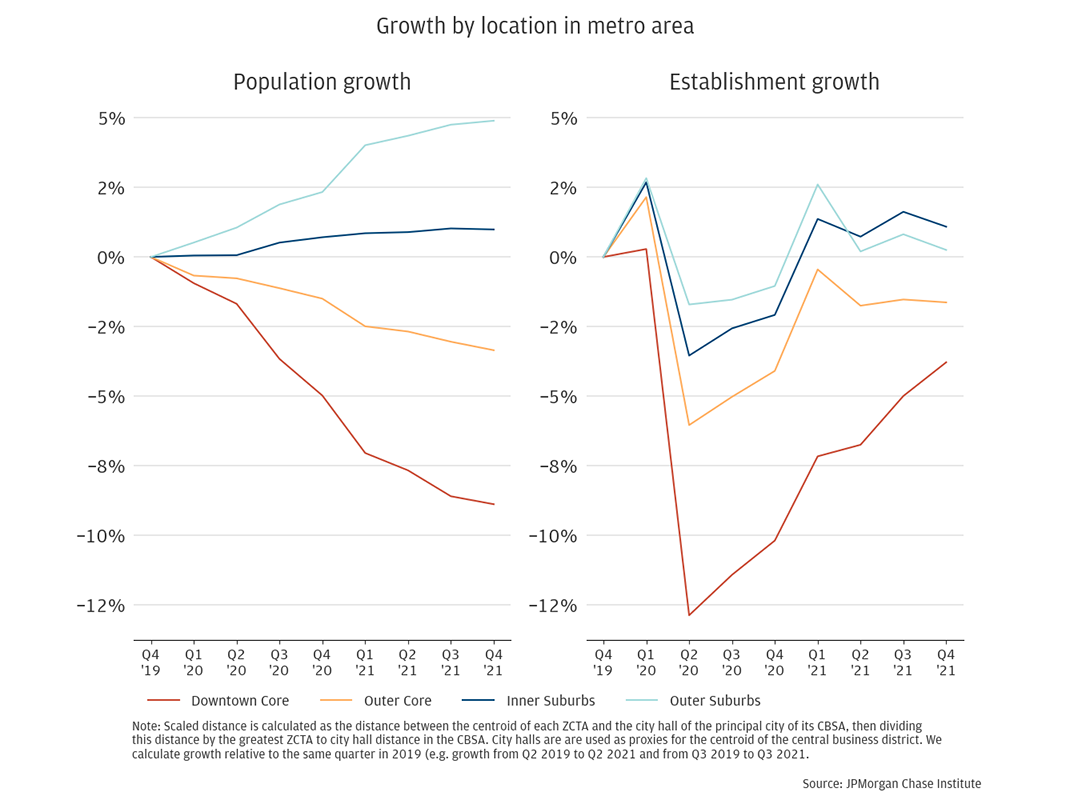
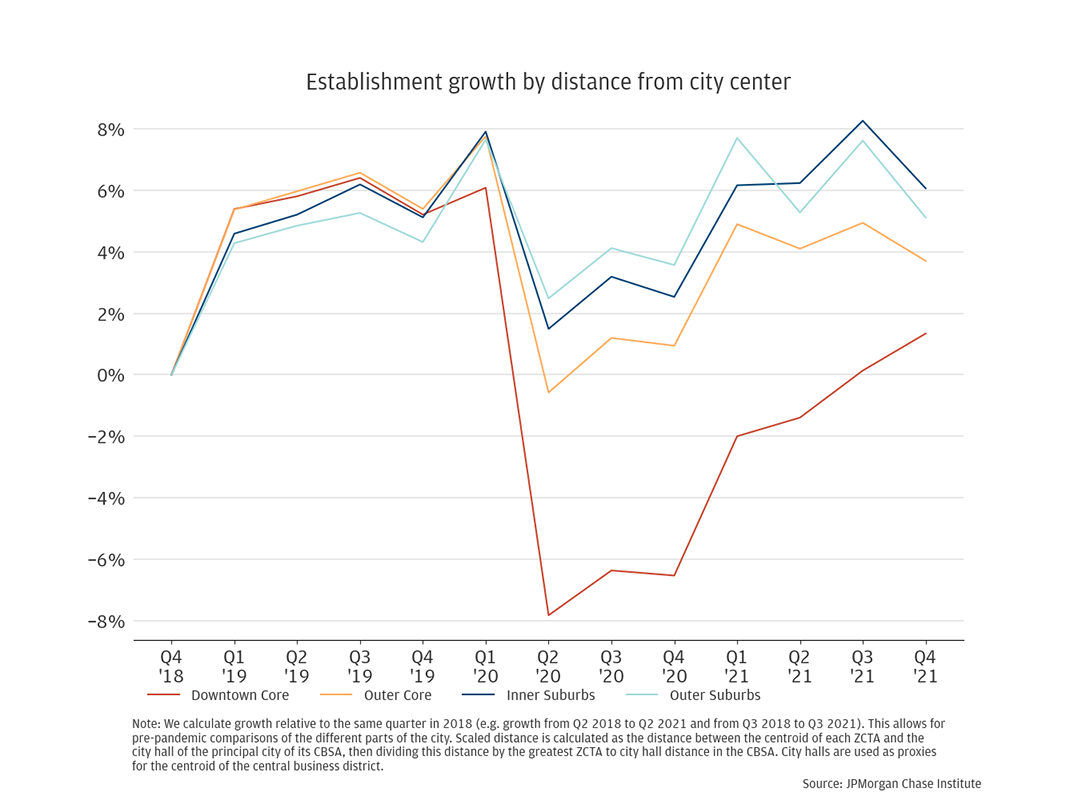
This correlation between population and establishment growth also holds within cities. To show this, we create a city-invariant distance scale, where the neighborhoods at city centers are located at distance 0.0 and the farthest neighborhoods in the city are located at distance 1.0. Then, we use locally weighted scatterplot smoothing to characterize average population and establishment growth across neighborhoods within cities from the downtown core to outer suburbs. Figure 3 shows the average growth effect at each point in the city as of Q2 2020 (the orange line) and Q4 2021 (the blue line) relative to Q4 2019. Figure 4 shows the average effect at distances of 0.0, 0.1, 0.4, and 0.8 for the full time series.5
Early pandemic conditions created different growth curves for populations and establishments within cities. This can be seen in the orange lines in the panels of Figure 3. At the start of the pandemic in Q2 2020, population declines in the downtown and outer core areas were modest. The shape of the growth curve across the city, in which population growth in the suburbs modestly outperforms the core, is still broadly consistent with patterns for the previous decades (Couture & Handbury, 2020). This is likely due to many of the customer moves out of the city in Q2 2020 initially being temporary and thus not reflected in our data.
However, early pandemic conditions immediately closed retail establishments permanently all across the city with greater declines toward the city center. For neighborhoods at the center, there is an average effect of 12.9 percent fewer establishments relative to Q2 2019. Moving marginally out of the city center to neighborhoods at a distance of just 0.1 dramatically reduces the negative effect to just 6.0 percent. From there, the gradient toward the outer areas of the city is much less steep. Neighborhoods farthest away from the center experienced just a 1.1 percent drop in establishments at the start of the pandemic.
There are important differences in these growth curves as of Q4 2021. The first noticeable feature is the dramatic rotation of the population curve. Neighborhoods at the city center and the start of the outer core show declines of 8.9 percent and 3.4 percent, respectively. Population growth at the starting points for the inner and outer suburbs, however, is robust at 1.0 percent and 4.9 percent, respectively, in the most recent data. The time series in Figure 4 shows that this pattern is the result of a continuous population shift from downtown to suburban areas over the previous two years. This shift is decelerating but continuing to grow through the most recent quarters.
In contrast, the time series for establishments is one of recovery after the initial shock, with a return to growth only in suburban areas as of the most recent data. Establishments at the city center still show substantial losses of 3.8 percent. Unlike for population, recent growth is most robust in the inner suburbs, though no higher than a 1.7 percent growth rate. This is a reversal from pre-pandemic trends, in which downtown areas of cities had the highest growth in establishments and growth everywhere was positive (see appendix Figure C1). The time series in Figure 4 shows downtown cores recovering establishments through 2021, while other areas of the city have maintained steady growth rates through each quarter of 2021. This suggests that the new suburban WFH population may only support a modest increase in suburban establishments.
Figure 3: Within cities, both residents and retail firms have shifted from downtown to suburban areas
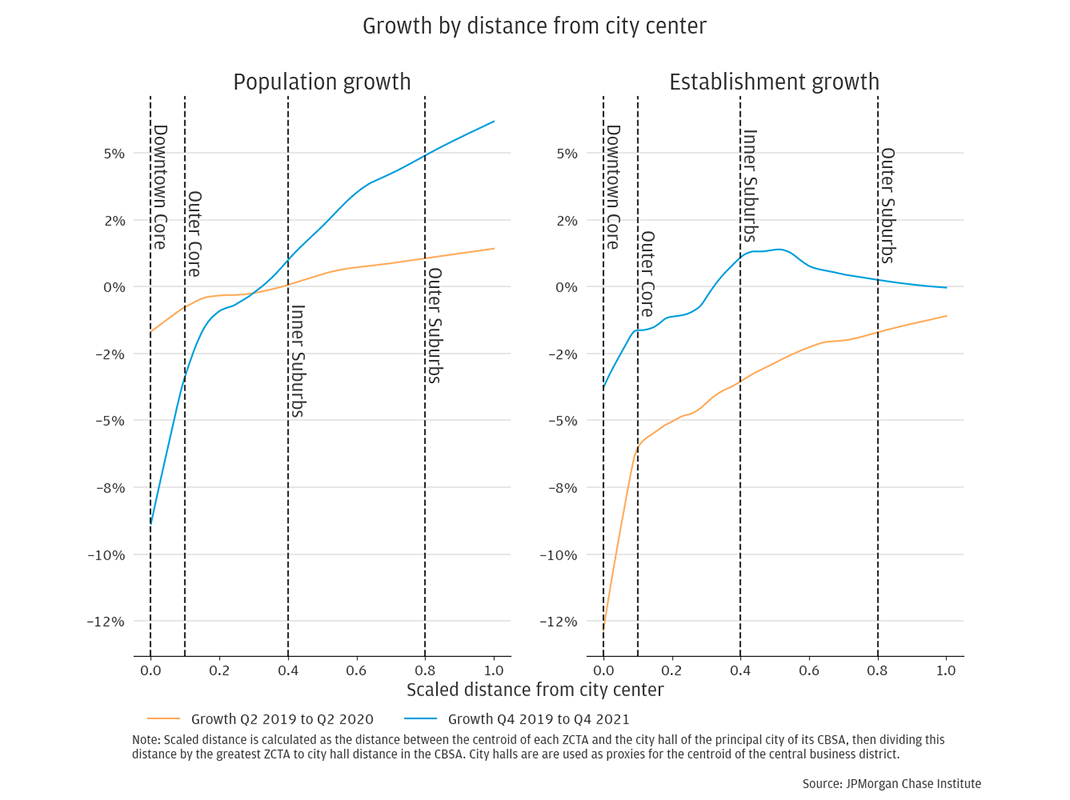
Figure 4: Downtowns have seen persistently lower growth in establishments and population since the onset of the pandemic
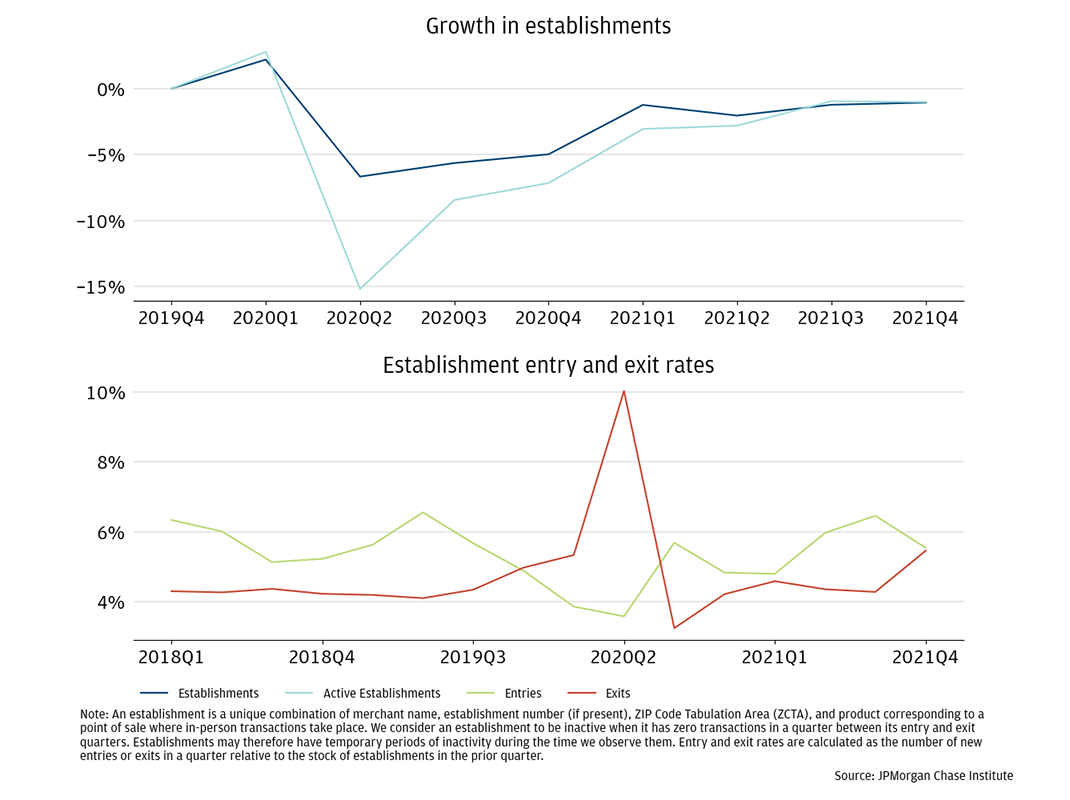
At the aggregate level, we find that the wide variation in gains and losses in establishments we observe across space produces a moderate decline by Q4 2021. The time series for our aggregate results are in Figure 5. As we show in the top panel, the number of establishments across the 16 cities we track declined 6.7 percent relative to Q2 2019. This was far smaller than the 15.2 percent decline in active establishments, which represents both permanent exits and temporary closures due to pandemic conditions.6 The bottom panel shows that permanent pandemic-related closures more than doubled the typical exit rate of establishments in Q2 2020, rising from about 4.5 percent a quarter to 10.0 percent in Q2 2020. The much lower exit rate in Q3 2020 (3.3 percent) suggests that the pandemic partly accelerated closures that were already likely to have taken place.
Past this early phase of the pandemic, the quarterly exit rate quickly returned to its pre-pandemic baseline by the end of 2020.7 The continued depression in establishments in the second half of 2020 was thus not the result of continued elevated closure, but instead driven by a slower entry rate of new establishments. In 2021, the entry rate accelerated, driving total establishment numbers near its baseline pre-pandemic level. By Q4 2021 there were just 1.1 percent fewer establishments relative to Q4 2019. Absent the impact of the Omicron wave in this quarter, which appears to have raised exit rates and depressed entry rates, total establishments may have shown growth above the pre-pandemic baseline. Of course, we would expect establishment levels in the most recent data to be much above this baseline if no pandemic had taken place and establishment growth had continued at around 5 percent per year.
Figure 5: Establishments nearly recovered to their overall pre-pandemic level by 2021
The movement of people to new residential locations is clearly correlated with establishment growth within and across cities. As in the recent work discussed earlier, this movement is driven largely by the adoption of WFH (Ramani & Bloom, 2021; Athloff, et al., 2022; Ding & Hwang, 2022; Ferreira & Wong, 2022; Li & Su, 2022; Brueckner, et al., forthcoming). However, WFH adoption is likely to affect more than residential location choice – it is also likely to affect the day-to-day consumption behavior of individual consumers. For instance, consumers who work from home may switch from purchasing lunch from a restaurant near their job to purchasing lunch from a restaurant near their home or switch to utilizing more grocery stores to prepare lunch at home. They may also purchase less work-related clothing or personal care services used to maintain a professional appearance.
The differential recovery of establishments across retail goods and services provides evidence of such a shift in demand consistent with WFH habits. This can be seen in Figure 6. Clothing and personal care services are the two product types that have recovered the least relative to their pre-pandemic levels. In contrast, grocery and restaurant establishment levels both recovered quickly and are the only product types with overall growth in the most recent data. This makes sense given the essential nature of food-related products.
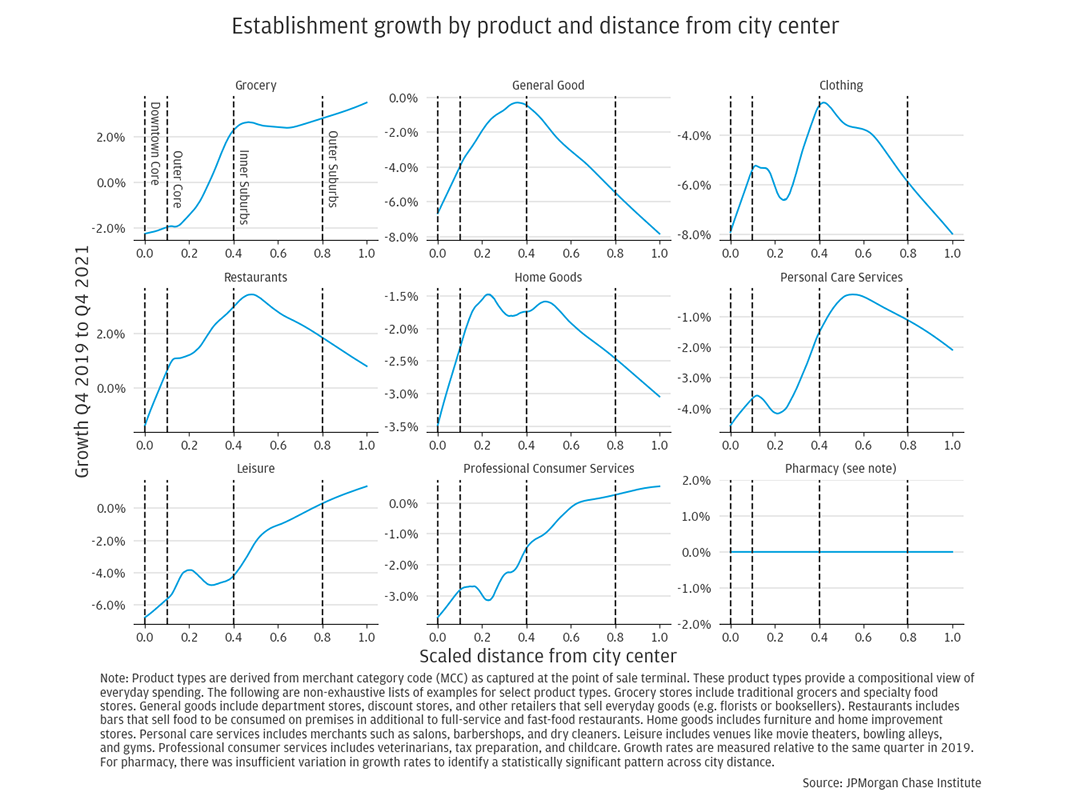
We also find evidence that demand for a wider set of products unrelated to in-person employment is robust enough to create establishment growth near consumers’ more suburban residential locations. This is shown in Figure 7, where we replicate our distance from city center growth rate analysis by product for Q4 2021. Here, we find that the growth for groceries and restaurants is driven by growth in suburban areas. However, restaurants growth is stronger in the inner suburbs while grocery growth is stronger in the outer suburbs. This may reflect stronger shifts in demand from restaurants to grocery stores farther into the suburbs if the WFH adoption also increases with distance.8 We also find that leisure and consumer services establishments are also growing in the suburbs, with increasing growth farther into the suburbs. We expect demand for these products to be more independent of where and how residents work. In contrast, clothing and personal care services show no establishment growth anywhere in the city. In fact, the growth rates for these products are convex, with a negative correlation between population and establishment growth in suburban areas. This again would be consistent with stronger WFH effects if there are more residents adopting WFH farther out into the suburbs.
Figure 6: Groceries and restaurants were the only two types of establishments that recovered to pre-pandemic levels by Q4 2021
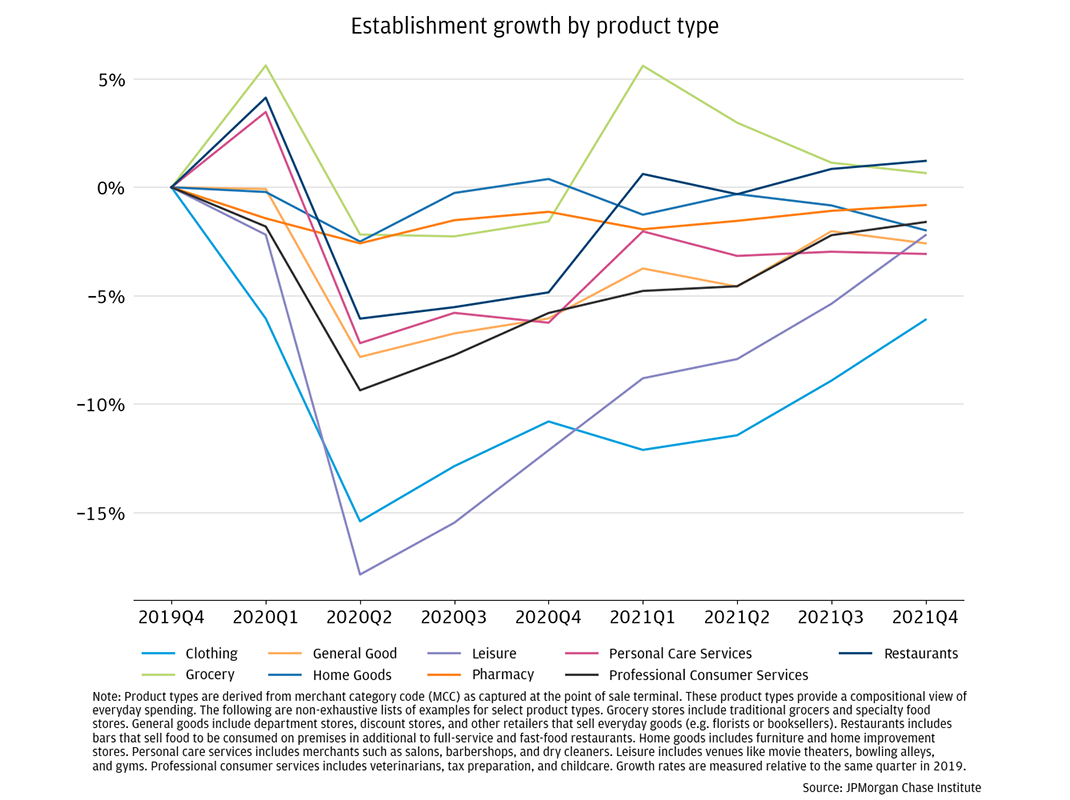
Figure 7: Restaurant establishment growth is strongest in the inner suburbs. Grocery, leisure, and professional consumer services establishments are growing most in outer suburban areas.
Finally, we construct a neighborhood measure of WFH exposure and formally separate out the impact of population change from WFH in a regression framework. For the impact of WFH, we would ideally measure which customers are engaged in remote work. As there is no direct WFH indicator in the data we use, we instead measure the pre-pandemic neighborhood exposure to WFH shocks. We measure this exposure at the neighborhood level in two ways—employment exposure as measured by the share of jobs in industries that had a high likelihood of transition to fully remote or hybrid working schedules and residential exposure as measured by the share of people in a neighborhood who have jobs in those industries. These industries are the two-digit NAICS industries corresponding to Information (51), Finance and Insurance (52), Professional Services (54), and Management of Companies (55) used in Athloff, et al., (2022) to study the geography of remote work. They show a close relationship between employment in these industries and the propensity for remote work during the pandemic.
Our specification is
∆Estzc = β1 Downtownzc + β2 ∆Populationzc + β3 WFH_Emp_Exposurezc
+ β4 WFH_Resi_Exposurezc + Xzc + γc + εzc,
where ∆Estzc is the change in the number of establishments in neighborhood z in city area c, Downtownzc is a dummy variable equal to 1 for neighborhoods in the downtown area (0.0 to 0.1 on our distance scale), ∆Populationzc is the change in customer population, WFH_Emp_Exposurezc measures employment exposure to WFH, and WFH_Resi_Exposurezc measures residential exposure to WFH. We also include a vector of neighborhood characteristics,Xzc, that controls for pre-pandemic neighborhood non-white residential share, median income, and changes in offline and online spending by customers living in the neighborhood. In all specifications, we include city fixed effects, γc . εz is assumed to be a normally distributed iid error term.
Identifying the effects of WFH on establishment growth presents many challenges. The estimation in differences controls for neighborhood characteristics that are time-invariant over the two-year window and correlate with our dependent variables. The Downtownzcdummy controls for remaining differences in pandemic effects in downtown cores that are not captured by our other controls. City fixed effects control for the common effects of the pandemic across each city. The inclusion of neighborhood characteristics recognizes that the pandemic differentially affected the economic performance of low- and high- socioeconomic status neighborhoods. These effects could operate through the direct impact of the disease and indirect economic effects, such as through the labor market or stimulus payments (Chetty, et al., 2022). As we show in our related work, the pandemic also induced new and persistent use of some online products, particularly for grocery and restaurant, which may have its own effect on the viability of brick-and-mortar retail and correlate with WFH adoption (Wheat, et al., 2021). Conditional on these controls, we believe there is limited scope for reverse causality concerns in this context; arguably COVID-19 largely acted as an exogenous shock to customer locations and spending behaviors that then fundamentally altered the viability of retail establishments in different locations.
Table 1: Relationship of select neighborhood-level characteristics with establishment growth
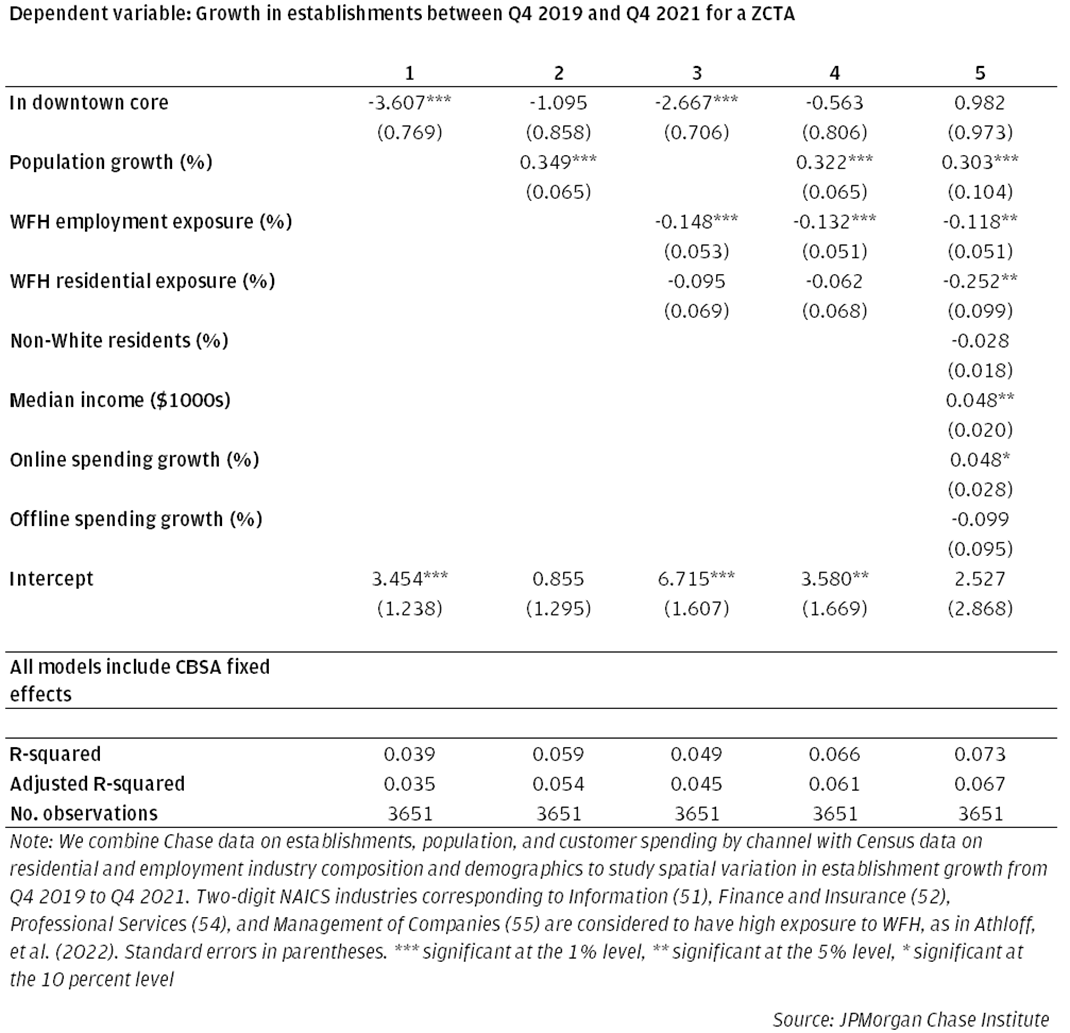
Our results are found in Table 1. Echoing our earlier results, we find in Model 1 that being in a downtown area is associated with an average 3.6 percentage point lower rate of growth in establishments, absent other controls. Model 2 adds our estimate of population growth for the same period and again we find that changes in population have a strong correlation with establishment growth during this period, enough so that the downtown dummy variable becomes insignificant. On their own in Model 3, both employment and residential exposure to WFH have a negative effect on establishment growth. In this estimate, 1 percentage point higher WFH employment and residential exposure are associated with -0.15 and -0.10 percentage points lower establishment growth, respectively. This association holds true even conditional on population growth in Model 4. The stability of the coefficients across Models 2 -4 suggests that the effects of WFH through population versus behavioral effects are relatively independent sources of variation in the data.
In our final specification in Model 5, we include other controls for neighborhood demographics and changes in spending behaviors by channel. These controls quadruple the size of the negative coefficient for WFH residential exposure to -0.25 percentage points. This makes sense given that we observe strong positive correlation among neighborhoods with more WFH residential exposure, higher income, and fewer non-white residents.9 With these correlations partialled out, the impact of the WFH residential exposure measure becomes the most important driver of retail establishment growth next to population growth. This matches our intuition that if consumers who WFH go on fewer trips overall, the impact of that daily WFH behavioral change should be larger near residential locations where the majority of consumer shopping takes place.
Overall, these results suggest a set of mechanisms through which the adoption of WFH behaviors has affected the location of retail establishments. The first is the relocation of residences. A majority of consumer shopping happens around residences and recent entry patterns for establishments reflect the new suburban locations of customers. Second is the decline of commuting trips. Downtown locations that heavily rely on consumption chained with commuting continue to suffer. Last, is that beyond the changes in residential and employment location choices, changes in consumer habits driven by the adoption of WFH has depressed the recovery of physical retail establishments. The WFH population may make fewer overall consumption trips and have lower demand for clothing and personal care services that are less relevant for their new working environment.
We find a dramatic reorganization of both population and retail establishments away from city centers toward suburban areas that is persistent from the COVID-19 pandemic. This presents both challenges and opportunities that can be addressed with careful policy choices.
Land use. A change in the relative demand for different types of residential and commercial properties across space implies that the best use of land may no longer be reflected by current zoning laws. Increased flexibility in zoning that allows for conversion between residential and commercial spaces in downtown cores may address both declining commercial demand and housing affordability problems that continue to persist despite changes in population. Our results can inform broader initiatives aimed at increasing flexible land use. Examples include proposals to modernize regulations around office building conversions or federal proposals to promote dense development as a tool to spur local economic growth.10 11
Commercial real estate. In the short- and medium-term, a reduction in the number of establishments in city centers implies more unused commercial real estate and decreased value. On the margin, this might lower rents and offer opportunities for entry to firms that might not have otherwise had them. Conversely, suburban areas with growing populations may benefit from increased commercial property values, especially if there is not enough existing commercial space to meet new demand. This may in turn provide new challenges for existing businesses as rents rise.
Tax policy. Property taxes are a major source of revenue for local governments. Lower commercial property values in city centers will restrict the flow of funds to city governments, while rising values outside of the city center may prove a boon for local governments in suburban areas. To the extent that local governments impose local sales taxes, these receipts will also be affected by the changing locations of establishments.12 Where residents are not only moving to less dense areas in a city, but moving out of the state altogether, they also reallocate an important source of revenue at the state level.
Development of new retail centers. If new WFH patterns continue to negatively impact certain sectors more than others through changing consumer behavior, businesses in these sectors may still face headwinds even if they are catering to a stable or growing residential population. Business owners and local-level decision-makers considering how to develop retail amenities should consider how this changing consumer behavior may change the mix of retail that is sustainable for different retail corridors.
Transportation policy. Decreased ridership from commuting has weakened the financial position of many public transport networks (Gkiotsalitis & Cats, 2021). Our research suggests that with more retail amenities allocated to suburban areas, there may be more desire for shopping trips in suburban areas relative to commuting trips as we exit the pandemic. Changes in transportation schedules and connections that facilitate such trips may improve the utility of transportation networks. Making such investments remains a challenge as ridership levels are still below pre-pandemic levels and federal COVID aid is spent down.13 However, new funding through the Infrastructure Investment and Jobs Act may provide cities opportunities to adapt their public transit networks to reflect new travel patterns.
Appendix A: Measuring population change.
Population changes are calculated by using a cohort of Chase customers in the 16 metro areas we track in this report. We calculate growth at the quarterly level relative to the same quarter in 2019. To be included in this cohort, a customer must have at least 10 transactions in each month of the current quarter and at least 10 transactions in each month of the lag quarter. This process guards against conflating changes in the customer base with changes in the broader population. Customers are grouped at the ZCTA level. If a customer lives in multiple ZCTAs during a quarter, they are assigned to their modal ZCTA of residence.
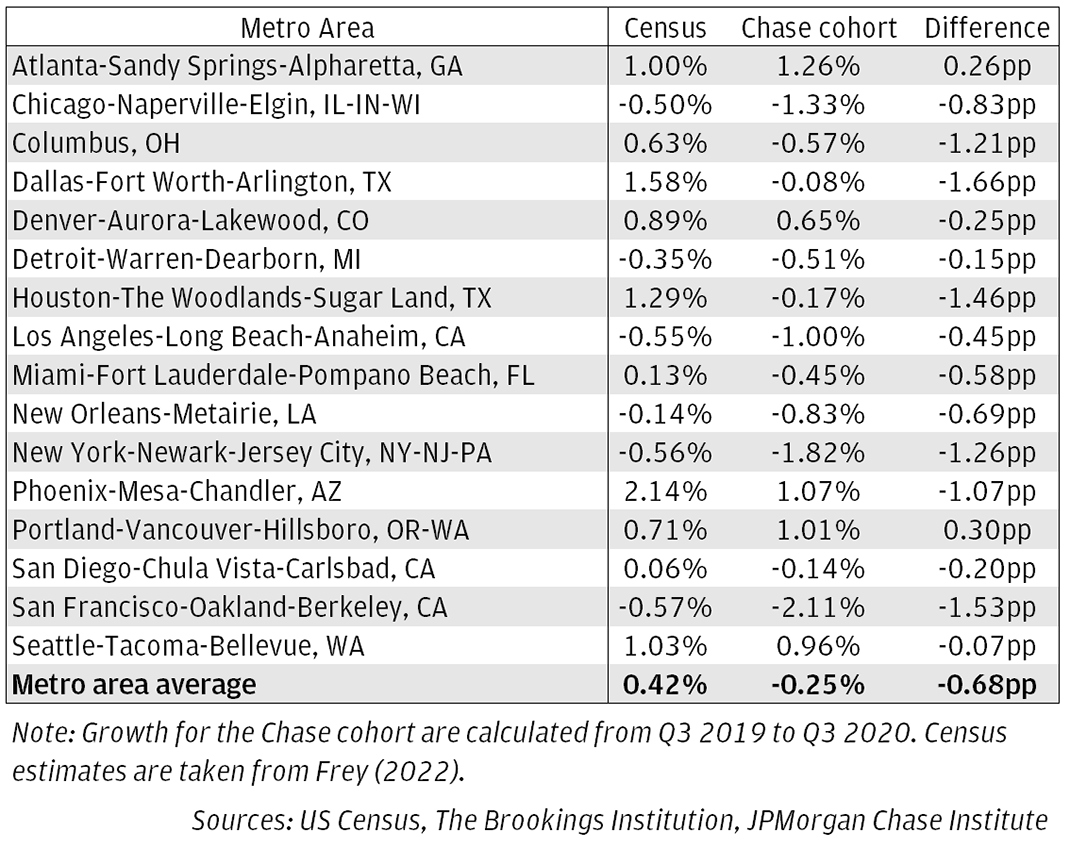
Creating our cohort in this way allows us to create a proxy for quarterly population change at both the neighborhood and metro area level that is more timely than other data sources. At the time of writing the most recent population estimates from the ACS are one-year estimates from 2021 at the metro area level. Table A1 compares growth at the metro area level from 2019 to 2020 using our approach and Census estimates calculated in Frey (2022). We use our quarterly measure of growth from Q3 2019 to Q3 2020 here because the benchmark growth estimates are calculated as of July 2020. The correlation coefficient for the two sets of growth rates is high at 0.79. Our estimates are, on average, 0.7 percentage points lower. This may reflect that the banked population we track is somewhat higher income, and thus more impacted by the WFH shock, than city populations as a whole.
Appendix B: Method for calculating distance from center and estimating its relationship with establishment growth
ZCTA distance to city center is defined using the ZCTA centroid and the centroid for the center of the city. We follow Holian (2019) and Couture & Handbury (2020) in defining the center of the city based on the location of the dominant city’s city hall.14 To create scaled distances for comparison across metro areas, we take the distance to the city center of the farthest ZCTA centroid in each metro area and divide all other ZCTA centroid to city center distances by this maximum distance. This gives us relative distance from the center of a metro area on a 0.0 to 1.0 scale.
To estimate average growth at each point along the 0 to 1 distance scale, we use Locally Weighted Scatterplot Smoothing (Cleveland, 1979). For this regression, our dependent variable, yi, is the growth in the number of establishments and our independent variable, xi, is scaled distance from city center. Smoothed values of yi are estimated by taking a subset of the points closest to xi and using a weighted linear regression. Points that are further away from xi are given less weight than those closer to it. The subset of data used at each point, the bandwidth, used here is a third of the total number of observations. The exception are the growth estimates in Figure 7, where half of the total observations were used to account for the reduced amount observations and increased variability when estimating growth with at the product level.
Appendix C: Pre-COVID spatial trend in establishment growth
Figure C1: Unlike the drastic post-pandemic pattern, establishment growth was similar across the metro area before the onset of the pandemic, with more growth happening downtown than in the suburbs.
Appendix D: Establishment growth by neighborhood racial composition and income
Figure D1: A small, but persistent gap in growth across neighborhoods of different racial compositions emerged after the onset of the pandemic.
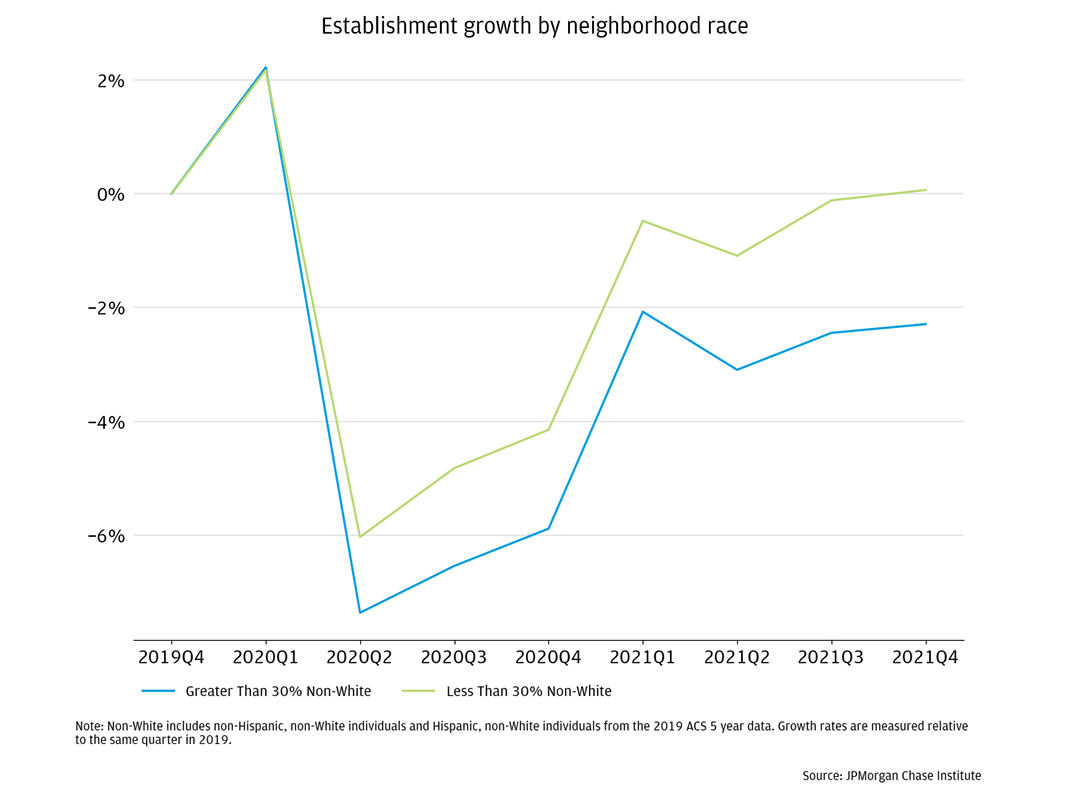
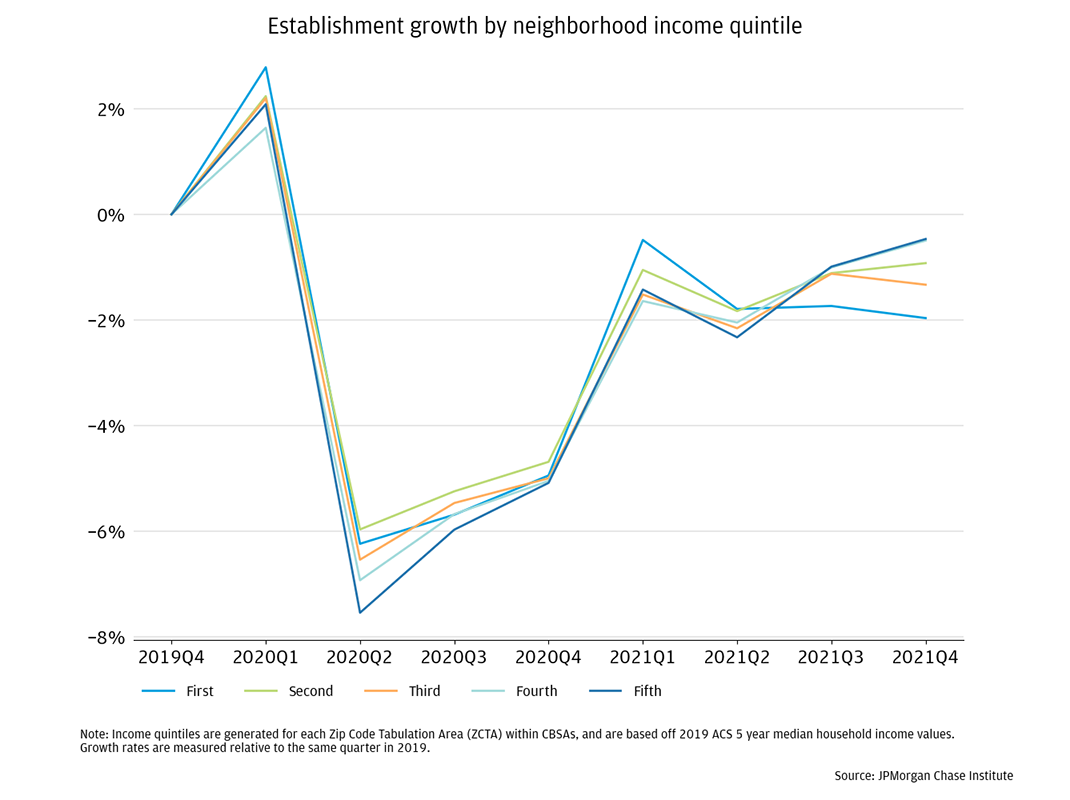
Figure D2: There was minimal difference in establishment growth across neighborhoods of different income levels
Athloff, L., Eckert, F., Ganapati, S. & Walsh, C., 2022. The Geography of Remote Work. NBER Working Paper Series No. 29181.
Barrero, J. M., Bloom, N. & Davis, S. J., 2021. Why Working from Home Will Stick. NBER Working Paper Series No. 28731.
Brueckner, J., Kahn, M. E. & Lin, G. C., forthcoming. A New Spatial Hedonic Equilibrium in the Emerging Work-from-Home Economics. American Economic Journal: Applied Economics.
Chetty, R., Friedman, J. N., Hendren, N. & Stepner, M., 2022. The Economic Impacts of COVID-19: Evidence from a New Public Database Built Using Private Sector Data. NBER Working Paper No. w27431.
Cleveland, W. S., 1979. Robust Locally Weighted Regression and Smoothing Scatterplots. Journal of the American Statistical Association, 74(368), pp. 829-836.
Couture, V. & Handbury, J., 2020. Urban Revival in America. Journal of Urban Economics, Volume 119, p. 103267.
Crane, L. D. et al., 2021. Business Exit During the COVID-19 Pandemic: Non-Traditional Measures in Historical Context. Volume Finance and Economics Discussion Series 2020-089rl.
Dalton, M. & Groen, J. A., 2022. Telework During the COVID-19 Pandemic: Estimates using the 2021 Business Response Survey. Monthly Labor Review.
Decker, R. A. & Haltiwanger, J., 2022. Business entry and exit in the COVID-19 pandemic: A preliminary look at official data, Washington: Board of Governors of the Federal Reserve System FEDS Notes.
Ding, L. & Hwang, J., 2022. Has COVID Reversed Gentrification in Major U.S. Cities? An Empirical Examination of Residential Mobility in Gentrifying Neighborhoods During the COVID-19 Crises. Federal Reserve Bank of Philadelphia Working Paper WP22-20.
Fairlie, R., 2020. The Impact of COVID-19 on Small Business Owners: Evidence from the First Three Months After Widespread Social-Distancing Restrictions. Journal of Economics & Management Strategy, 29(4), pp. 727-740.
Farrell, D., Relihan, L. & Ward, M., 2017. Going the Distance: Big Data on Resident Access to Everyday Goods, s.l.: JPMorgan Chase Institute.
Ferreira, F. V. & Wong, M., 2022. Neighborhood Choice After Covid: The Role of Rents, Amenities, and Work-from-Home. Working Paper.
Frey, W. H., 2022. New census data shows a huge spike in movement out of big metro areas during the pandemic. [Online]
Available at: https://www.brookings.edu/blog/the-avenue/2022/04/14/new-census-data-shows-a-huge-spike-in-movement-out-of-big-metro-areas-during-the-pandemic/#:~:text=But%20in%202020%2D21%2C%20the,these%20areas
[Accessed 11 November 2022].
Gkiotsalitis, K. & Cats, O., 2021. Public Transport Planning Adaptation under the COVID-19 Pandemic Crises: Literature Review of Research Needs and Directions. Transport Review, 41(3), pp. 374-392.
Gupta, A., Mittal, V. & Nieuwerburgh, S. V., 2022. Work from Home and the Office Real Estate Apocalypse. Working Paper.
Holian, M. J., 2019. Where is the City's Center? Five Measures of Central Location. Cityscape: A Journal of Policy Development and Research, 21(2).
Li, W. & Su, Y., 2022. The Great Reshuffle: Residential Sorting during the COVID-19 Pandemic and Its Welfare Implications. Working Paper.
Miyauchi, Y., Nakajima, K. & Redding, S. J., 2022. The Economics of Spatial Mobility: Theory and Evidence Using Smartphone Data. Working Paper.
Ramani, A. & Bloom, N., 2021. The Donut Effect of COVID-19 on Cities. NBER Working Paper Series No 28876.
Relihan, L. E., 2022. Is Online Retail Killing Coffee Shops? Estimating the Winners and Losers of Online Retail using Customer Transaction Microdata. Working Paper.
Rosenthal, S. S., Strange, W. C. & Urrego, J. A., 2022. Are city centers losing their appeal? Commercial real estate, urban spatial structure and COVID-19. Journal of Urban Economics.
Wheat, C., Duguid, J., Relihan, L. & Kim, B., 2021. The COVID Shock to Online Retail: The persistence of new online shopping habits and implications for the future of cities, s.l.: JPMorgan Chase Institute.
We thank Maya Sokoletsky for her contributions to the analysis. We also thank Anthony Rivera, Annabel Jouard, Alfonso Zenteno, Kate Finnerty, Clarke Wilson, and Steve Harrington for their support. We are indebted to our internal partners and colleagues, who support delivery of our agenda in a myriad of ways and acknowledge their contributions to each and all releases.
We would like to acknowledge Jamie Dimon, CEO of JPMorgan Chase & Co., for his vision and leadership in establishing the Institute and enabling the ongoing research agenda. We remain deeply grateful to Peter Scher, Vice Chairman, Demetrios Marantis, Head of Corporate Responsibility, Heather Higginbottom, Head of Research & Policy, and others across the firm for the resources and support to pioneer a new approach to contribute to global economic analysis and insight.
This material is a product of JPMorgan Chase Institute and is provided to you solely for general information purposes. Unless otherwise specifically stated, any views or opinions expressed herein are solely those of the authors listed and may differ from the views and opinions expressed by J.P. Morgan Securities LLC (JPMS) Research Department or other departments or divisions of JPMorgan Chase & Co. or its affiliates. This material is not a product of the Research Department of JPMS. Information has been obtained from sources believed to be reliable, but JPMorgan Chase & Co. or its affiliates and/or subsidiaries (collectively J.P. Morgan) do not warrant its completeness or accuracy. Opinions and estimates constitute our judgment as of the date of this material and are subject to change without notice. No representation or warranty should be made with regard to any computations, graphs, tables, diagrams or commentary in this material, which is provided for illustration/reference purposes only. The data relied on for this report are based on past transactions and may not be indicative of future results. J.P. Morgan assumes no duty to update any information in this material in the event that such information changes. The opinion herein should not be construed as an individual recommendation for any particular client and is not intended as advice or recommendations of particular securities, financial instruments, or strategies for a particular client. This material does not constitute a solicitation or offer in any jurisdiction where such a solicitation is unlawful.
Wheat, Chris, James Duguid, Lindsay Relihan, Bryan Kim. 2023. “Downtown Downturn: The Covid Shock to Brick-and-Mortar Retail.” JPMorgan Chase Institute. https://www.jpmorganchase.com/insights/community-development/downtown-downturn-covid-shock-to-brick-and-mortar
Based on the American Community Survey 2021 1-year estimates. Similarly, Dalton & Groen (2022) report that a third of jobs in 2021 are at least partly telework using U.S. Bureau of Labor Statistics survey data.
Individuals who work from home spent nearly twice as much time eating at home as those who work away from home according to USDA survey results on pre-pandemic WFH food preparation habits.
Statistic calculated from the 2018 Commercial Buildings Energy Consumption Survey: Building Characteristics Highlights conducted by the U.S. Department of Energy. The combination of mercantile, food service, and service amounts to 29 percent and most closely maps to the retail goods and services studied here.
These are Atlanta, Chicago, Columbus, Dallas-Ft. Worth, Denver, Detroit, Houston, Los Angeles, Miami, New Orleans, New York, Phoenix, Portland, San Diego, San Francisco, and Seattle. We define a city as the collection of ZCTAs that most closely match the boundaries of the Census-defined Core-Based Statistical Area.
We characterize neighborhoods in the downtown core as those from a distance of 0.0 to 0.1, the outer core neighborhoods as those from a distance of 0.1 to 0.4, the inner suburbs as neighborhoods from a distance of 0.4 to 0.8, and the outer suburbs as those from 0.8 to 1. To create these cutoffs, we mapped rings at each increment of 0.1 of our scaled distance onto our study metro areas and chose those that best approximated meaningful changes in city composition. See more detail on how we calculate this distance and estimate its relationship to growth in Appendix B.
This is similar to the 22% decline in active small businesses documented in (Fairlie, 2020).
This is slightly lower than the 5% quarterly closure rate for all establishments (retail and non-retail) reported by the Census Bureau Business Dynamics Statistics in Crane, et al. (2021).
There may also be zoning restrictions or minimum customer density constraints that are binding for restaurants, but not other growing products, in outer suburban areas.
Considered in isolation, we observe some persistent differences between neighborhoods of different racial compositions and do not observe much difference across the neighborhood income spectrum (see appendix figures D1 and D2). However, when considered along with population growth and WFH exposure, the importance of these explanatory variables decreases.
For example, see the “Making New York Work for Everyone” plan outlined in this statement from the Office of the Mayor, and further information on the plan here.
Details found in this White House statement, https://www.whitehouse.gov/briefing-room/statements-releases/2022/05/16/president-biden-announces-new-actions-to-ease-the-burden-of-housing-costs/
For example, see the budget proposal for investments to support businesses in San Francisco’s economic core, which highlights the importance of sales taxes generated by the area to the city’s budget. Details found in this statement, and further information on the Economic Core Recovery Fund here.
Details found in this Congressional Budget Office report.
We take the pre-1954 city hall location for Miami, rather than its modern location outside the central business district.
Authors

Chris Wheat
President, JPMorganChase Institute

James Duguid
Former Research Lead, JPMorganChase Institute

Lindsay Relihan
JPMorgan Chase Institute Academic Fellow

Bryan Kim
Research Engineer, JPMorgan Chase Institute