Findings

Introduction

The COVID-19 recession hit the lowest-paid sectors of the economy the hardest, resulting in lower-income Americans losing their jobs and income at higher rates.1,2,3 Renters, who tend to have lower incomes than homeowners, are more likely to have been impacted negatively by the economic shocks of the pandemic. While the Coronavirus Aid, Relief, and Economic Security (CARES) Act that passed in March 2020 provided one year of easily attainable mortgage forbearance for most homeowners4, renters did not receive any form of federally-provided rent relief until the Coronavirus Response and Relief Supplemental Appropriations Act of 2021 passed on December 27, 2020. This Act provided $25 billion in rental assistance through the Emergency Rental Assistance Program to cover current or past due balances.5,6 In the interim, renters benefited from the same government supports that were available to all, such as expanded unemployment insurance (UI) benefits, and Economic Impact Payment (EIP) stimulus checks. There was also a complicated patchwork of eviction moratoria originating from federal, state, and local governments with various expiration dates that were often extended at the last minute as well as rental assistance in certain specific localities.7

With this backdrop, we examine income and savings patterns for renters and mortgages holders during the pandemic and ask: is there evidence that renters needed more assistance than they received?

We find evidence that renters indeed needed more of a financial safety net than was available during the pandemic. The renters we analyze are much more affluent than typical renters and even among this population, they were more likely than mortgage holders to have lost their job and suffered large swings in their labor income, including large drops. Even with unusually generous UI benefits and stimulus checks, more than one in five renters experienced a greater than 10 percent drop in their total income. These income swings were more negative relative to the pre-COVID period. Finally, renters not only had lower incomes than mortgage holders, they also had much less of a savings buffer entering the pandemic. While more generous UI benefits and stimulus checks dramatically boosted their savings, they had depleted most of the additional savings by the end of the year, their position relative to mortgage holders did not improve significantly, and nearly one in four renters saw their savings decrease in 2020.

Data and Analytics

Using account and transaction-level administrative data on deposit accounts, credit cards, and mortgages, we find samples of households that we can confidently categorize as either renters or mortgage holders.8 The first population consists of credit card applicants from 2019 onwards with deposit accounts who indicated that they either had a positive monthly rent and no mortgage balance (renters) or no rent and a positive mortgage balance (mortgage holders).9 Our sample of renters also includes deposit account customers who we can see making as least one rent payment10 since January 2019. Finally, we use Chase mortgage customers from 2019 onwards who also have a deposit account to round out our sample of mortgage holders.

Renters, Mortgage holders

Renters

Mortgage holders

Population 1

Chase credit card holders with credit card application in 2019 or later and with Chase deposit account

Indicated positive monthly rent and no mortgage balance


1,374,000 renters

Indicated zero monthly rent and positive mortgage balance


1,348,000 mortgage holders

Population 2


40 million Chase deposit account customers

Population 3


Chase Home Lending customers with Chase deposit account

At least one identified rent payment in transaction history since 2019

1,548,000 renters

Has Chase Home Lending-serviced mortgage that is active between 2018-2020

2,867,000 renters

Must be in data from 2019 through December 2020, have at least 3 transactions per month through February 2020, and at least $12,000 of labor income in 2019

668,000 Renters

617,000 mortgage holders

Source: JPMorgan Chase Institute

The Federal Reserve Bank of Boston’s Bill Payment Experiment and the Survey of Consumer Payment Choice data show that “the dominant methods for paying rent are cash (22 percent), check (42 percent), and money order (16 percent). Electronic methods are still rarely used, at 8 percent for bank account number payment and 7 percent for online banking bill payment, and less than 2 percent for debit and credit cards.”11 Based on our selection criteria, renters in our sample by definition either have a Chase credit card or pay their rent online. We are therefore less likely to be able to identify several segments of the renter population—for example, families that pay rent using cash, checks, or money orders or those receiving rental assistance through the Housing Choice Voucher Program, which is typically paid directly to the landlord. Therefore, even though the broader deposit account population is fairly representative of the banked population, the limited ways we have to identify renters causes the renters in our sample to have income levels that are significantly higher than typical renters. Figure 1 shows that, after accounting for taxes, the median renter in our sample may well have an income level that is up to twice as high as the median renter in the Survey of Consumer Finances (SCF).12 Another way to quantify this is that in our data, mortgage holders have income levels that are 1.4 times those for renters whereas in the SCF, homeowners have incomes that are 2.2 times those of renters.13 Given the pandemic’s disproportionate effect on lower income households, our results likely represent a “best case scenario” for renters relative to mortgage holders.

Despite the significant upward income skew in our rental sample, this research provides an important window into the financial lives of renters during the pandemic. There are very few data sources that provide a comprehensive and timely view of the labor market outcomes of renters. While surveys such as the Census Pulse Survey provided a self-reported view of renters’ past rent payments and their confidence in terms of making future payments, they do not allow for precise measures of the size of income changes and savings levels. Also, some of the surveys and other administrative rent payment datasets lack the longitudinal ability to provide a year-over-year view (Census Pulse Survey, Avail).

Figure 1: Renters have significantly lower labor income, total income, and liquid assets than mortgage holders.

Median Income and Liquid Assets

For the Survey of Consumer Finances, Median Income & Liquid Assets for Renters is $1,369 and Median Income & Liquid Assets for Mortage Holders is $2,981. For Labor Income, Median Income & Liquid Assets for Renters is $1,571 and Median Income & Liquid Assets for Mortage Holders is $2,209. For the Total Income, Median Income & Liquid Assets for Renters is $2,452 and Median Income & Liquid Assets for Mortage Holders is $3,446. For the Liquid Assets, Median Income & Liquid Assets for Renters is $1,786 and Median Income & Liquid Assets for Mortage Holders is $2,881.

Source: JPMorgan Chase Institute

01

Renters were more likely than mortgage holders to have lost their job and experienced large declines in labor income

To understand the differential labor market impact of the pandemic on renters and homeowners, we first compare the rate of UI receipt and income trends between the two groups. By measuring the fraction of each group with direct-deposited UI, we find that renters received UI at a higher rate than mortgage holders during the pandemic (Figure 2).14 Importantly, in our data, renters and mortgage holders received UI at approximately the same rate prior to the onset of the pandemic in March. Therefore, these results imply that COVID had a larger effect on renters versus mortgage holders in terms of job loss. These results are also consistent with Census Pulse Survey data for late January 2021 showing that 43 percent of homeowners reported experiencing loss of employment income during the pandemic compared with 59 percent of renters.15

Despite a sharp divergence in direct deposit UI receipt between renters and mortgage holders during the pandemic, we find similar levels before the pandemic. This pre-pandemic pattern contrasts with prior research which typically documents that unemployment rates are lower for homeowners than renters (Goodman et. al 2020).16 The discrepancy may be because the renters in this sample skew higher income and are, therefore, more similar to homeowners.17 Altogether, this implies that the gap in the rate of UI receipt between the two groups shown in Figure 2 is likely an underestimate of the true differential impact of the pandemic on job loss.

Figure 2: Renters received UI at a higher rate than mortgage holders during the pandemic, indicating greater job loss.

Rate of UI receipt

Line graph comparing the rate of UI receipt and income trends between renters and homeowners, using the fraction of each group with direct-deposited UI. The trend of this graph shows that while renters and mortgage holders received UI at approximately the same rate prior to the onset of the pandemic in March, during the pandemic, renters received UI at a higher rate than mortgage holders. Renters and mortgage holders also received UI at approximately the same rate prior to the onset of the pandemic in March. The trend indicates that COVID had a different impact on renters versus mortgage holders in terms of job loss.

Source: JPMorgan Chase Institute

Figure 3 compares the distribution of labor income18 changes between renters and mortgage holders in both the 2018 to 2019 pre-COVID period and the 2019 to 2020 COVID period. It shows that, during COVID, a larger fraction of renters experienced very large labor income losses of at least 50 percent compared to mortgage holders. Fourteen percent of renters were in this group compared to 10 percent of mortgage holders. This result is consistent with our prior finding that renters were more likely to have received UI. Indeed, while less than 10 percent of renters with stable or increasing labor income received direct-deposited UI,19 42 percent of those who lost at least half of their labor income did.

Figure 3 also shows that even prior to COVID, renters experience more volatility in their labor income than mortgage holders. Much of this volatility was in the form of increases and it is worth noting that given the lower initial base level of labor income for renters (Figure 1), these percentage changes translate to less of an increase in dollar terms compared to mortgage holders. Additionally, during COVID, renters experienced considerably larger declines in labor income compared to 2019 and also compared to mortgage holders in 2020. Indeed, a third of renters saw more than a 10 percent decline in their labor income.

Figure 3: Renters experienced a shift from being more likely than mortgage holders to have had income gains pre-COVID to being more likely to have had substantial decreases in labor income during COVID.

Distribution of labor income changes

For -100% to -50%: Renters (2018-2019) have 2% Change in Income. Renters (2019-2020) have 14% Change in Income. Mortgage Holders (2018-2019) have 3% Change in Income. Mortgage Holders (2019-2020) have 10% Change in Income.

For -50% to -10%: Renters (2018-2019) have 13% Change in Income. Renters (2019-2020) have 19% Change in Income. Mortgage Holders (2018-2019) have 14% Change in Income. Mortgage Holders (2019-2020) have 18% Change in Income.

For -10% to 10%: Renters (2018-2019) have 38% Change in Income. Renters (2019-2020) have 35% Change in Income. Mortgage Holders (2018-2019) have 51% Change in Income. Mortgage Holders (2019-2020) have 43% Change in Income.

For 10% to 50%: Renters (2018-2019) have 28% Change in Income. Renters (2019-2020) have 23% Change in Income. Mortgage Holders (2018-2019) have 24% Change in Income. Mortgage Holders (2019-2020) have 20% Change in Income.

For greater than or equal to 50%: Renters (2018-2019) have 19% Change in Income. Renters (2019-2020) have 9% Change in Income. Mortgage Holders (2018-2019) have 8% Change in Income. Mortgage Holders (2019-2020) have 5% Change in Income.

Source: JPMorgan Chase Institute

Next, we expand the income definition to include other sources of income, notably government supports such as stimulus and UI.20 As shown in Figure 4, during COVID, a larger fraction of renters experienced total income gains compared to mortgage holders. Forty-seven percent of renters saw an increase in their total income of at least 10 percent compared to 38 percent of mortgage holders.21  Some of this skew to the right for the renter group relative to mortgage holders is likely indicative of the greater extent of job losses they experienced and the important role of government support including expanded and elevated jobless benefits during COVID: 18 percent of renters whose total income increased by more than 10 percent received UI compared to 14 percent of mortgage holders in the same group and 14 percent of renters experiencing stable or declining total income. It is worth recalling that renters had lower incomes than mortgage holders prior to COVID but all jobless workers who received UI during 2020 could have been paid a weekly UI supplement of $600 between April and July and $300 in September from Lost Wages Assistance, regardless of their income level. Thus, some renters with total income increases may have received UI benefits that replaced more than 100 percent of their prior earnings.22

Importantly, even though many renters had large income increases, a significant fraction of renters saw their income fall during the pandemic. Twenty-two percent of renters saw their total income fall by more than 10 percent, even after government assistance in the forms of UI and EIP. In fact, relative to the pre-COVID period, the distribution of total income changes actually shifted toward losses for renters. One caveat is that because we only observe direct-deposited UI payments, we miss approximately two-thirds of UI payments. Taking that into account could result in a smaller proportion of renters with income losses, but that effect is unlikely to be very large since we can see direct-deposited UI payments for 15 percent of renters with income losses.

A similar shift happened to mortgage holders, but the majority of these households had access to forbearance. Indeed, in our data, 6 percent of mortgage holders with stable or increasing total income opted for mortgage forbearance compared to 9 percent of mortgage holders experiencing income declines. No equivalent housing payment relief policy was in place for renters.

Figure 4: Renters were more likely to have experienced total income gains than mortgage holders, likely the result of greater job loss among renters and unusually generous UI. However, even after UI and EIP, renters saw their income change distribution shift toward losses and a significant portion of renters had material decreases in income.

Distribution of total income changes

For -100% to -50%: Renters (2018-2019) have 1% Change in Income. Renters (2019-2020) have 3% Change in Income. Mortgage Holders (2018-2019) have 3% Change in Income. Mortgage Holders (2019-2020) have 4% Change in Income.

For -50% to -10%: Renters (2018-2019) have 16% Change in Income. Renters (2019-2020) have 19% Change in Income. Mortgage Holders (2018-2019) have 21% Change in Income. Mortgage Holders (2019-2020) have 24% Change in Income.

For -10% to 10%: Renters (2018-2019) have 32% Change in Income. Renters (2019-2020) have 31% Change in Income. Mortgage Holders (2018-2019) have 39% Change in Income. Mortgage Holders (2019-2020) have 34% Change in Income.

For 10% to 50%: Renters (2018-2019) have 35% Change in Income. Renters (2019-2020) have 34% Change in Income. Mortgage Holders (2018-2019) have 31% Change in Income. Mortgage Holders (2019-2020) have 27% Change in Income.

For greater than or equal to 50%: Renters (2018-2019) have 16% Change in Income. Renters (2019-2020) have 13% Change in Income. Mortgage Holders (2018-2019) have 11% Change in Income. Mortgage Holders (2019-2020) have 11% Change in Income.

Source: JPMorgan Chase Institute

01

Renters had less in savings than mortgage holders before March 2020, and their relative position did not improve significantly during the pandemic.

To further compare the financial outcomes of renters and mortgage holders during the pandemic, we examine liquid balance trends for each group. From Figure 1, we know that renters entered the pandemic with lower incomes, but much less in liquid assets where mortgage holders had 1.6 times the liquid assets of renters. Savings levels overall have increased in the pandemic, and the gains have been maintained especially for higher-income families.23 Figure 5 shows that, similarly, renters and homeowners both saw their savings level increase especially after EIP checks were disbursed in mid-April. However, by the end of the year, 75 percent of the additional savings had been depleted for renters while only 46 percent had been for mortgage holders.

Figure 5: Both the median renter and mortgage holder saw their savings increase in 2020, but renters depleted more of the additional savings by the end of the year.

Year-over-year dollar change in median liquid balances

Line graph comparing weekly year over year (yoy) dollar changes in liquid balances between renters and mortgage holders in 2020. Using liquid balances as a measure of savings, both the median renter and mortgage holder saw their savings increase in 2020. At the beginning of the year renters had approximately a $200 yoy increase and mortgage holders had a $100 yoy increase. Savings further increased after 3/23/2020 to a peak of approximately a $12,000 yoy dollar change for renters and a $900 yoy dollar change for mortgage holders at the beginning of June. Throughout the rest of the year, these additional savings levels compared to 2019 decreased for both renters and mortgage holders to approximately a $1000 yoy dollar change for renters and $450 yoy dollar change for mortgage holders by 12/14/2020.

Source: JPMorgan Chase Institute

Figure 6 takes a distributional view of changes in liquid balances. Consistent with Figure 5, the majority of both renters and mortgage holders saw higher liquid balances during the pandemic, with renters experiencing larger gains in percent terms compared to mortgage holders.24 Thirty-eight percent of renters experienced a greater-than-50 percent gain compared to 32 percent of mortgage holders. As discussed, much of the very large percentage gains in liquid balances for renters are likely due to renters having lower initial savings. In fact, Figure 5, which reflects dollar changes in liquid asset levels, shows larger increases for mortgage holders. In addition to the large increase in savings in mid-April due to the arrival of stimulus checks (Figure 5), 17 percent of those with an increase in savings received direct-deposited UI compared to 14 percent of those with stable or decreasing savings.

However, except at the highest end, the distribution of changes in liquid balances is not very different for renters and mortgage holders (Figure 6). Even for the renters with the largest percent gains, since they had a lower base prior to the pandemic, these percent gains translate to smaller increases in dollar terms. So, the relative position for renters compared to mortgage holders did not change significantly despite government support in the form of UI and EIP checks.

Furthermore, a significant fraction of renters and mortgage holders still lost savings during the pandemic. Twenty-four percent of renters saw their savings decrease by more than 10 percent during COVID despite very generous government supports. An identical fraction of mortgage holders experienced similar changes to their liquid balances, but they had a higher balance to start with and the majority of these households had mortgage forbearance available as a backup. And indeed, 10 percent of those with the largest drops in savings opted into mortgage forbearance compared to 6 percent of the rest of the population.

Figure 6: More renters experienced large gains in liquid balances compared to mortgage holders, however a significant portion still experienced liquid balance decreases of more than 10 percent.

Distribution of changes in liquid balances

For -100% to -50%: Renters (2018-2019) have 9% Change in Liquid Balances. Renters (2019-2020) have 6% Change in Liquid Balances. Mortgage Holders (2018-2019) have 8% Change in Liquid Balances. Mortgage Holders (2019-2020) have 5% Change in Liquid Balances.

For -50% to -10%: Renters (2018-2019) have 25% Change in Liquid Balances. Renters (2019-2020) have 18% Change in Liquid Balances. Mortgage Holders (2018-2019) have 27% Change in Liquid Balances. Mortgage Holders (2019-2020) have 19% Change in Liquid Balances.

For -10% to 10%: Renters (2018-2019) have 17% Change in Liquid Balances. Renters (2019-2020) have 15% Change in Liquid Balances. Mortgage Holders (2018-2019) have 20% Change in Liquid Balances. Mortgage Holders (2019-2020) have 17% Change in Liquid Balances.

For 10% to 50%: Renters (2018-2019) have 22% Change in Liquid Balances. Renters (2019-2020) have 23% Change in Liquid Balances. Mortgage Holders (2018-2019) have 23% Change in Liquid Balances. Mortgage Holders (2019-2020) have 26% Change in Liquid Balances.

For greater than or equal to 50%: Renters (2018-2019) have 27% Change in Liquid Balances. Renters (2019-2020) have 38% Change in Liquid Balances. Mortgage Holders (2018-2019) have 19% Change in Liquid Balances. Mortgage Holders (2019-2020) have 31% Change in Liquid Balances.

Source: JPMorgan Chase Institute

01

Implications

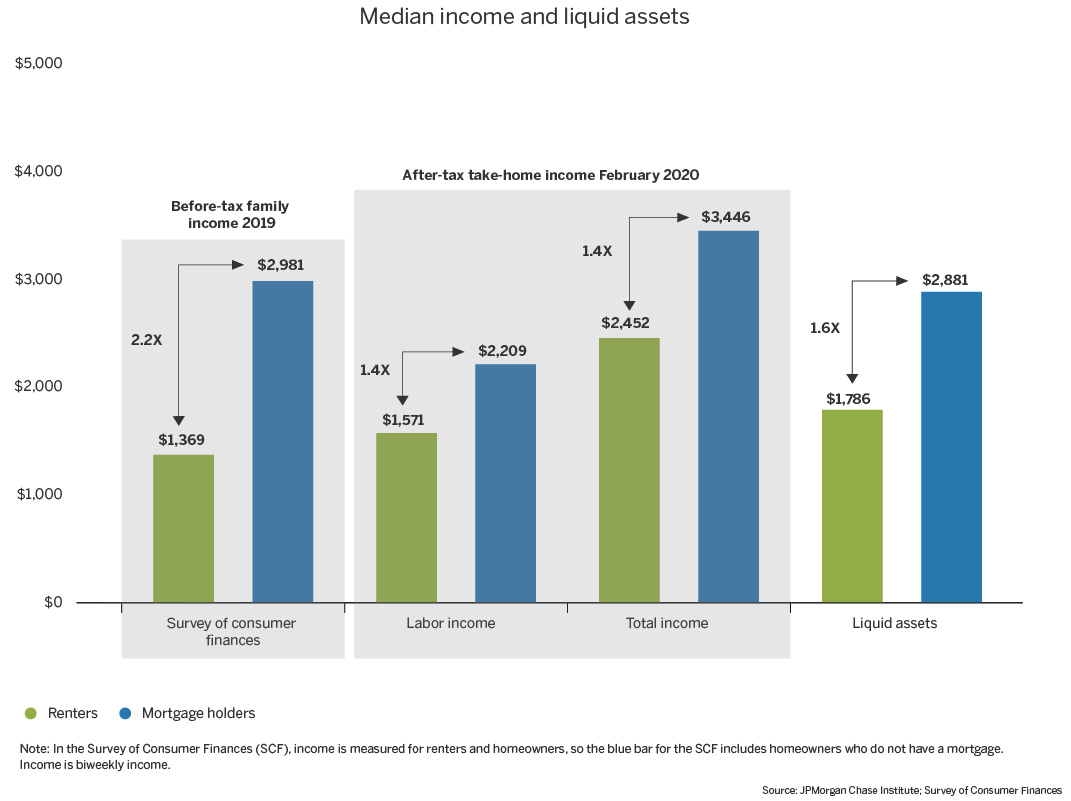
Compared to mortgage holders, renters were on weaker financial footing prior to the pandemic and experienced greater job losses and labor income declines during the pandemic.

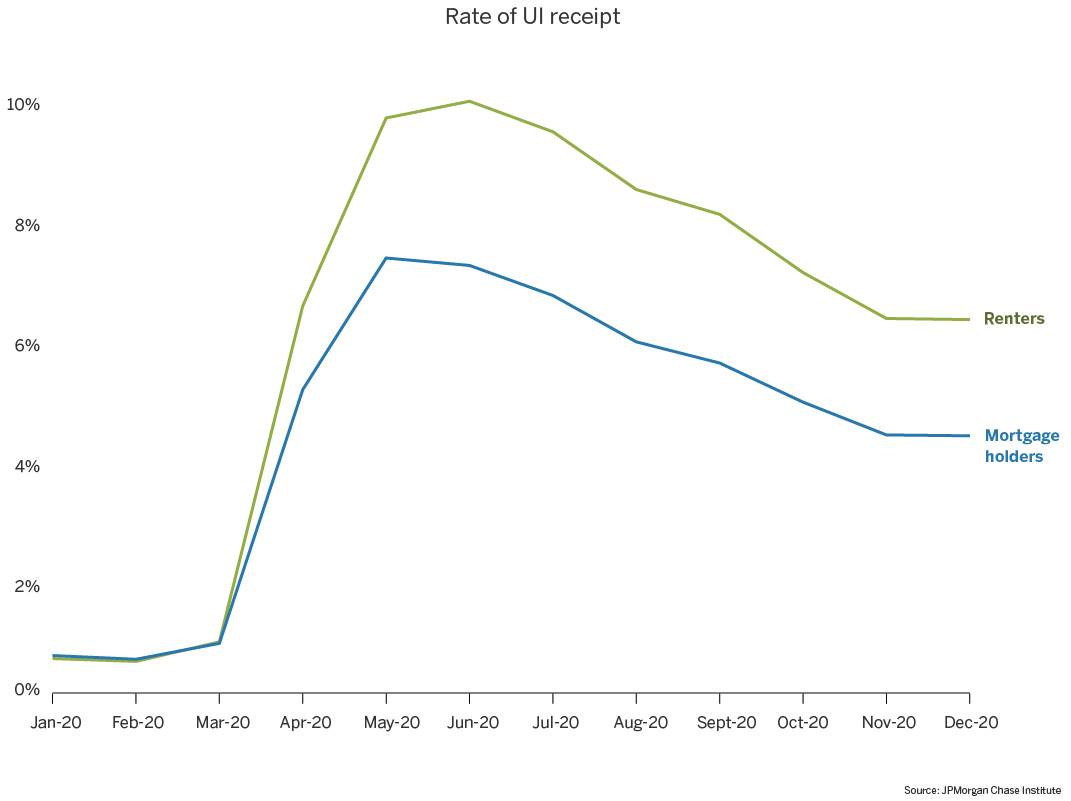
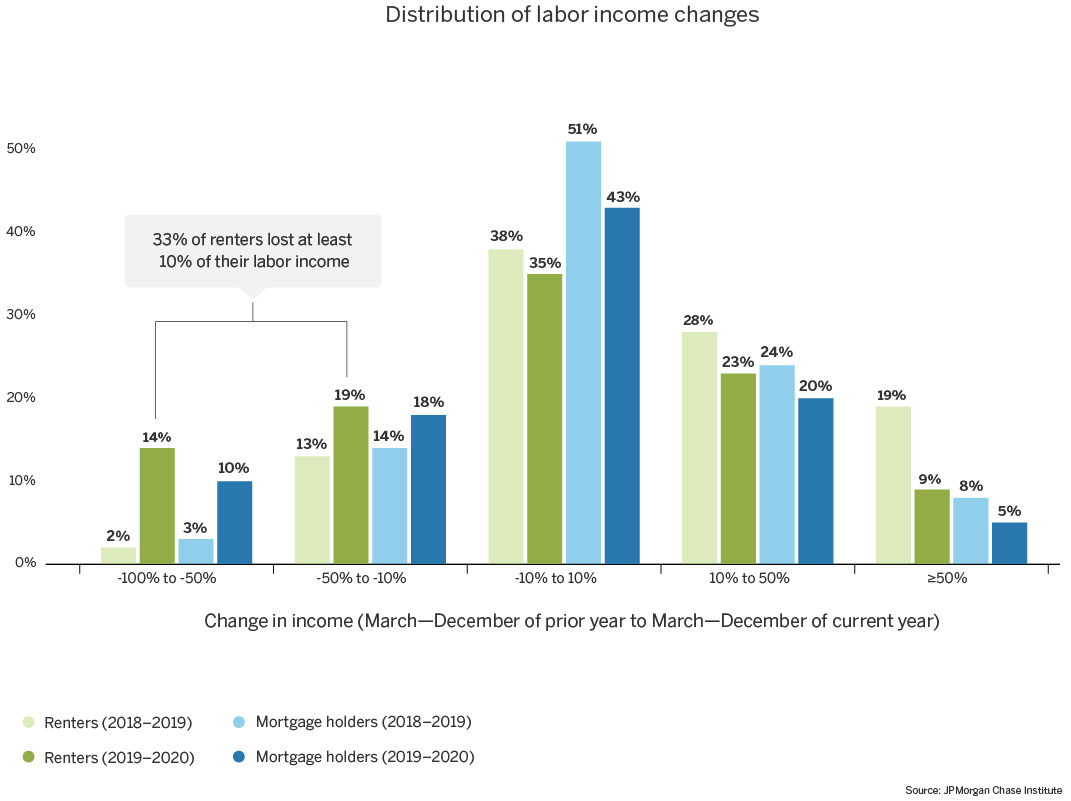
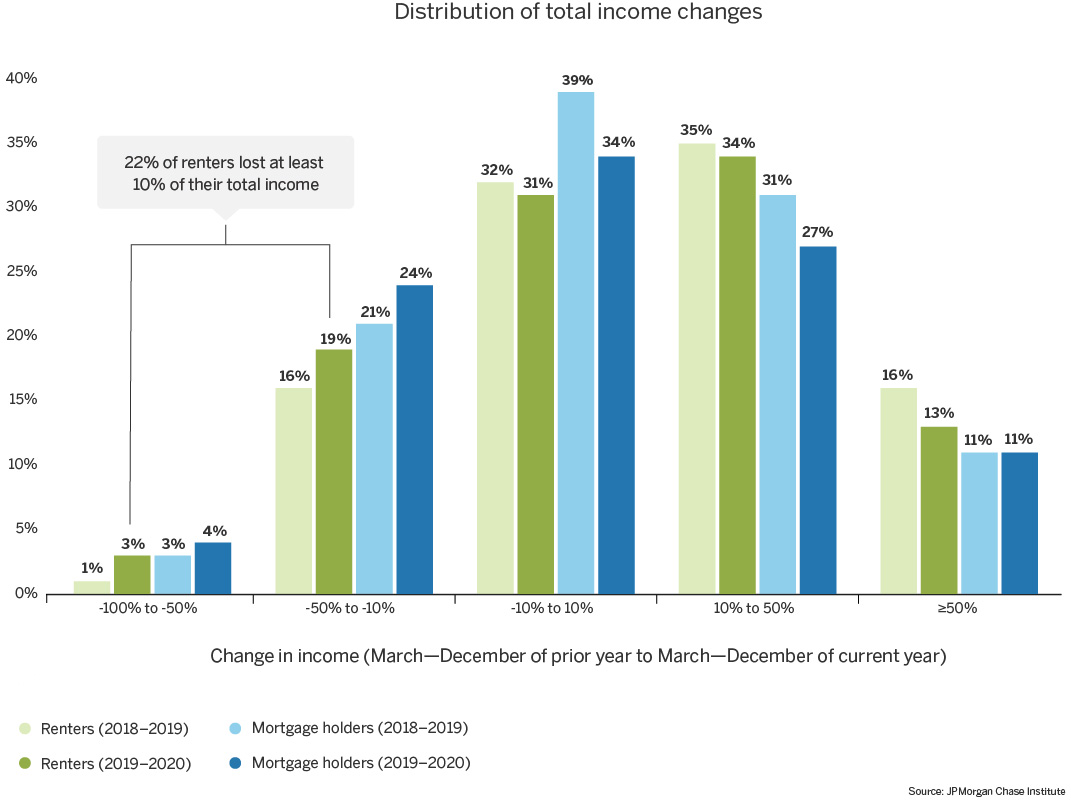
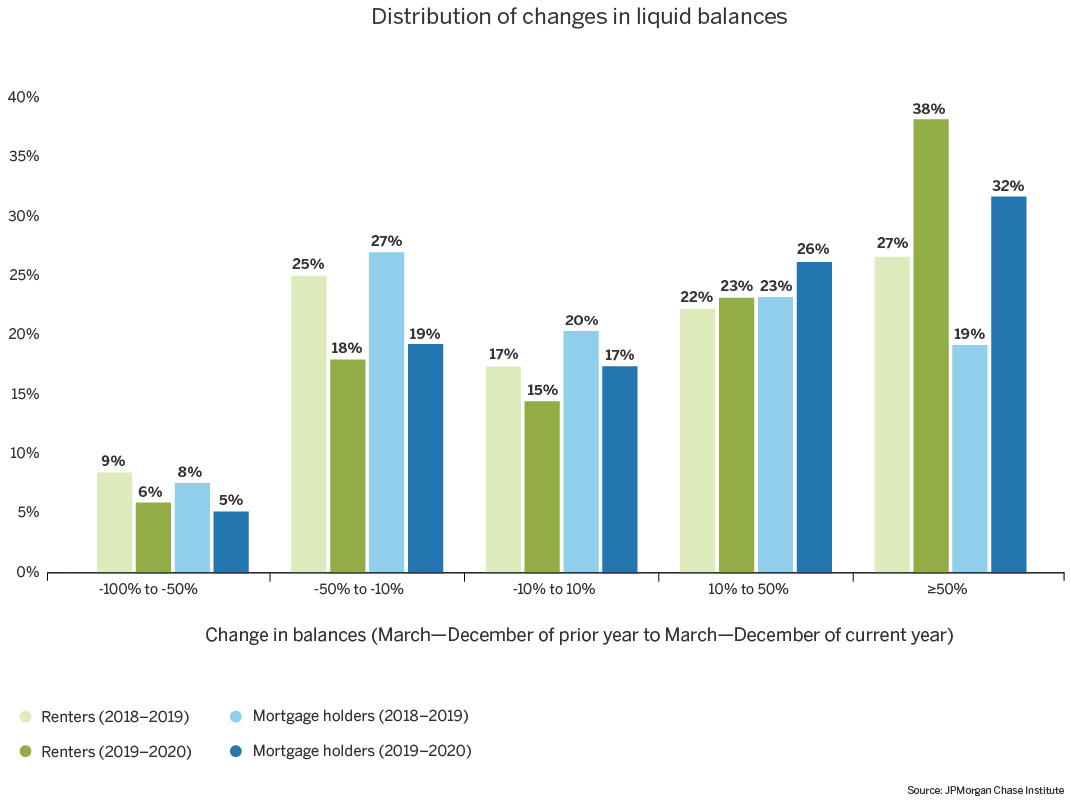
Government statistics suggest that renters were more likely to have suffered financially during COVID because of the industries in which they are concentrated. Our data on UI receipt suggests that renters did in fact experience more job loss and our income data show that renters were more likely to have suffered major loss of labor income relative to mortgage holders and relative to their own income patterns pre-COVID. Even though generous expansions of UI and EIP checks increased total income for many renters, more than one in five saw their total income decrease by more than 10 percent. Finally, renters entered the pandemic with much lower levels of savings and their relative position did not improve meaningfully during the pandemic despite government stimulus programs as they depleted more of the stimulus-generated additional savings by the end of the year than mortgage holders. Importantly, our results should be interpreted with the caveat that these results likely represent a “best case scenario” for renters since our sample of renters skew higher in income and the gap between renters and mortgage holders in our sample is smaller than exists for the general population. An analysis that includes more low-income renters than our data can currently reach—especially those that are underbanked or already struggling with housing payments—would likely show worse financial outcomes for renters.

These results point to renters needing more government support than they received in 2020, which they are on track to receive with the passage of the American Rescue Plan Act of 2021, so it will be important to continue monitoring the financial outcomes of renters in the coming months.

While government support in the form of expanded UI and EIP checks generally boosted total income and savings, a significant fraction of renters still suffered moderate to severe losses in total income and savings. These renters may have not qualified for UI because they lost income but did not lose their jobs or, for some higher-income renters, UI may not have replaced all of their income.

A similar fraction of mortgage holders also suffered similar total income and savings losses. Yet these mortgage holders who needed help beyond UI and EIP largely had access to a year of mortgage forbearance while there was no such widely available and easily accessible program for renters until the Consolidated Appropriations Act of 2021 passed in December 2020, which established a $25 billion Federal Emergency Rental Assistance Program for state and local governments.

Moreover, lenders made it easy for homeowners to opt into mortgage forbearance, while renters faced red tape when accessing rental assistance programs and landlords eager to find paying tenants. Having learned from the Great Recession and various forbearance programs enacted for natural disasters, policymakers and mortgage servicers made it nearly frictionless for mortgage holders to ask for forbearance with proactive outreach efforts and no documentation requirements. Related JPMC Institute research (Farrell et al, 2020) shows that the CARES Act mortgage forbearance program helped homeowners in need during the pandemic with little evidence of widespread moral hazard despite the lack of documentation requirements. On the other hand, while some landlords undoubtedly passed on the relief they received to their renters and others worked out flexible payment plans with renters on an individual basis, generally speaking they had greater incentive, when the patchwork of eviction moratoria allowed, to evict tenants that were unable to pay in the hopes of finding one that could. And in order to apply for the Emergency Rental Assistance Program, renters needed to fill out forms and upload documents proving unemployment or income loss, risk of homelessness or housing instability, and income that did not exceed 80 percent of area median income (AMI).25, 26,

Providing renters with more financial support could take many forms.

The need for rent relief may well exceed the $25 billion available for the Emergency Rental Assistance Program, which the expected passage of the American Rescue Plan Act would help to address. Our results suggest potentially significant financial need among renters beyond UI and stimulus checks. Other studies have estimated that back rent may add up to somewhere in the range of $34 to $70 billion.27, 28, 29 And the Census Pulse Survey for January 2021 provides evidence of ongoing housing insecurity with 18 percent of households indicating they are behind on rent, 13 percent having no confidence that they will be able to pay rent next month, and 14 percent reporting that they are very likely to be evicted in the next two months.30, 31 Furthermore, the Emergency Rental Assistance program is only available to families making less than 80 percent of AMI32 and our results show that even higher-income renters captured by our data exhibited significant financial need during COVID. What can be done about this? The design of additional assistance programs to address the needs of renters ought to take into the following considerations: 

  • Effective and administratively feasible targeting: Assistance needs to strike a balance between targeting renters most in need and making assistance easily accessible. Our data show that renters had less stable labor income, both pre-COVID and during the pandemic. Expanding eligibility for UI post-COVID and identifying additional ways, beyond UI, to deliver relief to families who have experienced income losses may provide relief to a wider range of workers, many of whom may be renters. These could include temporary expansions in other means-tested safety net programs, including cash assistance (TANF), in-kind supports (e.g. SNAP and Medicaid), and tax credits (e.g. EITC and Child Tax Credits). 
  • The solvency of landlords: Though popular, government mandated rent “cancellation” or forbearance programs are difficult to implement given the highly fragmented and less capitalized market of landlords. In contrast, the federal government insures a large share of mortgages and imposes capital requirements on financial institutions engaged in home lending.33 Additionally, mortgage holders are expected to eventually catch up on their payments over the course, or at the end, of their loans. Proposals to provide rental assistance or forbearance need to address the downstream impacts on landlords. This is also true for extended eviction moratoria as, without eviction as an option, landlords cannot recoup rent on their units. Of course, if landlords have opted into forbearance, as 12 percent have34, they should be required to pass on some of the protection to their renters.35
  • Macroeconomic impacts: Well designed, targeted assistance programs could act as a form of economic stabilizer by enabling renters to maintain their level of consumption. On the other hand, there could be potential macroeconomic effects of dramatic increases in government spending, including the risk of rising inflation. 
  • Availability of affordable housing: Even before COVID, the United States was facing a severe affordable housing crisis with many households experiencing high degrees of housing insecurity. Efforts to increase the supply of affordable housing could address current and future needs for rental assistance.36
  • Ways to support the financial health of renters more generally: Previous JPMCI research examined income volatility and the potential role for policymakers and businesses to help families smooth their income (Farrell et al, 2019). One possibility is taking advantage of months with income spikes to save for a rainy day fund via deductions for benefits, tax withholdings, and pre-tax savings accounts rather than setting aside a constant fraction each month. Also, policymakers could consider the possible benefits of providing access to tax withholdings during the year or distributing tax refunds or the Earned Income Tax Credit periodically throughout the year.

In conclusion, supporting the financial health of renters both during and after COVID would promote greater housing security and economic resilience of lower-income families and their landlords.

Sources

Cox, Natalie, et al. 2020. “Initial Impacts of the Pandemic on Consumer Behavior: Evidence from Linked Income, Spending, and Savings Data.” Brookings Papers on Economic Activity.

Farrell, Diana, Fiona Greig, and Chenxi Yu. 2019. “Weathering Volatility 2.0: A Monthly Stress Test to Guide Savings.” JPMorgan Chase Institute. https://institute.jpmorganchase.com/ institute/research/household-income-spending/report-weathering-volatility-2.0.

Farrell, Diana, Fiona Greig, and Chen Zhao. 2020. "Did Mortgage Forbearance Reach the Right Homeowners? Income and Liquid Assets Trends for Homeowners during the COVID-19 Pandemic." JPMorgan Chase Institute.

Goodman, Laurie, Michael Neal, and Jung Hyun Choi. 2020. “Can Unemployment Numbers Predict the Number of Mortgages That Will Go into Forbearance?” Urban Institute.

Larrimore, Jeff, and Erin Troland. 2020. "Improving Housing Payment Projections during the COVID-19 Pandemic," FEDS Notes. Washington: Board of Governors of the Federal Reserve System. https://doi.org/10.17016/2380-7172.2772.

Zhang, David Hao. 2016. "How do people pay rent?" Federal Reserve Bank of Boston.

Acknowledgements

We thank our research team, specifically Malu Menon for their hard work and contributions to this research. Additionally, we thank Anna Garnitz and Sruthi Rao for their support. We are indebted to our internal partners and colleagues, who support delivery of our agenda in a myriad of ways, and acknowledge their contributions to each and all releases.

We are also grateful for the invaluable constructive feedback we received from external experts and partners, including Martha Gimbel, Laurie Goodman, Katherine Reynolds, Jung Choi, Doug Ryna, Ingrid Gould Ellen, Katherine O’Regan, and Amy Ganz. We are deeply grateful for their generosity of time, insight, and support.

We would like to acknowledge Jamie Dimon, CEO of JPMorgan Chase & Co., for his vision and leadership in establishing the Institute and enabling the ongoing research agenda. We remain deeply grateful to Peter Scher, Head of Corporate Responsibility, Heather Higginbottom, President of the JPMC PolicyCenter, and others across the firm for the resources and support to pioneer a new approach to contribute to global economic analysis and insight.

References

1.

https://www.pewsocialtrends.org/2020/09/24/economic-fallout-from-covid-19-continues-to-hit-lower-income-americans-the-hardest/

2.

https://www.federalreserve.gov/publications/2020-update-economic-well-being-of-us-households-employment.htm

3.

https://libertystreeteconomics.newyorkfed.org/2021/02/some-workers-have-been-hit-much-harder-than-others-by-the-pandemic.html

4.

See section 4022: https://www.congress.gov/116/plaws/publ136/PLAW-116publ136.pdf

5.

https://financialservices.house.gov/uploadedfiles/era_1-pgr_12.20.20.pdf

6.

The American Rescue Plan Act of 2021 was in the final stages of passage during the writing of this report.

7.

https://www.kslaw.com/pages/a-survey-of-restrictions-on-eviction-and-foreclosure-remedies

8.

We leave homeowners who do not have a mortgage out of our analysis because, for the purposes of this analysis, we wanted to compare renters to a population that also had a monthly housing payment.

9.

Using this methodology, we find an implied homeownership rate of roughly 75 percent, which is higher than the national homeownership rate 64-65 percent in 2019. The discrepancy may be due to the sample (successful credit card applicants) being higher income than the general population. See: https://fred.stlouisfed.org/series/RHORUSQ156N

10.

We identify rent payments by searching for the word “rent” in transaction strings while excluding transactions that are likely to be auto rentals, vacation rentals, or other non-housing rentals. We also include payments to common rent platforms. By repeatedly sampling 100 transactions tagged using our methodology, we manually assessed each transaction and found a 1-2 percent false positive rate.

11.

https://www.bostonfed.org/home/publications/research-data-report/2016/how-do-people-pay-rent.aspx

12.

Income as measured in the SCF is likely somewhere between the measures of labor income (mostly direct deposit income) and total income (all checking account inflows minus transfers from investment, savings, and other checking accounts) in JPMCI data.

13.

In the SCF, income is measured for renters and homeowners, not just mortgage holders.

14.

UI can be received via direct deposit or pre-paid debit card. We only observe UI when a household receives it via a direct deposit into their Chase deposit account, so our UI receipt rate is an underestimate of the true rate of UI receipt. For the purposes of this comparison, we are assuming that the fraction of UI recipients who chose to have their UI payment direct deposited into their Chase account is the same across the two groups.

15.

See Tables 1a (homeowners) and 1b (renters) under housing: https://www.census.gov/data/tables/2021/demo/hhp/hhp23.html

17.

Another issue is that Goodman, et al. (2020) examine data through 2018 whereas our data start in January 2020 right before the pandemic when the labor market was especially tight with the unemployment rate at 3.5 percent.

18.

Labor income includes inflows that are generally easy to identify as paychecks (ex. direct deposit), and is biased against certain types of labor income that are more irregular or not paid via direct deposit.

19.

This could happen, for example, when one person in a joint account becomes unemployed while the earnings of the other increases substantially.

20.

Total income is defined by total inflows into checking accounts minus transfers from investment, savings, and other checking accounts.

21.

Indeed, this is consistent with prior JPMC Institute research, which uses simulations of COVID government policies to show that income would increase the most for those with the lowest income. See: https://www.brookings.edu/wp-content/uploads/2020/06/Cox-et-al-conference-draft.pdf

22.

Ganong, Noel and Vavra (2020) estimate that with the $600 supplement jobless benefits replaced 145 percent of prior earnings for the median jobless worker.

24.

Liquid balances are measured as checking account balances.

25.

https://home.treasury.gov/policy-issues/cares/emergency-rental-assistance-program

26.

Since the American Rescue Plan Act of 2021 has not been finalized as of the writing of this report, we do not yet know the final requirements associated with the likely additional $27 billion of rental assistance that legislation would provide.

28.

https://www.urban.org/policy-centers/research-action-lab/projects/sizing-federal-rental-assistance

29.

https://www.moodysanalytics.com/-/media/article/2021/averting-an-eviction-crisis.pdf

30.

https://www.census.gov/data/tables/2021/demo/hhp/hhp23.html

31.

Economists at the Federal Reserve have estimated that only 35.8 percent of renters with no confidence of paying on time will actually be able to pay the next month’s rent. In contrast, 70.8 percent of those with slight confidence, 86.0 percent of those with moderate confidence, and 98.1 percent of those with high confidence will pay next month’s rent. See: https://www.federalreserve.gov/econres/notes/feds-notes/improving-housing-payment-projections-during-the-covid-19-pandemic-20201020.htm

32.

https://financialservices.house.gov/uploadedfiles/era_1-pgr_12.20.20.pdf

33.

However, many landlords would have had access to mortgage forbearance if they had a mortgage on the rental property

34.

https://www.urban.org/urban-wire/black-and-hispanic-landlords-are-facing-great-financial-struggles-because-covid-19-pandemic-they-also-support-their-tenants-higher-rates

35.

https://www.housingwire.com/articles/fhfa-extends-multifamily-forbearance-through-march-31/

36.

https://www.urban.org/urban-wire/five-strategies-help-americas-renters

Authors

Fiona Greig

Former Co-President

Chen Zhao

Housing Finance Research Lead

Alexandra Lefevre

JPMorgan Chase Institute, Consumer Research Associate