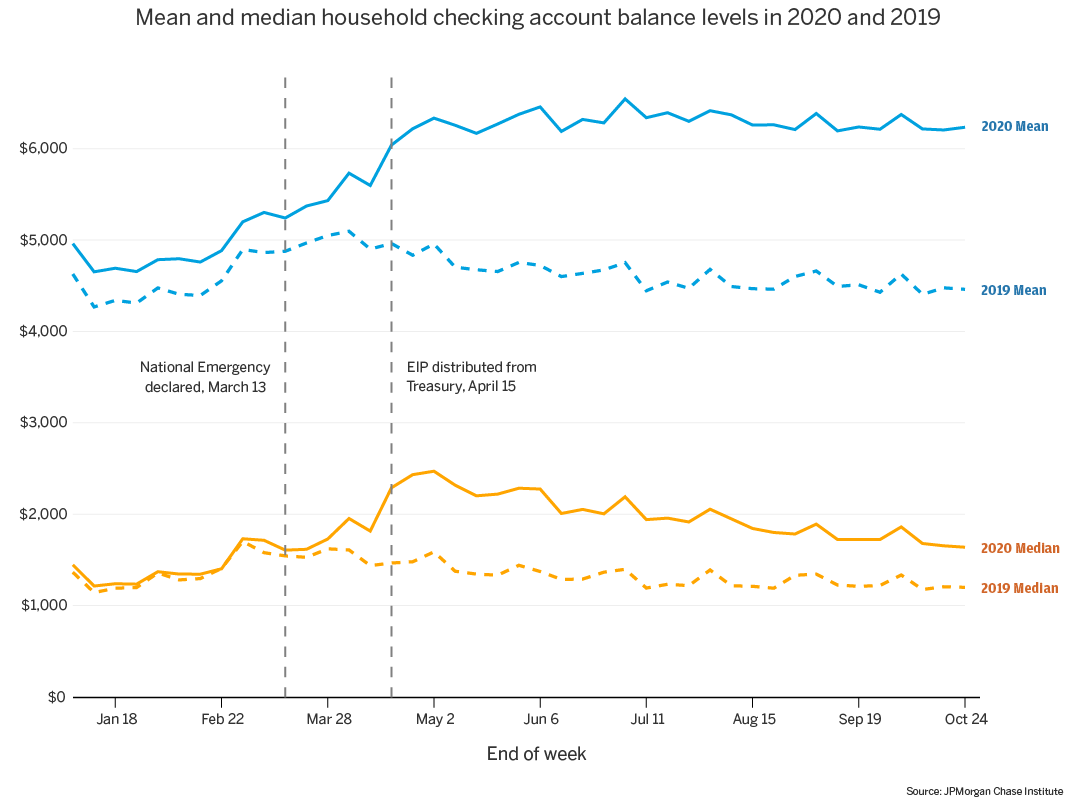
Figure 1: Mean and median household balance levels in 2020 and 2019
Months after the declaration of national emergency on March 13, 2020, the COVID-19 pandemic continues to impact the economy and household finances in dramatic and unprecedented ways. Household spending, which initially fell sharply during the shutdowns in March and April (Cox et al, 2020), has slowly recovered. The most financially vulnerable families have been impacted the most, with lower-income earners and Black and Latinx workers facing the highest job losses. The government responded with the massive CARES Act to bolster income and economic activity through stimulus checks, expanded unemployment benefits, and the Payroll Protection Program. Prior research has demonstrated the importance of liquid savings for maintaining financial resilience during times of uncertainty (Farrell et al, 2019; Farrell et al, 2020). What has been the net effect of these various forces on families’ liquid savings? Aggregate statistics suggest an increase in the deposits of households and nonprofits as well as commercial banks since March, 2020, but what does the picture look like for the median household and, in particular, low-income households?
We analyze trends in checking account balances between 2019 and October 2020 to understand how the pandemic and these government interventions have affected household financial outcomes across the income spectrum. As a highly liquid asset, checking accounts often serve as a family’s first line of defense to shield against financial shocks. It is also important to provide a distributional, household-centric view of account balance trends, which might be masked by aggregate public statistics on deposit levels. We address these questions via a unique data asset based on the daily balances of Chase personal checking accounts. The data asset follows the account balances of 1.8 million families across the U.S. who have been active checking account users since December 2018.[1]
Measures of Center: Mean vs. Median
We use two metrics for assessing balances in the report:
Both metrics are used to help us understand the balance of a typical family in our sample. We use the mean as a starting point, to enable comparisons with other publicly available data which rely on means. However, the use of means can be misleading. This is often the case where distributions tend to exhibit positive skew (a situation where the majority of observations fall within a certain range of values, and a minority of large outliers are also present). In this situation, the mean will be inflated by the outliers, and may not reflect the balance of a typical family. The median, however, is not sensitive to outliers or positive skew. It is therefore a useful additional measure for assessing checking account balances and other financial outcomes.
Figure 1 shows the trajectories of mean and median checking account balances over the course of 2019 and 2020. Both measures show large balance increases in April of 2020, a departure from seasonal trends in 2019. This account balance growth begins in early April, prior to the arrival of the Economic Impact Payments, initially driven by the steep declines in consumer spending in March and April during the shutdowns (Cox et al., 2020). Balances then increase steeply after April 15, when families started receiving Economic Impact Payments.[2] Mean balances remain elevated through the summer months, while median balances show a clear downward trend both in absolute terms and relative to 2019 trends. Compared with 2019, median balances were up by about $900 at their highest point this spring. By the end of October, those balance cushions relative to the prior year had decreased to roughly $450. Put differently, by the end of September, median balances had lost 50 percent of the initial balance gains in April.
Figure 1: Mean and median household balance levels in 2020 and 2019

On a year-over-year percent change basis, means and medians show different trajectories. The initial balance increases in April was larger for medians (roughly 65 percent) than for means (30 percent). Year over year growth in mean household balances continued to rise from 30 percent after the April increase to roughly 40 percent by the end of the summer. Meanwhile, year over year percent change in median balance fell from a high point of roughly 70 percent in April to roughly 40 percent as of the end of October. Thus, despite their different trajectories, both mean and median balances remained roughly 40 percent elevated as of the end of October. Importantly, these different trajectories indicate that higher-balance households continued to hold and accumulate assets, while households at the lower end of the balance distribution experienced decreases in their asset base.
Figure 2: Year-over-year percent change of mean and median household balances
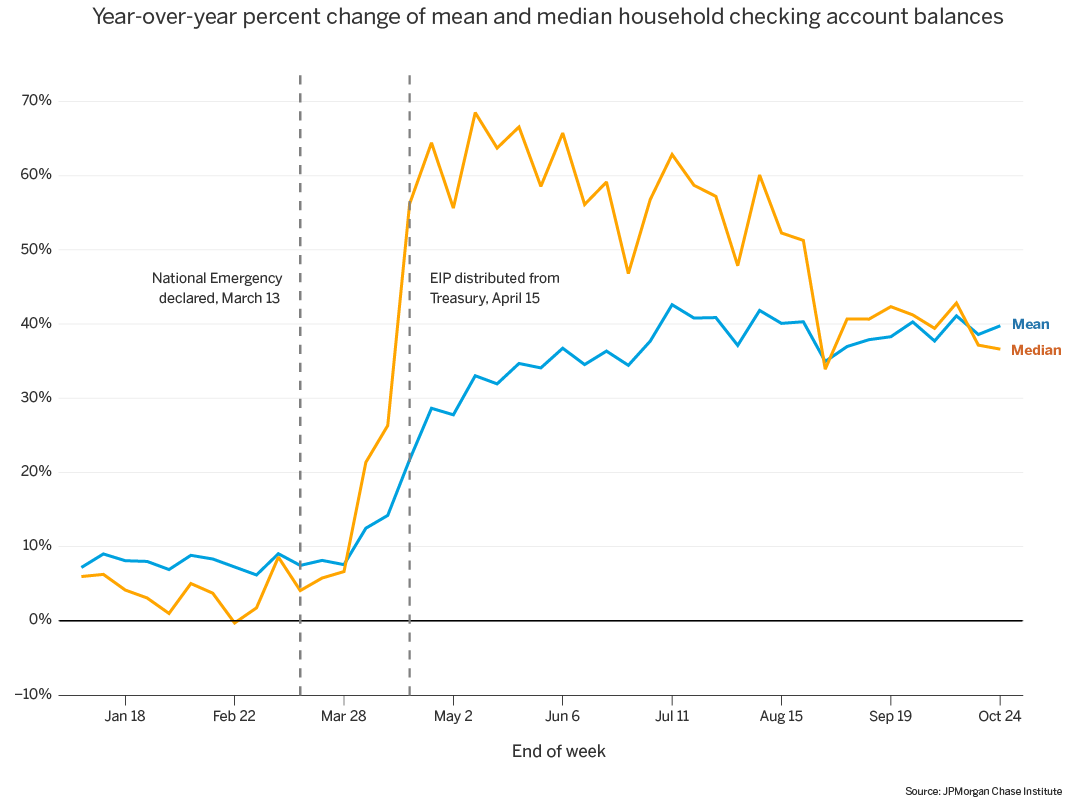
This distributional view marks a departure from what we can understand from aggregate national statistics. For instance, Federal Reserve System data show that deposits at all commercial banks are up by roughly 20 percent as of mid-May and have remained at that elevated level through the end of October. This aggregate statistic may suggest that most typical households have been able to maintain steady cash buffers throughout the summer and early fall. In contrast, while we also show that mean balances have been stable or rising since May, the median family has experienced a steady decline in their checking account balances since April. This reveals that the typical household is, in fact, steadily depleting their cash buffer, a pattern masked in aggregate statistics due to the influence of high-balance households in driving the means.
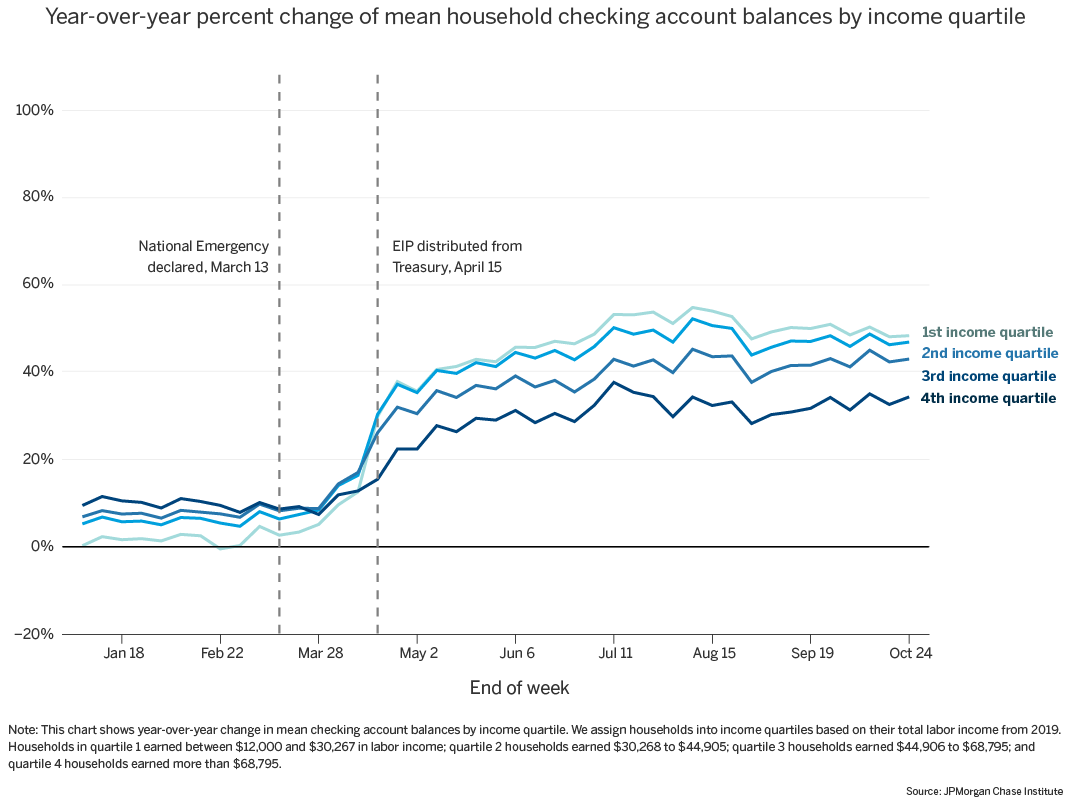
Separating year-over-year balance changes by income, high-income families experience the largest balance increases in dollar terms, while low-income families show the largest increases in percent terms.[3]Across income groups, we observe large percent increases in mean balances in April followed by slow increases throughout the summer and an eventual plateau. The lowest-income households experience the largest balance increases, ending around 50 percent up relative to 2019 by the end of October, compared with the highest-income households, with increases around 35 percent.
Figure 3: Year-over-year percent change of mean and median household balances by income quartile
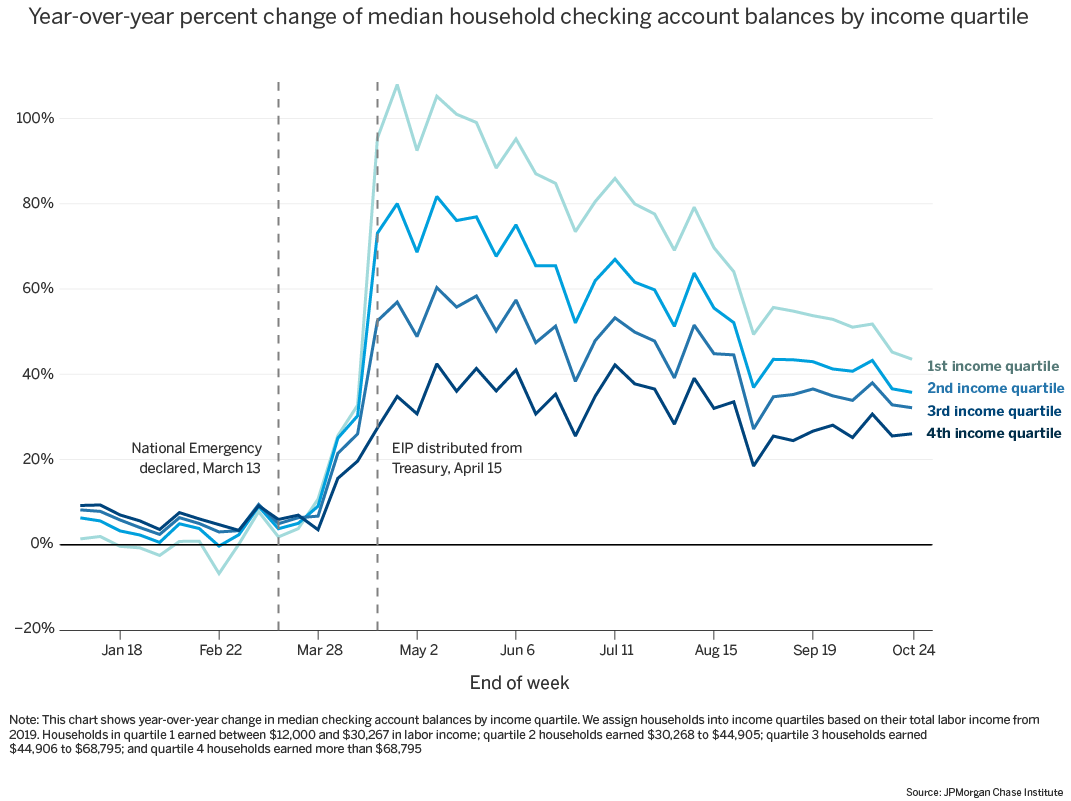
Median trends diverge from the mean picture most notably for low-income families. Initial balance increases in April were largest for lower-income families—roughly 100 percent for income quartile 1—but fell the most to roughly 45 percent in October for income quartile 1. In contrast, income quartile 4 experienced an increase in median balances in April of roughly 40 percent and a more modest decline to roughly 25 percent by the of October.
It is worth noting that, in dollar terms, these trends translate into larger absolute changes in balances for higher-income families. Compared with 2019, median balances for the highest-earning households were up by about $1,300 at their highest point this spring, compared with only $700 for the lowest earners. By the end of October, those balance cushions had decreased to roughly $800 for income quartile 4 and $250 for income quartile 1. Put differently, by the end of October, the highest earners had lost 38 percent of their gains relative to the prior year, while the lowest earners had lost 64 percent of their gains. If these trends continue, we would expect low-income families to deplete their account balance gains sooner than their high-earning counterparts.
Figure 4: Year-over-year dollar change of median household balances by income quartile
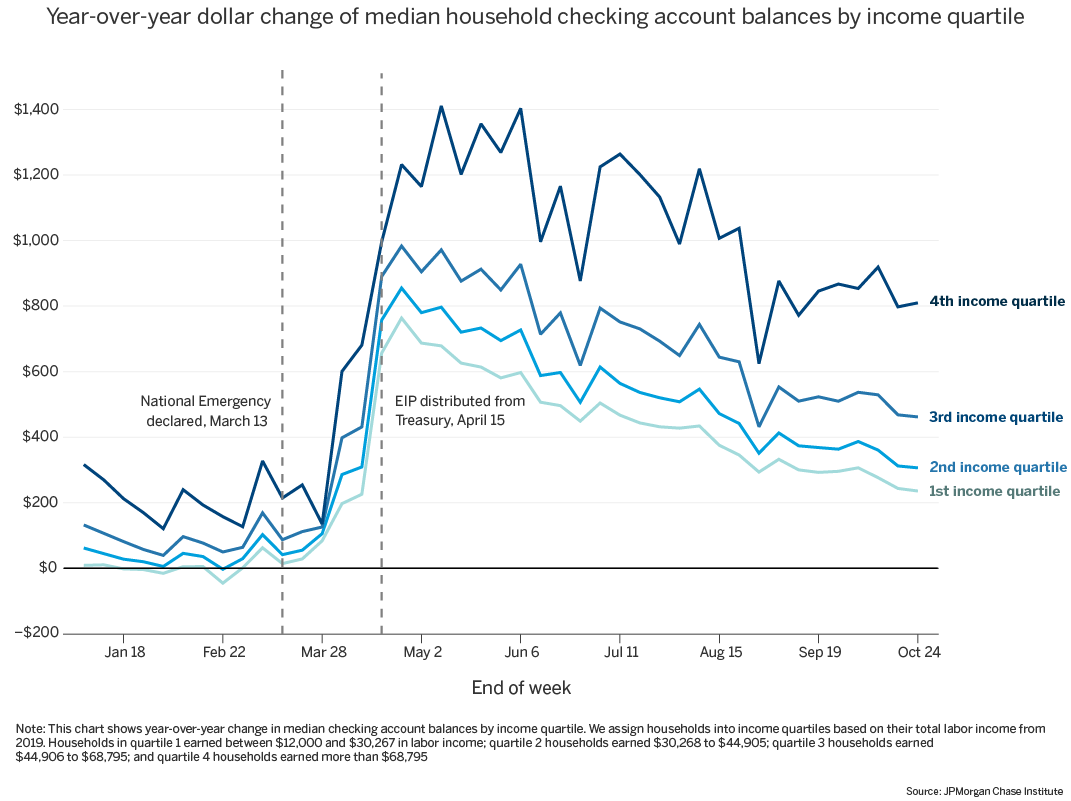
In summary, we find that lower income families experienced the most rapid decline in median checking account balances since a high watermark in April 2020. That said, within each income quartile, year-over-year mean balances are increasing. In other words, some families have continued to experience gains in balance levels relative to previous years; but the median family has experienced a decrease in their checking account balances, losing the year-over-year gains experienced earlier this year. Both metrics show balances that are elevated relative to the prior year, but the median’s decreasing trajectory suggest the April gains in balances may soon be depleted.
Several possible explanations could account for the different trajectories of mean and median balances. The first is elevated unemployment benefits. Low-income families experienced the greatest job losses and saw the largest proportional increase in unemployment benefits as a result of the $600 weekly benefit supplement under the CARES Act. As a result, many low-income families received more in unemployment benefits through the end of July than their pre-job-loss earnings. Although they increased their spending to a greater extent during this time, balances also increased among jobless workers receiving benefits. Unspent unemployment benefits likely resulted in larger proportional increases to checking account balances for low income families. This could result in diverging trends in mean and median balances if a small segment of the population (10 to 20 percent) were receiving elevated unemployment benefits while the median household was not.
A second explanation could be that a subset of the population—disproportionately higher-income families—experienced a decrease in expenses that exceeds any drop in income. Indeed, higher-income families exhibited a steeper decline and slower recovery in spending than low income families (Cox et al, 2020). Similarly, some families may have been able to take advantage of loan forbearance and stop making payments on their student loan, mortgage or other consumer debt, enabling them to preserve liquidity to a greater extent than the median family.[4]
A final, though less likely, possibility is that the trends in median total liquid assets actually mirror those of mean total liquid assets, but the median family is simply increasing the proportion of their savings outside of the checking account. Put differently, a subset of families could be leaving all of their cash in their checking accounts, pulling up the mean, while the median family, also seeing an increase in liquid assets, is decreasing the share of their liquid assets in their checking account. We think this is less likely because we observe very similar trends in total end of month balances across all Chase deposit accounts as we observe in end of month checking account balances. We cannot rule out this possibility, however, since we do not have a lens on total liquid assets for households.
Why it Matters:
The CARES Act resulted in elevated cash balances for families for much of 2020. As of October 2020, household checking account balances were still 40 percent higher than the same time last year. This means that families haven’t spent down all benefits yet. This cash likely enabled families to smooth their consumption through job loss and other income declines.
That said, median balances are falling, especially for low-income families. This suggests that the median family is spending down the cash buffer they accumulated during COVID-19. Moreover, if current trends continue, many families may become financially vulnerable in the coming months as relief programs expire. Supplemental unemployment benefits under the CARES Act ended in July, and most states have already exhausted FEMA monies made available for Lost Wages Assistance. Additional relief programs under the CARES Act are set to expire at the end of December, including loan forbearance provisions and the Pandemic Unemployment Assistance program, which expanded eligibility for unemployment benefits and represents the lion’s share of unemployment claims. Eventually, without further government support or significant labor market improvements, many families may exhaust their accumulated savings buffer, leaving them with a choice to cut spending or fall behind on debt or rent payments.
A distributional view of the household sector is crucial to understanding the financial outcomes of the typical family during the pandemic. Trends in median household balances underscore how relying on aggregate statistics alone may have masked important changes in financial outcomes of the typical family. Aggregate commercial bank deposits and mean household balances have been elevated and roughly stable since EIP disbursement in April. Medians, however, tell a different story: median balances were up 70 percent year-over-year at the time of EIP disbursement but have been falling since. Moreover, aggregate statistics on the deposits of households and nonprofits as well as commercial banks do not isolate the outcomes of households as distinct from other sectors. Indeed, a recent JPMorgan Chase Institute report on Small Business Expenses During COVID-19 shows year-over-year median balances remaining elevated from July through September, a departure from the median balance trends observed for households in this report. This demonstrates the importance of examining financial outcomes separately for households and other sectors of the economy, and trends in the distribution of those outcomes, in order to understand the impacts of the pandemic and policies on the typical family.
First and foremost, we thank Tanya Sonthalia and Yuning Liu for their outstanding analytical contributions to the report. We are additionally grateful to Therese Bonomo, Natalie Cox, Peter Ganong, Anna Garnitz, Bernard Ho, Sruthi Rao, Chen Zhao, Chris Knouss, and Preeti Vaidya for their support and contributions along the way.
This effort would not have been possible without the diligent and ongoing support of our partners from the JPMorgan Chase Consumer and Community Bank and Corporate Technology teams of data experts, including, but not limited to Brian Maddox, Kyung Cho-Miller, Michael Aguilar, Albert Raymond, Breann Zickafoose, Scott Dodds, Jay Mathuria, Roma Patel, Andrew Goldberg, Derek Jean-Baptiste, Anthony Ruiz, Suresh Devarar, Ravi Tummalapenta, Jeff Hamroff, Senthilkumar Gurusamy, and Melissa Goldman. The project, which encompasses far more than the report itself, also received indispensable support from our Internal partners in the JPMorgan Chase Institute team, including Elizabeth Ellis, Alyssa Flaschner, Carolyn Gorman, Courtney Hacker, Sarah Kuehl, Carla Ricks, Gena Stern, Parita Shah, Haley Dorgan, Mackenzie Smith, and Tremayne Smith.
Finally, we would like to acknowledge Jamie Dimon, CEO of JPMorgan Chase & Co., for his vision and leadership in establishing the Institute and enabling the ongoing research agenda. Along with support from across the firm—notably from Peter Scher, Max Neukirchen, Joyce Chang, Marianne Lake, Jennifer Piepszak, Lori Beer, Derek Waldron, and Judy Miller—the Institute has had the resources and support to pioneer a new approach to contribute to global economic analysis and insight.
We focus on a sample of account holders for whom their Chase checking account is likely to be their primary checking account and provide a good window into their financial life. Specifically, we select account holders who have had at least five transactions per month across their checking accounts between December 2018 and February 2020 and at least $12,000 in annual labor income.
Economic Impact Payments were $1,200 for a single adult and $2,400 for joint filers with an additional $500 for each child for households earning less than $75,000 per individual and $150,000 for married couples. Payments were reduced $5 for each $100 above these thresholds and individuals and married couples earning more than $99,000 and $198,000, respectively, were ineligible.
We assign households into income quartiles based on their total labor income from 2019.
The CARES Act provided for forbearance on all federally backed student loans and mortgages, and many servicers extended forbearance to debtors across a range of credit products.
Authors

Diana Farrell
Founding and Former President & CEO

Erica Deadman
Consumer Research Lead, JPMorganChase Institute

Fiona Greig
Former Co-President

Pascal Noel
Neubauer Family Assistant Professor of Finance at the University of Chicago Booth School of Business