
Source: JPMorgan Chase Institute
Latest news

An Ohio-based company is protecting first responders around the world
With support from JPMorganChase, Fire-Dex is providing protective equipment to firefighters in 100 countries and all 50 states.
Learn moreLatest news

The consistency of health insurance coverage in small businesses: industry challenges and insights
Learn moreLatest news

Veteran’s Unconventional Path to Landing her Dream Job in Tech
U.S. Army Veteran Ashley Wigfall transitioned to a civilian role and charted her path to technologist through mentorship and skills training at the JPMorgan Chase tech hub in Plano, Texas.
Learn more
Findings
Approximately two thirds of American families own a home, making the housing market an important source of economic activity and an important vehicle through which monetary policy is transmitted to the real economy. For most homeowners, their house is their most important source of wealth—an asset that can build in value as a mortgage is paid down. As such, homeowners may tap into this wealth—their home equity—when the need arises. Household behavior around the withdrawal of home equity has important implications for consumption at the macroeconomic level and for the efficacy of monetary policy. And, from a household finance perspective, liquidating home equity responsibly can play an important role in smoothing consumption when homeowners are faced with income disruptions or consumption spikes.
In this report, we use loan-level mortgage servicing data combined with administrative deposit account data to ask: to what extent does liquidating home equity boost consumer demand? We also examine the income dynamics around equity extraction in order to understand the role that a household’s financial situation may play in influencing their decision to extract equity from their home.
Most homeowners who cash-out refinanced switched into a longer loan with a lower rate but a higher monthly payment due to the new larger loan balance.
Among our cash-out refinance sample, we find that the largest group of homeowners ended up with a higher monthly payment despite having refinanced into a loan with a lower interest rate and longer term. This higher monthly payment was the result of withdrawing cash through a larger loan. Homeowners appeared to be prioritizing a need for a large amount of cash immediately over a lower monthly payment over time.
|
Pre-refinance |
Post-refinance |
Median difference |
Principal balance |
$144,769 |
$195,000 |
$46,429 |
Interest rate |
4.50% |
4.00% |
-0.38 pp |
Term (years) |
24.2 |
30.0 |
3.7 |
Monthly payment |
$881 |
$1,091 |
$125 |
Note: All values shown are medians. The median is calculated for each column separately so the median difference is not necessarily equal to the difference between the medians.
Source: JPMorgan Chase Institute
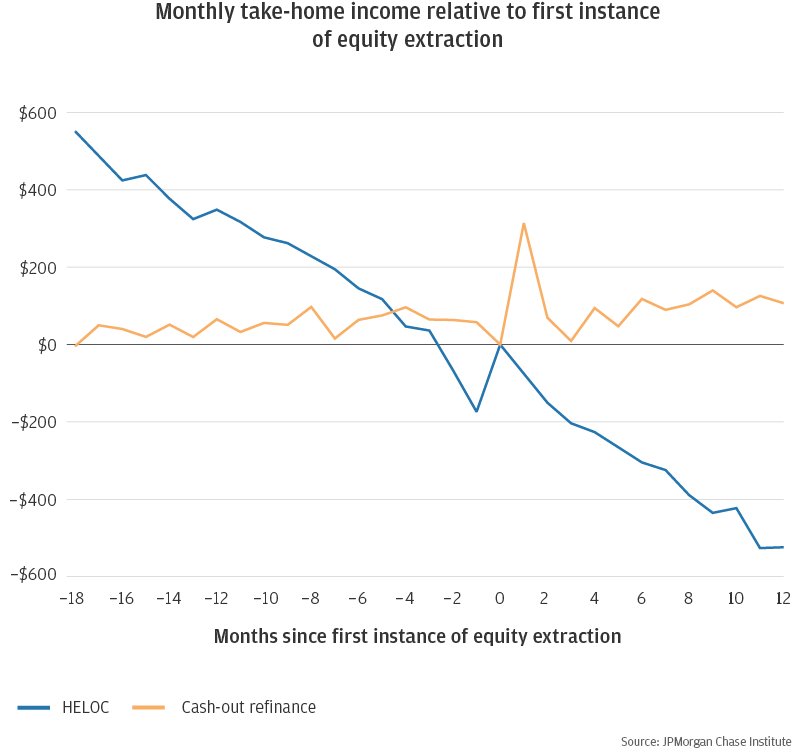
After controlling for secular trends, homeowners who obtained a cash-out refinance had no change in income whereas homeowners who extracted equity via a HELOC experienced declining income.
Using an event study framework that accounts for time trends, we find that those who drew equity via HELOCs experienced falling income around the time of a draw, whereas the path of income for those who cash-out refinanced was flat. These patterns help us to understand which home-owners use these different products to access home equity and under what circumstances—though it is important to note that these results are specific to a rising interest rate environment, where refinancing is less appealing than it is when interest rates are falling.
Source: JPMorgan Chase Institute
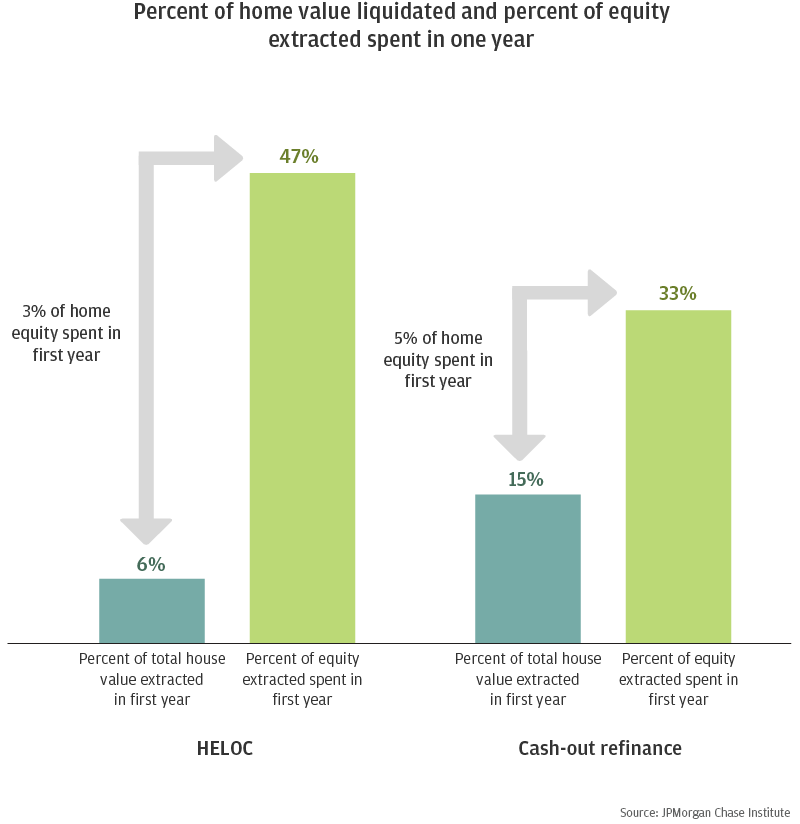
Spending spiked immediately upon receiving cash and quickly tapered to a level above baseline. Within a year, homeowners who cash-out refinanced spent 33 percent of the total equity liquidated (5 percent of home value) while homeowners with a HELOC spent 47 percent (3 percent of home value).
For both cash-out refinances and HELOCs, we find that consumption increased dramatically in the month that the first instance of home equity extracted hit the homeowner’s deposit account. Then, just as quickly, consumption settled to a level that is higher than baseline spending for both cash-out refinances (7 percent higher) and HELOCs (5 percent higher). After one year, the marginal propensity to consume (MPC) out of liquidated home equity was 33 percent for homeowners with a cash-out refinance and 47 percent for homeowners with a HELOC.
Source: JPMorgan Chase Institute
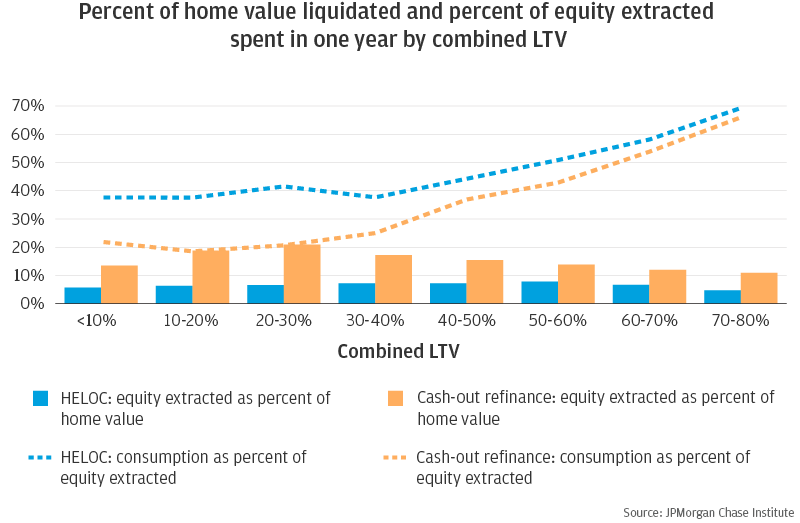
The largest consumption responses for both cash-out refinances and HELOCs were from younger homeowners and those with higher loan-to-value ratios.
For both cash-out refinances and HELOCs, those with higher combined loan-to-value (CLTV) ratios—that were closer to limits often required by lenders—and younger homeowners spent the largest fraction of the equity that was extracted. These homeowners are most likely to be credit-constrained and have lower income.
Source: JPMorgan Chase Institute
Implications
Our results suggest that policies facilitating access to home equity withdrawal could have significant macroeconomic effects because the consumption response to this liquidity from home equity is large.
For this reason, removing frictions and barriers to home equity withdrawal would improve the transmission of monetary policy to the real economy through both the housing wealth effect channel (as equity extraction is the mechanism that links home price appreciation to increased consumption) and the refinancing channel (as the spending response to additional cash on hand complements the response to lower monthly payments).
Significant barriers have kept equity withdrawal activity low since the Great Recession, including supply and demand factors (see discussion in Farrell et al. 2020) and well-documented frictions to refinancing. The current low levels of equity extraction activity compared to historically high levels implies that if some of these barriers were removed to allow for greater equity withdrawal, there could be large macroeconomic effects on consumption. Indeed, Black Knight estimates that as of the first quarter of 2020, there is $6.5 trillion of home equity that is available to be liquidated among homeowners with a mortgage.
The ability to liquidate wealth from one's home may be especially important for homeowners if they have substantial home equity but face economic uncertainty, as is the case during the COVID-19-induced recession. Households are sitting on historically large quantities of home equity and, in contrast to the Great Recession, have not seen their home equity positions erode thus far. Given the importance of cash flow dynamics and liquidity for consumption and staying current on debt payments, continued access to home equity could play an important role in helping homeowners weather economic downturns by providing needed liquidity. In the current interest rate environment, refinancing in particular could provide liquidity through lower monthly payments and/or a large infusion of cash. Of course, the benefits of liquidating home equity must be balanced against maintaining responsible lending practices, all the more difficult in an uncertain economic climate.
Understanding the inherent complexities the private sector faces in maintaining access to home equity withdrawal for homeowners, the public sector may want to consider government-backed alternatives that allow homeowners to access the illiquid wealth in their homes if experiencing income disruption in order to avoid more costly impacts to families or the overall mortgage market. A federally guaranteed home equity product or program similar to the Home Affordable Refinance Program (HARP) implemented after the housing market crash in the late 2000s could help more homeowners who would benefit from refinancing actually do so.
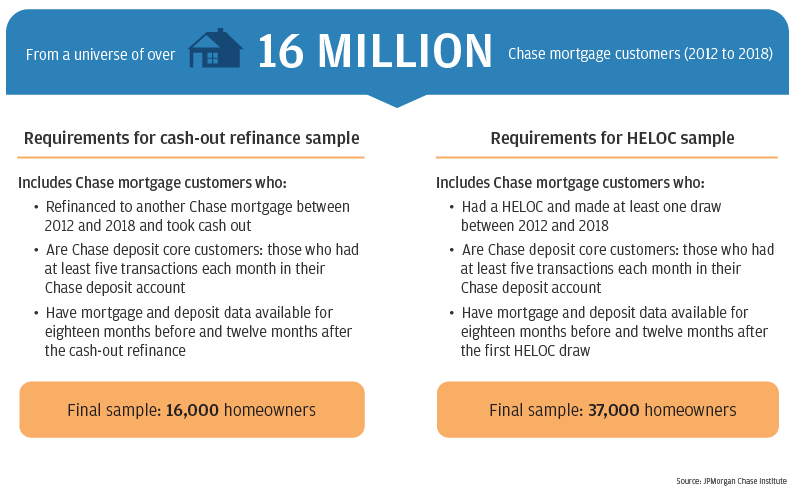
From a universe of more than 16 million Chase mortgage customers between 2012 and 2018, we created a sample of over 50,000 customers who (1) withdrew equity from their home through either a Chase-to-Chase cash-out refinance or a Chase home equity line of credit (HELOC) that they borrowed against, and (2) also had a Chase deposit account.
Source: JPMorgan Chase Institute
Authors

Diana Farrell
Founding and Former President & CEO

Fiona Greig
Former Co-President

Chen Zhao
Housing Finance Research Lead