

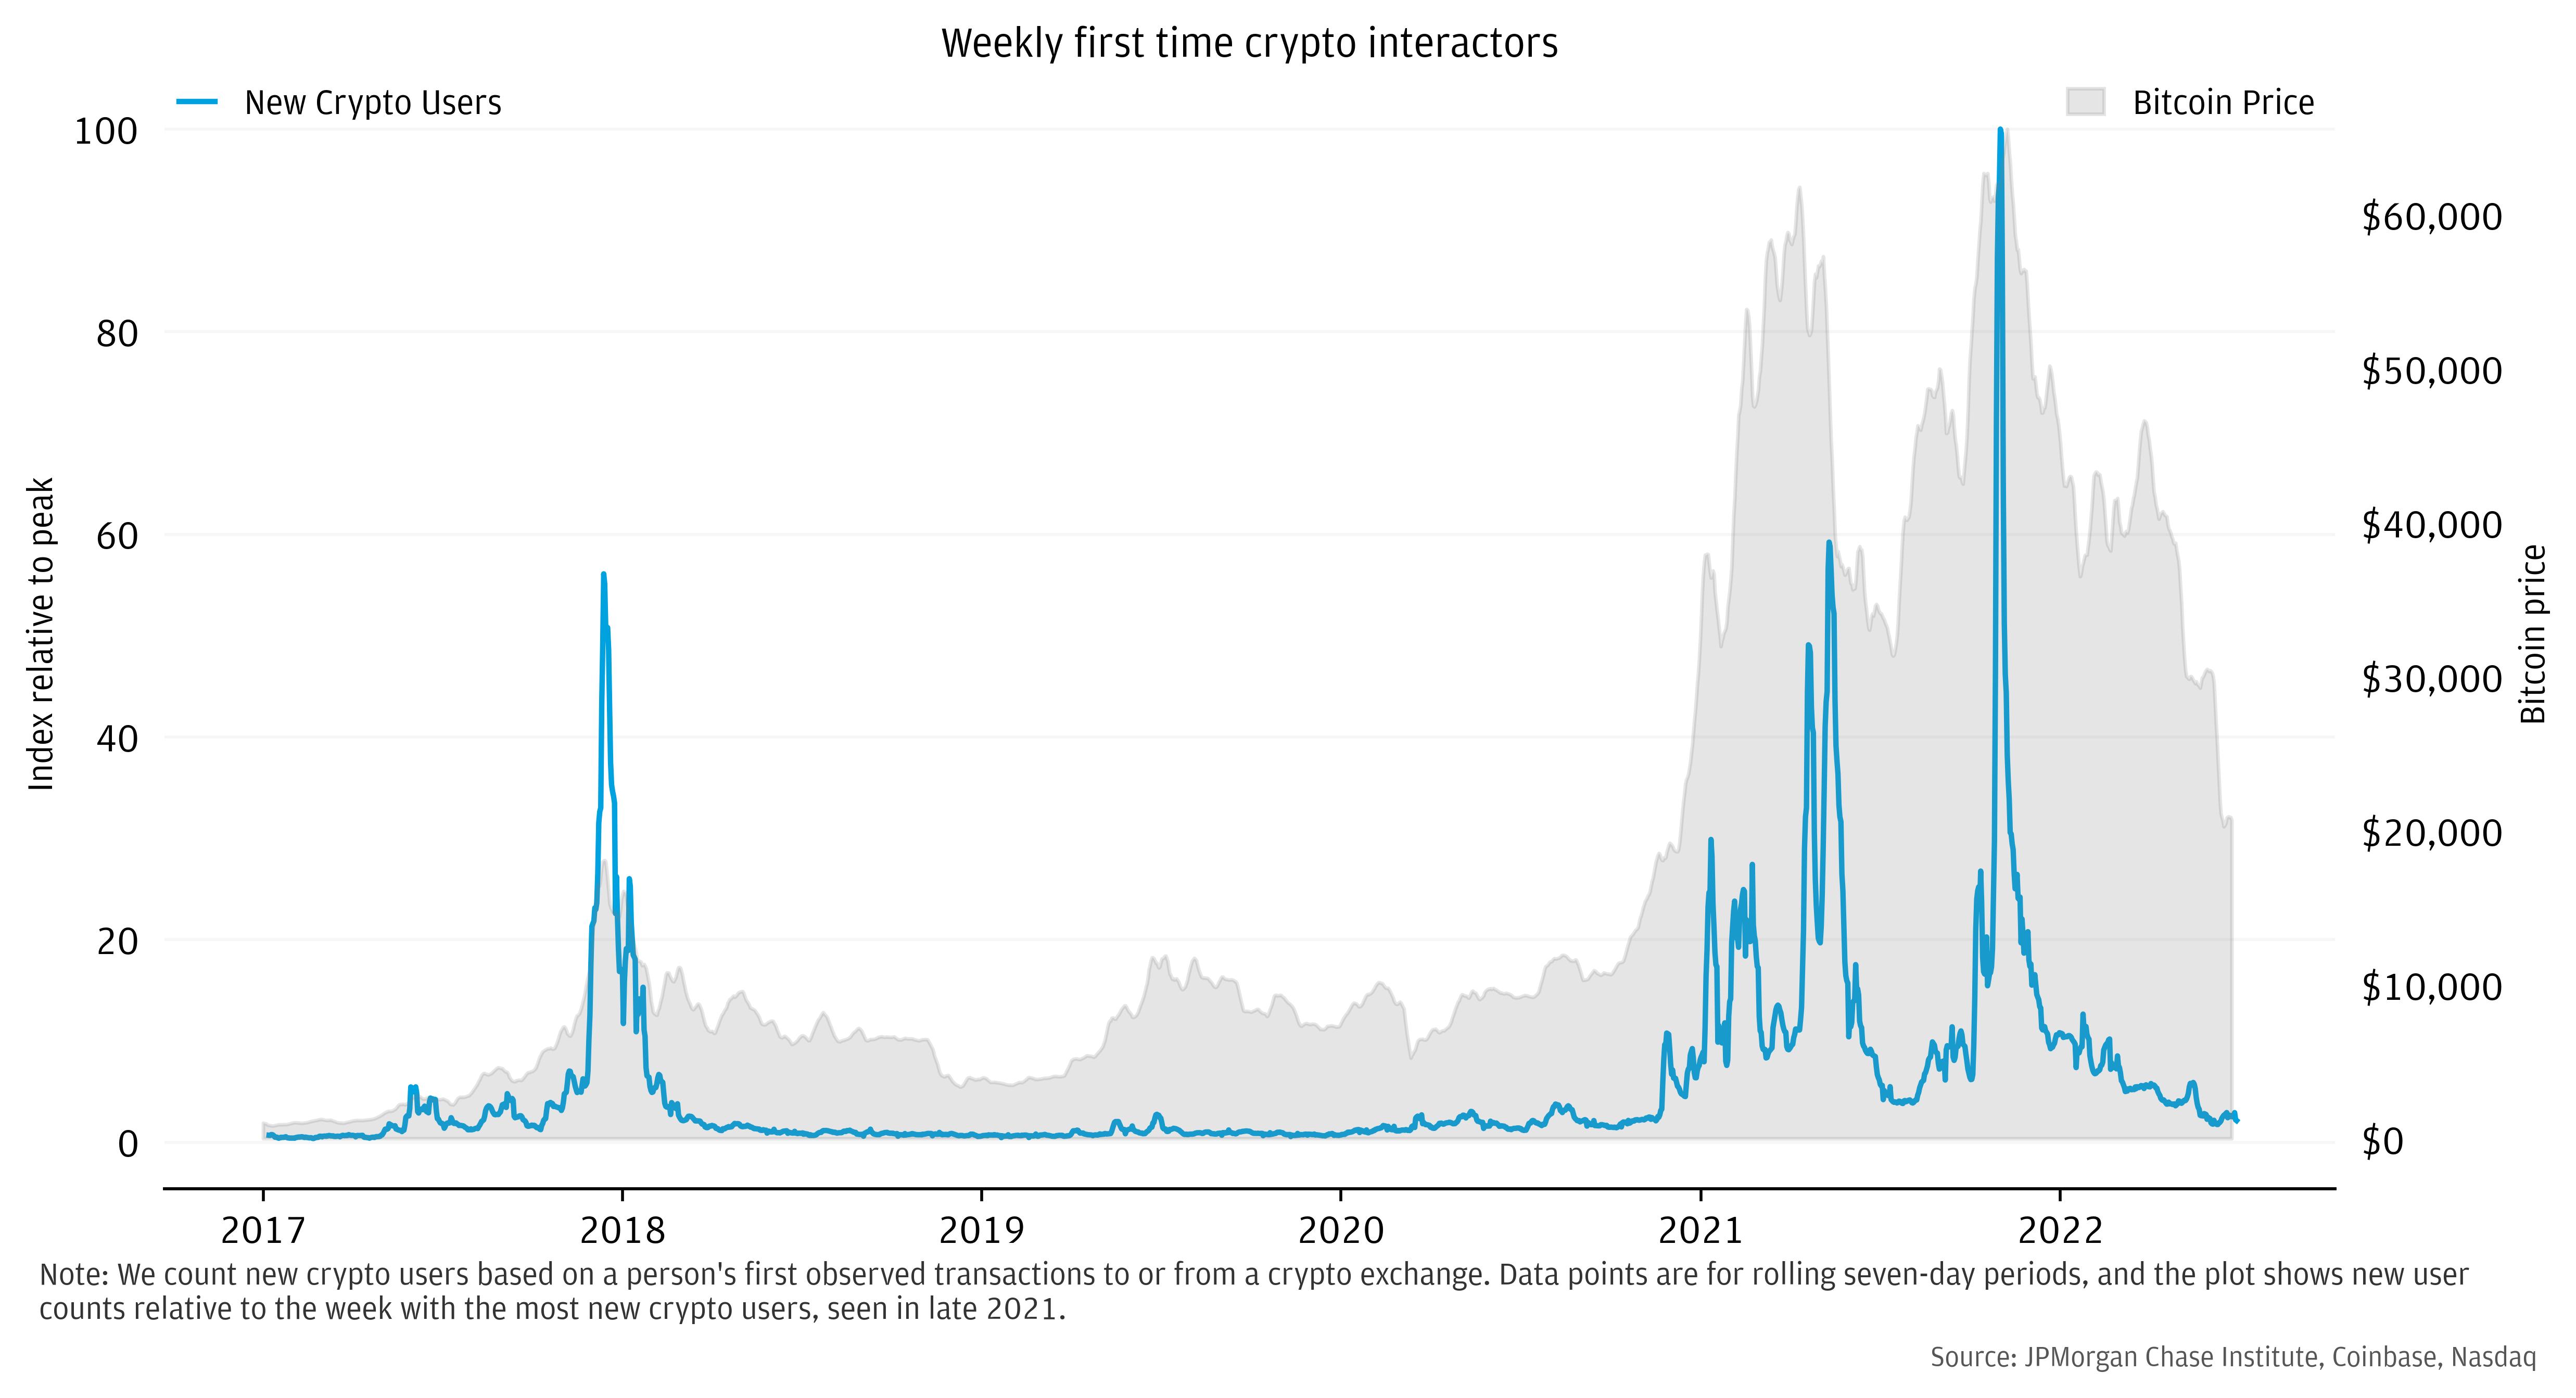
Figure 1: Surges in the crypto user base coincide with significant spikes in bitcoin prices.
Source: JPMorgan Chase Institute, Coinbase, Nasdaq
Latest news

An Ohio-based company is protecting first responders around the world
With support from JPMorganChase, Fire-Dex is providing protective equipment to firefighters in 100 countries and all 50 states.
Learn moreLatest news

Veteran’s Unconventional Path to Landing her Dream Job in Tech
U.S. Army Veteran Ashley Wigfall transitioned to a civilian role and charted her path to technologist through mentorship and skills training at the JPMorgan Chase tech hub in Plano, Texas.
Learn more
Findings
U.S. households’ involvement in crypto-assets (hereafter, crypto) rose sharply during the COVID-19 pandemic alongside a substantial increase in the overall personal savings rate. Five years ago, only a tiny fraction of individuals held crypto. As of mid-2022, almost 15 percent of individuals had conducted transfers into crypto accounts, according to our data. The trend has potential implications for the health of household balance sheets, given market volatility and uncertainty of how use of crypto-assets may evolve.
This report uses de-identified data covering a sample of nearly 5 million active checking account customers, over 600 thousand of which have conducted transfers to crypto accounts. Importantly, we link the dynamics of such transfers with demographic indicators, enabling analysis of heterogeneity across income, gender, and racial groups.
Our findings can be used to assess differential effects of the rise of crypto investing to-date and further extend our understanding of how financial trend-chasing behavior plays out in the real world. In one of the report’s main conclusions, we estimate that lower-income individuals have fared worse—buying later and at higher prices on average—than those with higher incomes. While our data only show transfers into the crypto ecosystem and not the direct purchases of crypto-assets we estimate that the median investor in crypto has probably experienced substantially negative investment returns in percentage terms. Notably, the dollar values involved have been quite small for most.
In our investigation into how crypto fits into households’ financial health, we organize the analysis around following questions and findings:
The share of the population that have ever transferred funds into a crypto-related account tripled during the COVID-19 pandemic, rising from a cumulative 3 percent prior to 2020 to 13 percent as of June 2022. See box below for background on how we track crypto-related flows. The adoption of crypto accounts (defined by the first observed crypto transaction) and the volume of transfers have come in concentrated episodes that coincide with sharp increases in the price of bitcoin. The majority of new crypto users in our sample, from 2015 to 2022, made their first transactions in a set of days spanning less than five months, all of which coincide with a trailing monthly price change exceeding 25 percent.
This research relies on de-identified data on Chase checking account transactions vis-à-vis dozens of retail crypto platforms. We count transfers to crypto brokers as “flows” into crypto, and vice versa for transfers from those platforms into Chase accounts. Our main analytical sample for this report considers a universe of active checking account customers for which we have a significant and sustained stream of activity, characterized by at least 5 transactions per month with total inflows and outflows each over $1,000 per month. This helps center our analytics on a set of individuals for which we see a representative amount of their overall financial activity. Measures of the extent of crypto involvement in this report are relative to this population.
Figure 1: Surges in the crypto user base coincide with significant spikes in bitcoin prices.
Source: JPMorgan Chase Institute, Coinbase, Nasdaq
The intensity of transfer activity at certain points in time, correlated with price movements, suggests herd-like behavior driving a notable share of individuals’ overall transactions with crypto accounts. Investors using traditional investment accounts exhibit similar dynamics—inflows are stronger just after significant increases in U.S. stock prices—but crypto transactions have been more concentrated.i
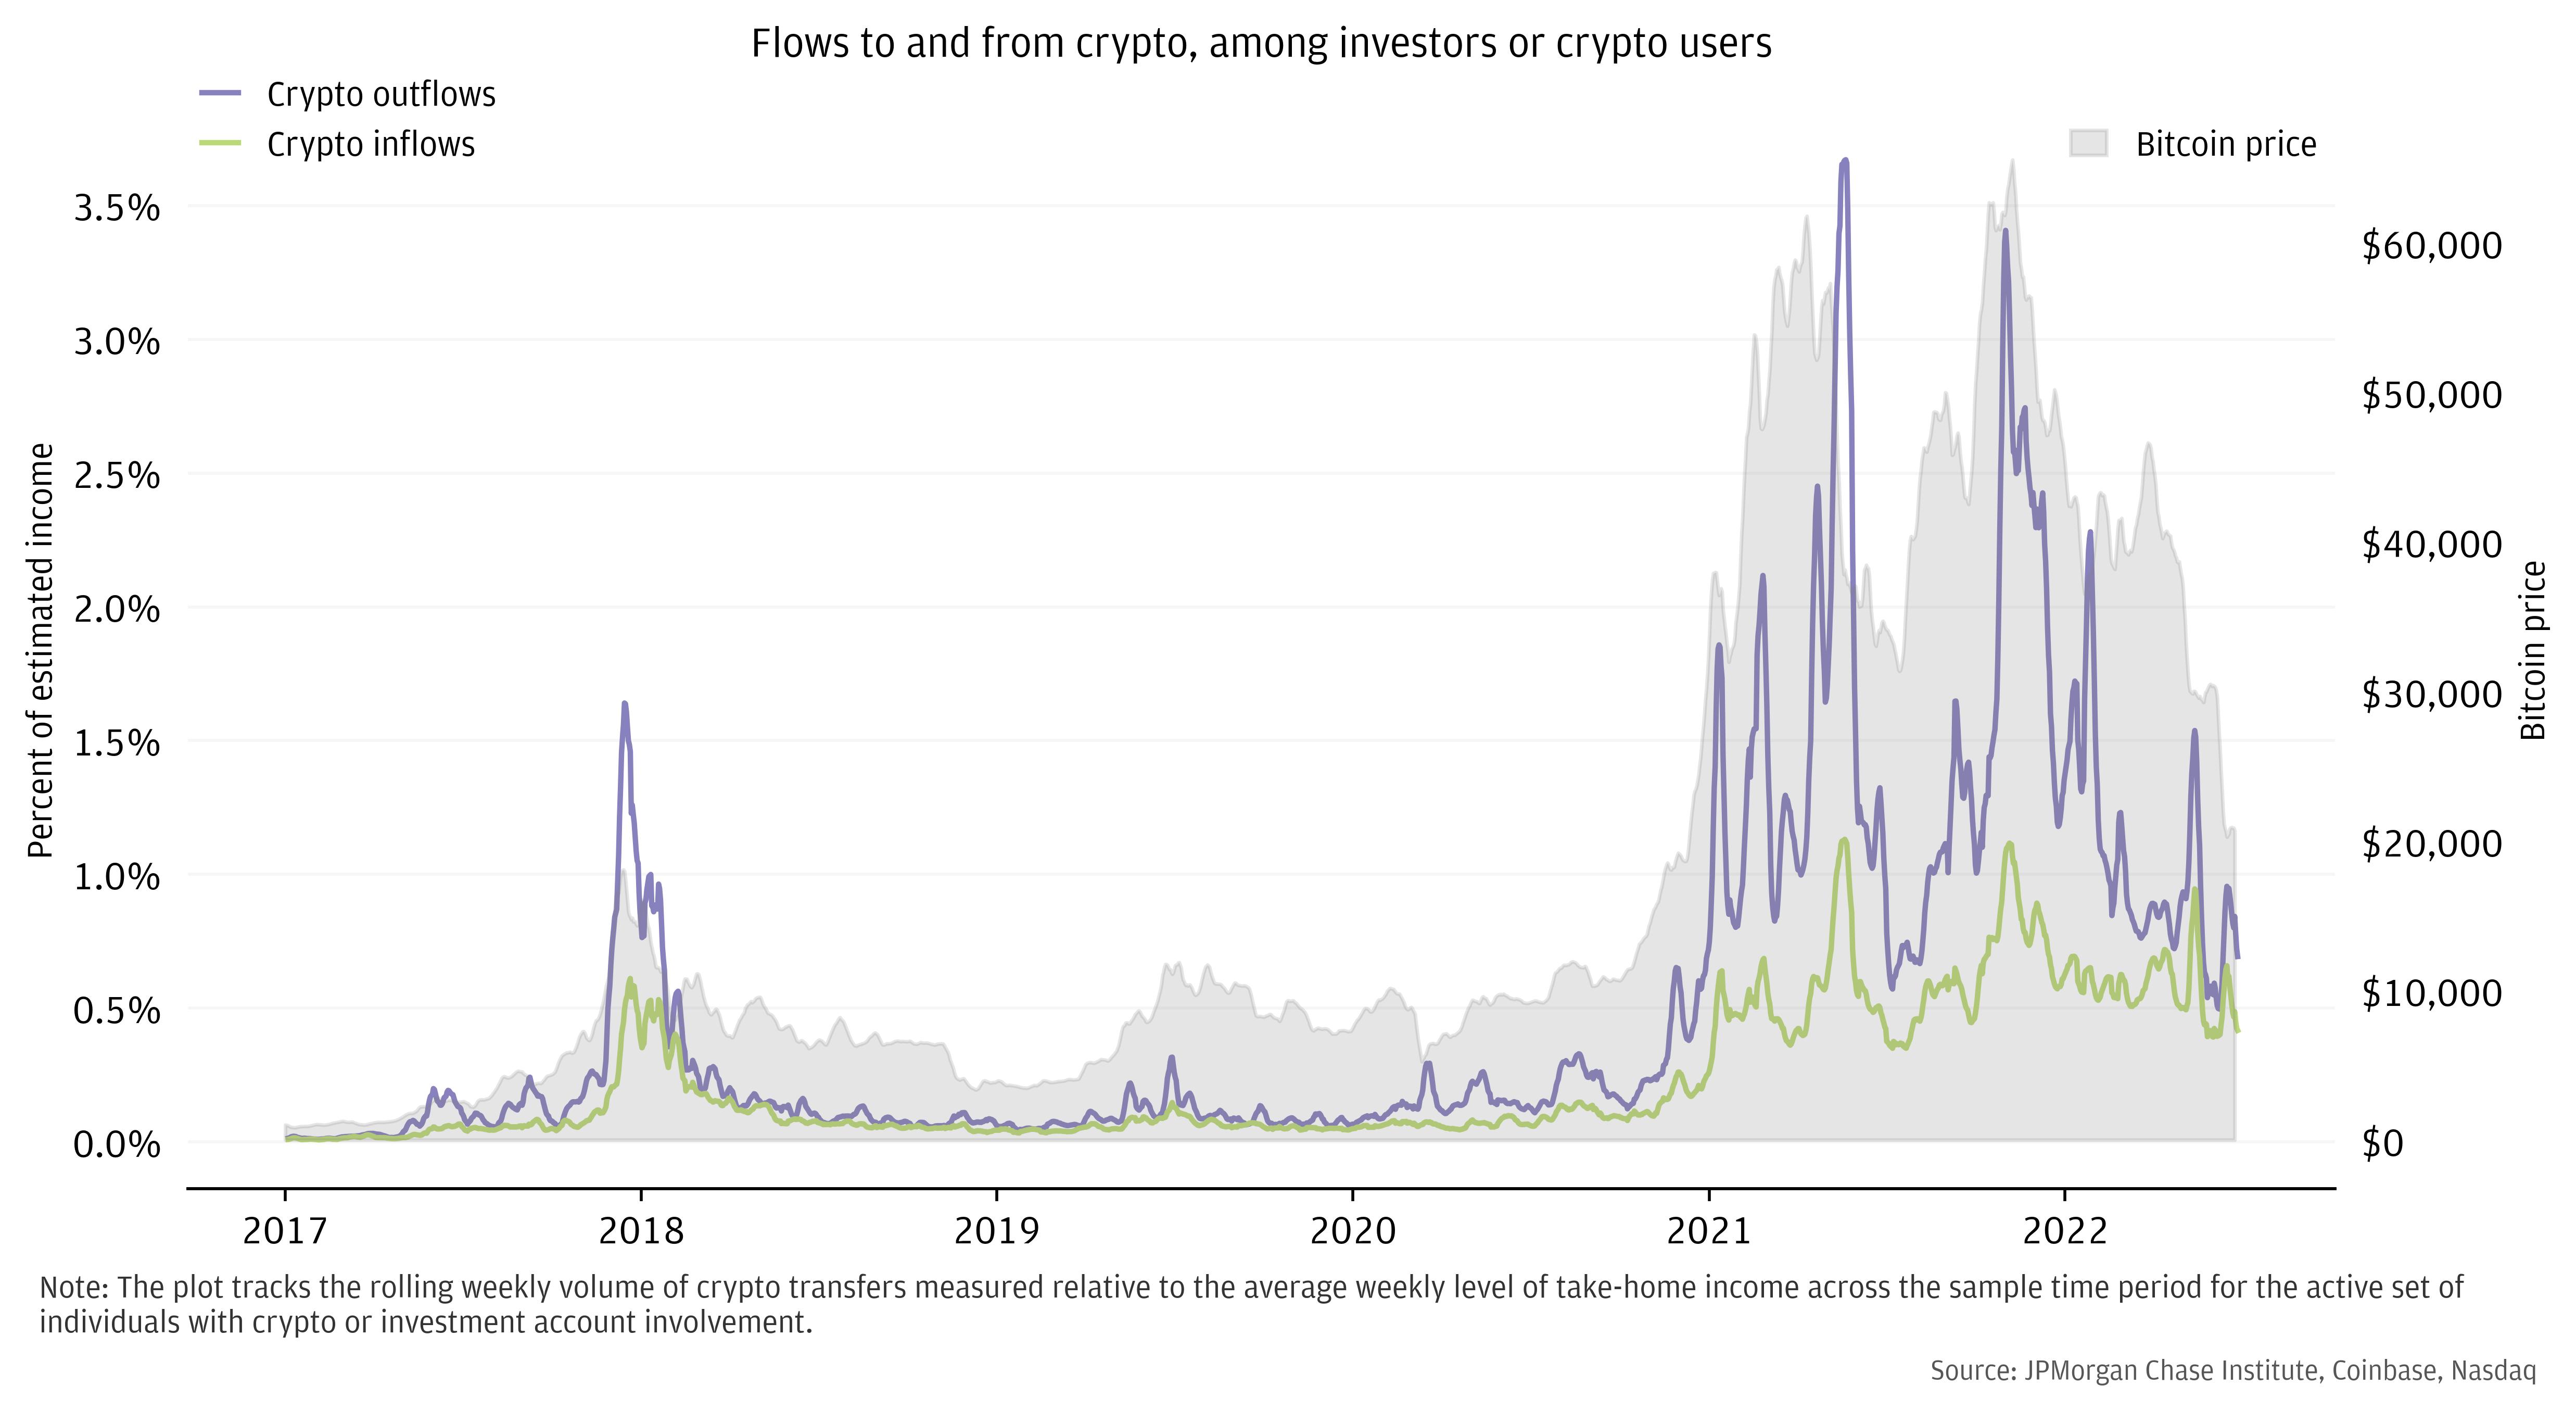
Consistent with crypto-assets being a new entrant to the retail investment landscape, in aggregate U.S. households have been net purchasers of crypto-assets over the past several years. In our sample, the ratio of transfer to crypto accounts to money flowing back into traditional checking accounts was 2 to 1 from 2017 to mid-2022. However, the relative flows had shifted to nearly balanced after the declines in bitcoin prices in May and June of 2022 (Figure 2), as transfers to crypto assets fell and outflows remained elevated. We view the rise and fall of crypto use since the onset of COVID as consistent with the joint relationship between retail flows and market prices seen in prior research. Additionally, the trend in crypto flows also tracks dynamics of household savings, which spiked to historic highs early in the pandemic but has begun to reverse.ii
Figure 2: For most of the past several years, retail investor outflows to crypto accounts far exceeded inflows from those accounts, but the net direction of transfers became more balanced alongside crypto price declines in the first half of 2022.
Source: JPMorgan Chase Institute, Coinbase, Nasdaq
Prior analyses using information from surveys has shed light on the demographics of crypto usage. Banking transactions data provide a check that individuals’ survey responses are consistent with financial activity. Overall, our results on the gender and race makeup of crypto users are broadly consistent with data from the Federal Reserve’s Survey of Household Economic Decisionmaking and separate studies from Pew Research Center.iii
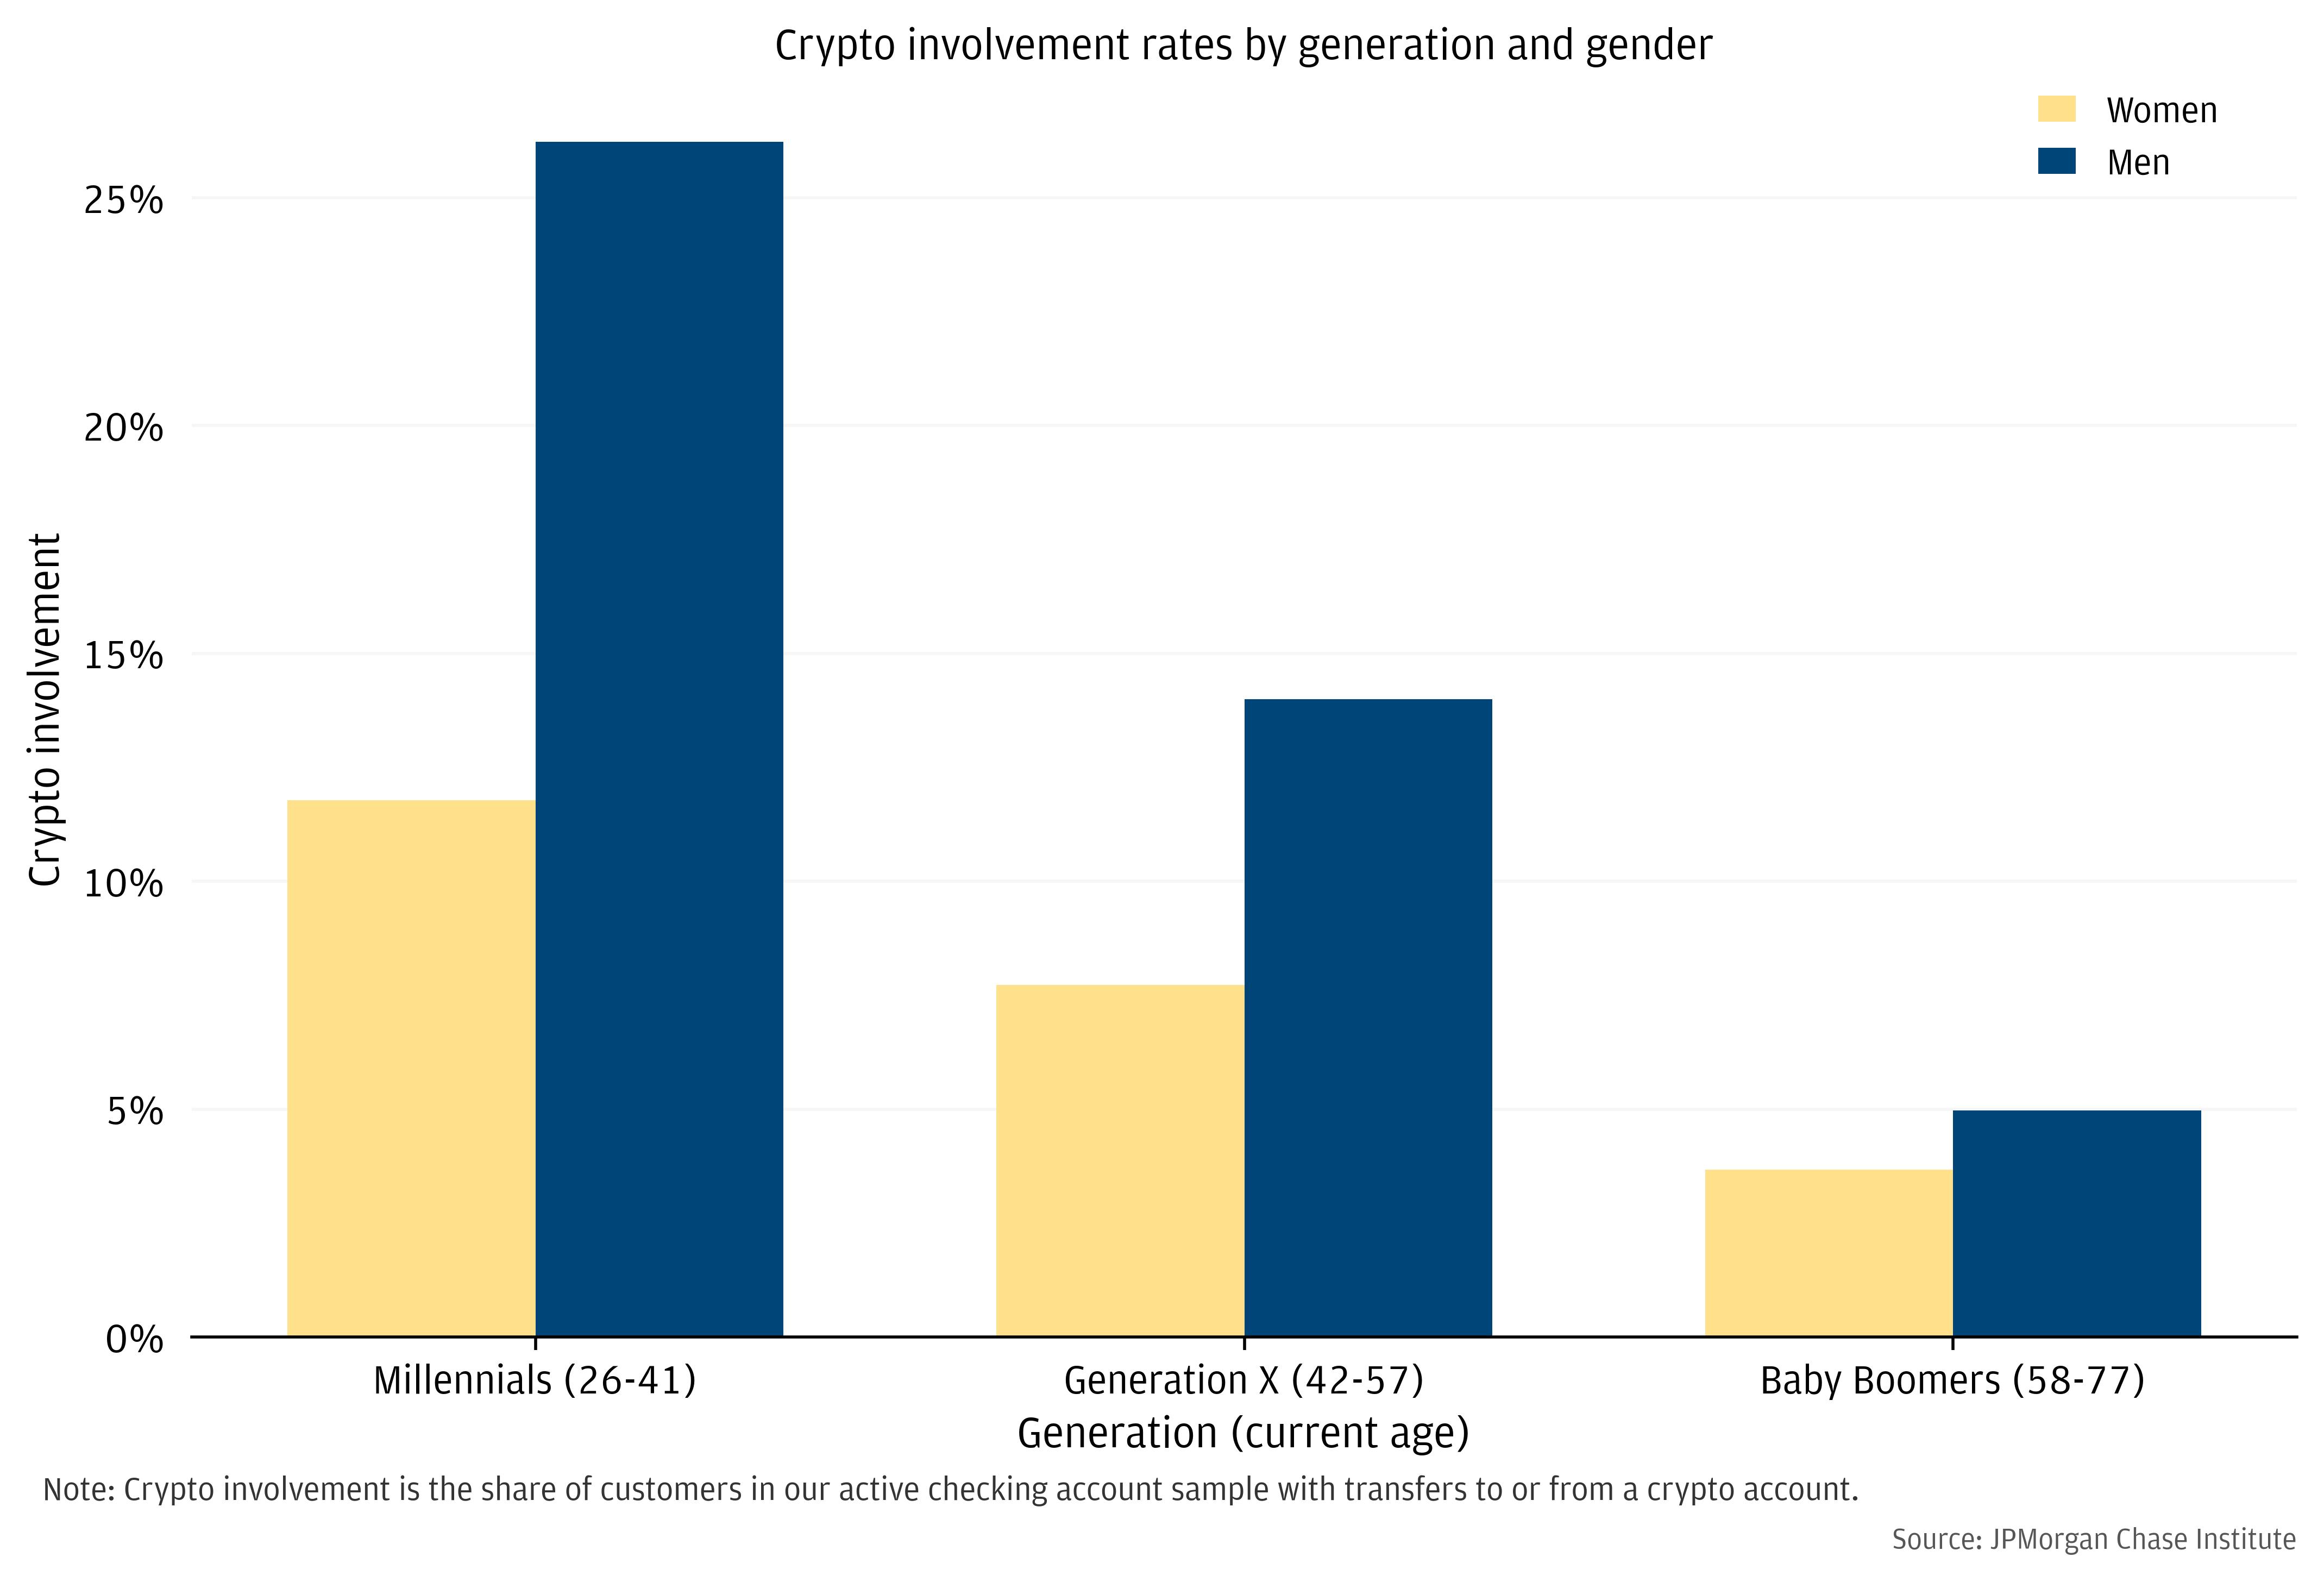
In our sample, crypto usage is more prominent among younger individuals—20 percent for millennials, 11 percent for Generation X, and 4 percent for baby boomers (see Figure 3). Men are more actively engaged in each age group. Across the full sample, men are about twice as likely to have transferred money into or out of crypto accounts.
Figure 3: Use of crypto accounts is most common for millennials and men.
Source: JPMorgan Chase Institute
Among crypto users, men are also more deeply involved in crypto than women, as measured by the gross amount of transfers into and out of crypto accounts vis-à-vis traditional checking accounts. The median total gross transfers for men is approximately $1,000 for men and $400 for women. We investigate the depth of financial risk taken by demographic groups in more detail in Finding 3.
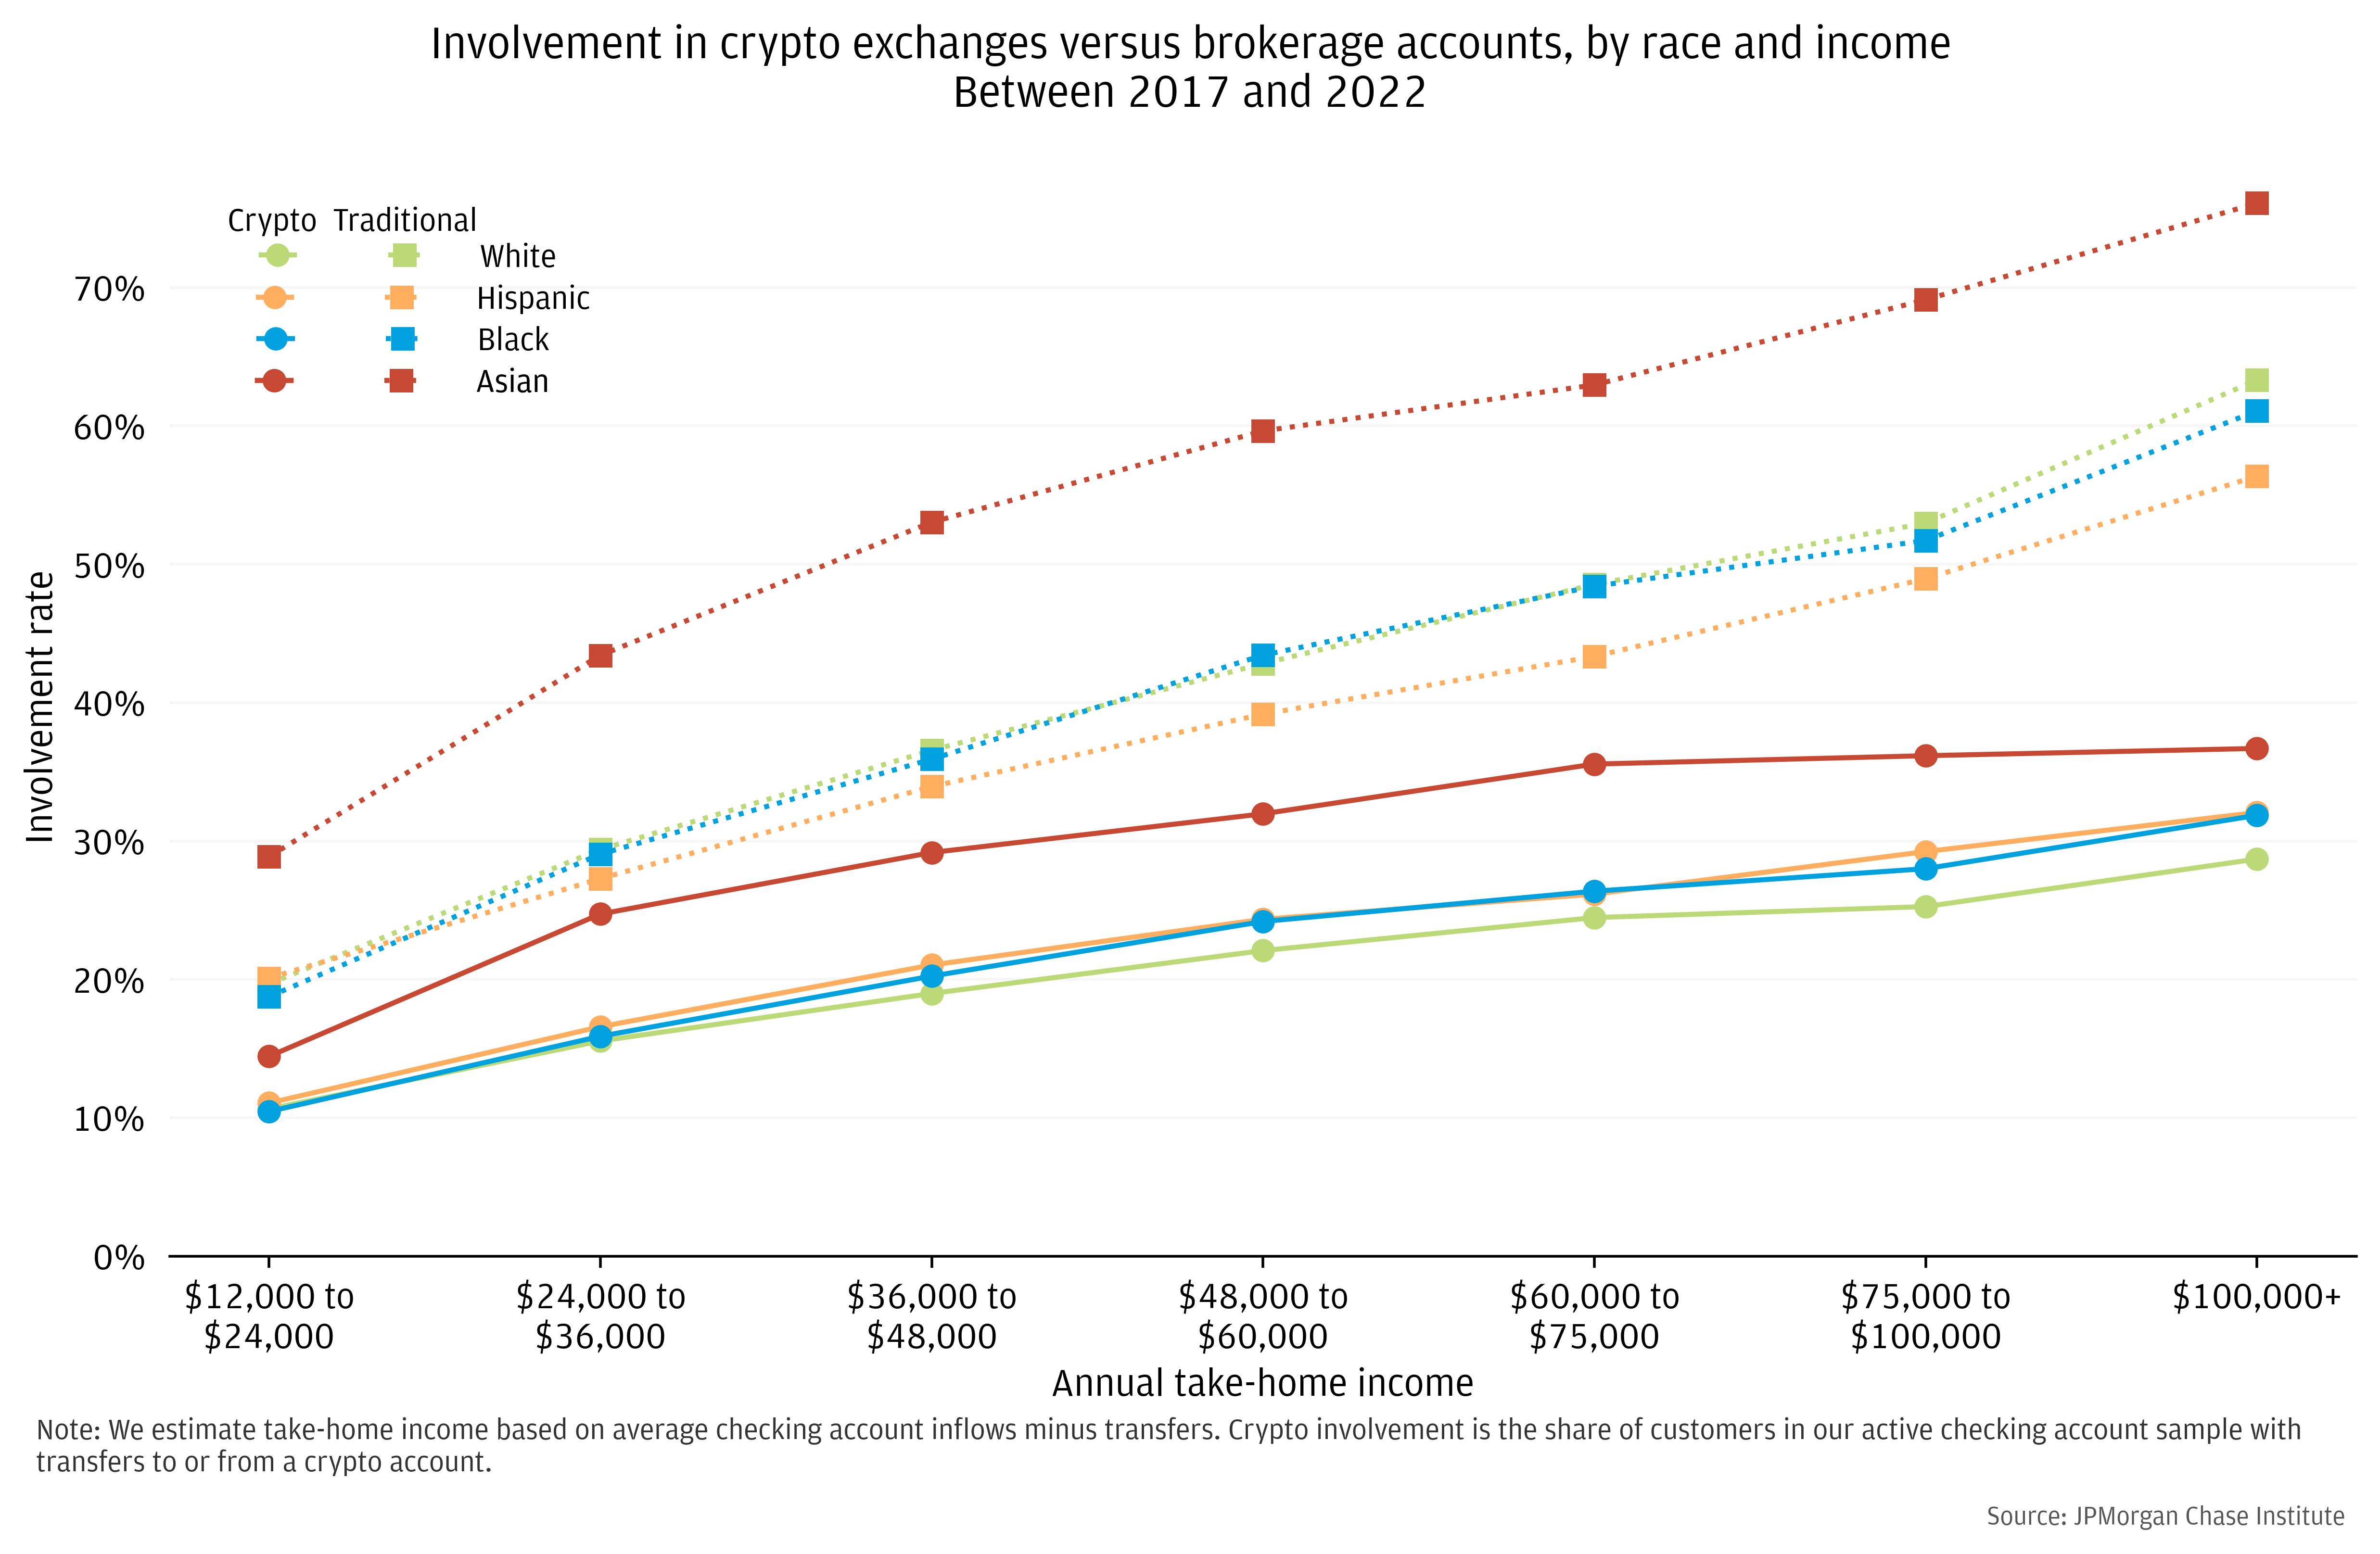
We find additional variation in the demographic makeup of crypto users by race. To isolate differences in race, we focus on millennials—which make up the plurality of crypto users—and look at engagement within income brackets. For millennials around the median income in our sample, Asian individuals have the highest involvement rate at 27 percent.iv The crypto user shares for Black and Hispanic individuals in our data were approximately equal at 21 percent, and White individuals came in at 20 percent.
Crypto involvement increases moderately with higher incomes across race groups, as shown in Figure 4. For reference, we plot these figures relative to the share of individuals that have traditional investment brokerage accounts. The share with each type of account is increasing in income, although the differences between those with higher- and lower-incomes is much smaller in percentage point terms for crypto.
Figure 4: Use of both crypto accounts and traditional investments generally increases with income across racial groups.
Source: JPMorgan Chase Institute
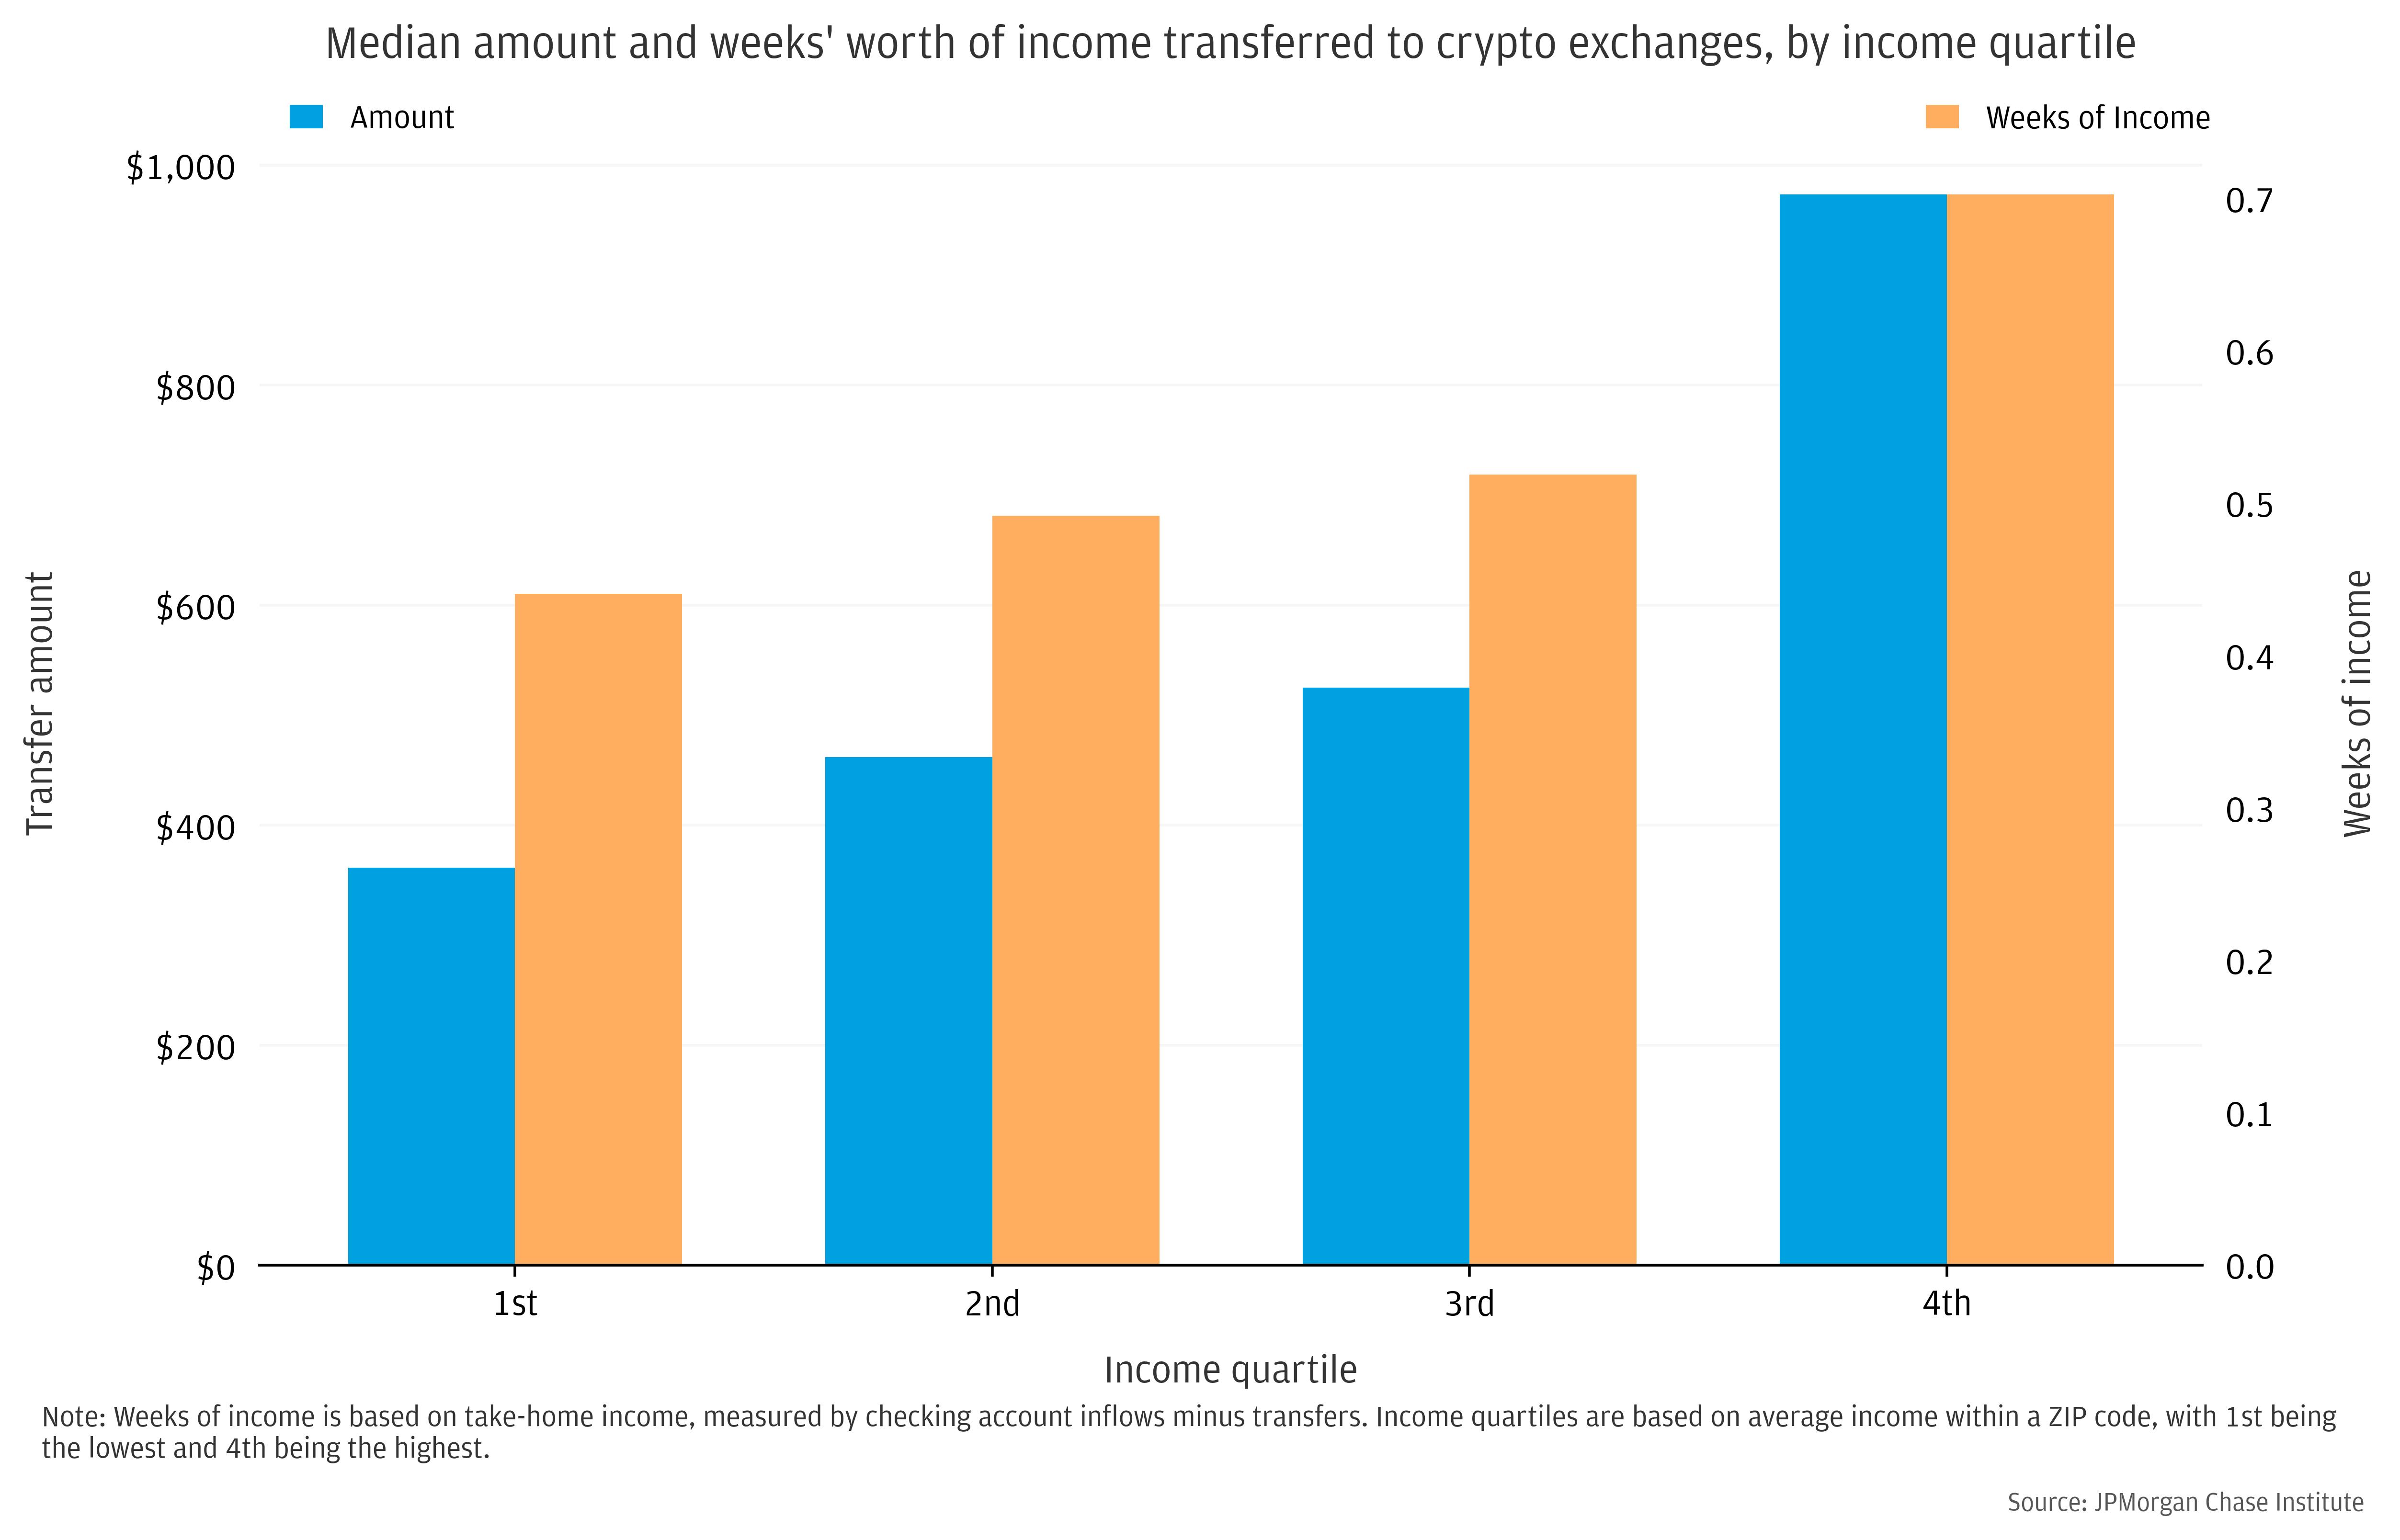
Most investors in crypto have only small holdings. Cumulating transfers at the individual level, the median gross amount transferred to crypto accounts over the period 2015 through the first half of 2022 was approximately $620. The level of crypto engagement—as measured by raw dollar value of transfers and when scaled by income—is generally higher for higher income individuals (see Figure 5).v The distribution of crypto risk exposure is consistent with the view that higher income individuals were more willing and able to bear crypto price risk.vi
Figure 5: Higher income individuals have transferred more money into crypto accounts, measured in dollar values and when scaled by weeks’ worth of take-home-pay.
Source: JPMorgan Chase Institute
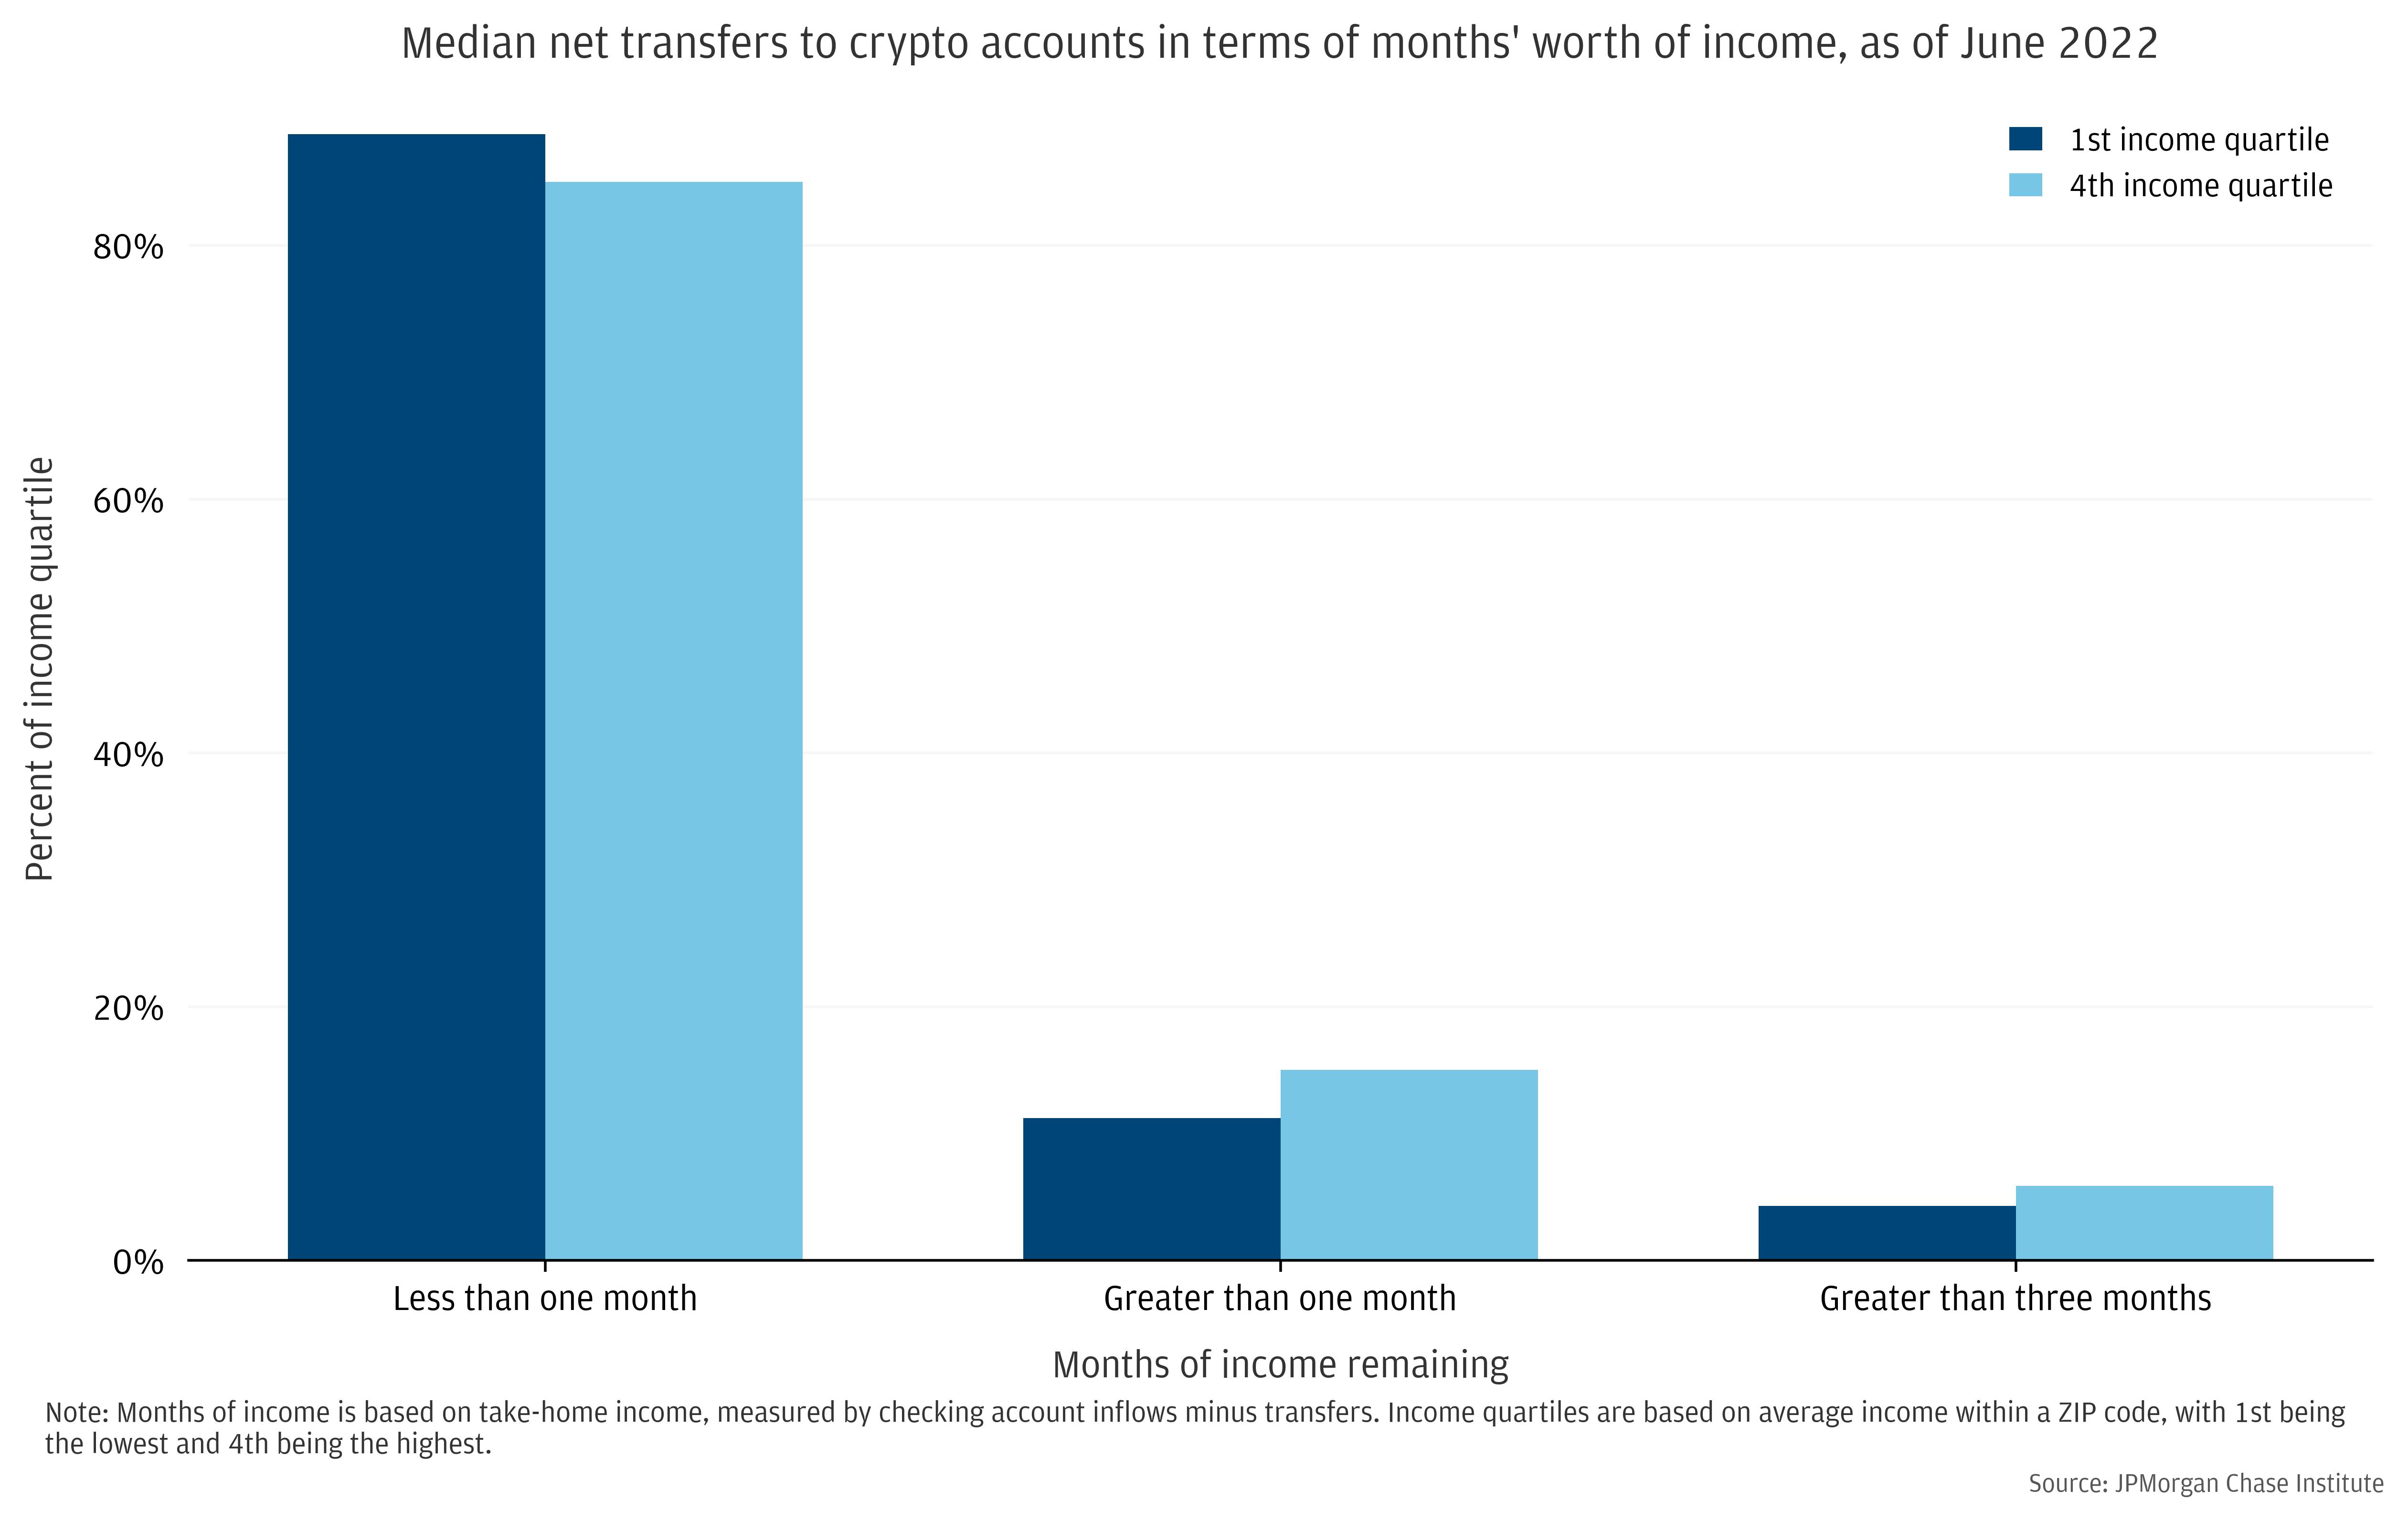
Moving beyond median involvement, we look to the share of individuals in different groups at different levels of (scaled) financial risk. This perspective can be useful to understand the extent of possible financial distress related to losses in crypto markets. As depicted in Figure 6 below, 11 percent of individuals in the first income quartile and 15 percent of the fourth quartile have transferred over one month’s worth of income into crypto accounts. Raising the bar to higher degree of exposure, three months of income, decreases the shares to 4 and 6 percent, respectively.
Figure 6: About 15 percent of individuals have transferred over 1 month’s worth of income into crypto accounts, with a somewhat higher share for high-income individuals.
Source: JPMorgan Chase Institute
Additional context on households’ finances—namely, other indicators of wealth—may reduce spillover risks that could emanate from crypto market volatility, all else equal. Our data show that liquid balances and investment brokerage usage are higher for individuals with elevated crypto exposure. Median liquidity, measured by weeks’ worth of pay held in checking and savings accounts, is 50 percent higher for individuals with more than one month’s worth of pay in crypto in the lowest income quartile. Similarly, those individuals were also more likely to have additional financial wealth in brokerage accounts. This suggests that individuals with high levels of crypto exposure, on balance, may also have greater ability to bear market risk.
With crypto asset prices showing substantial volatility over the previous five years, there is potential for a wide range of average transaction prices and therefore investment returns. We estimate the impact of differential investment timing using the methodology described in the box below.
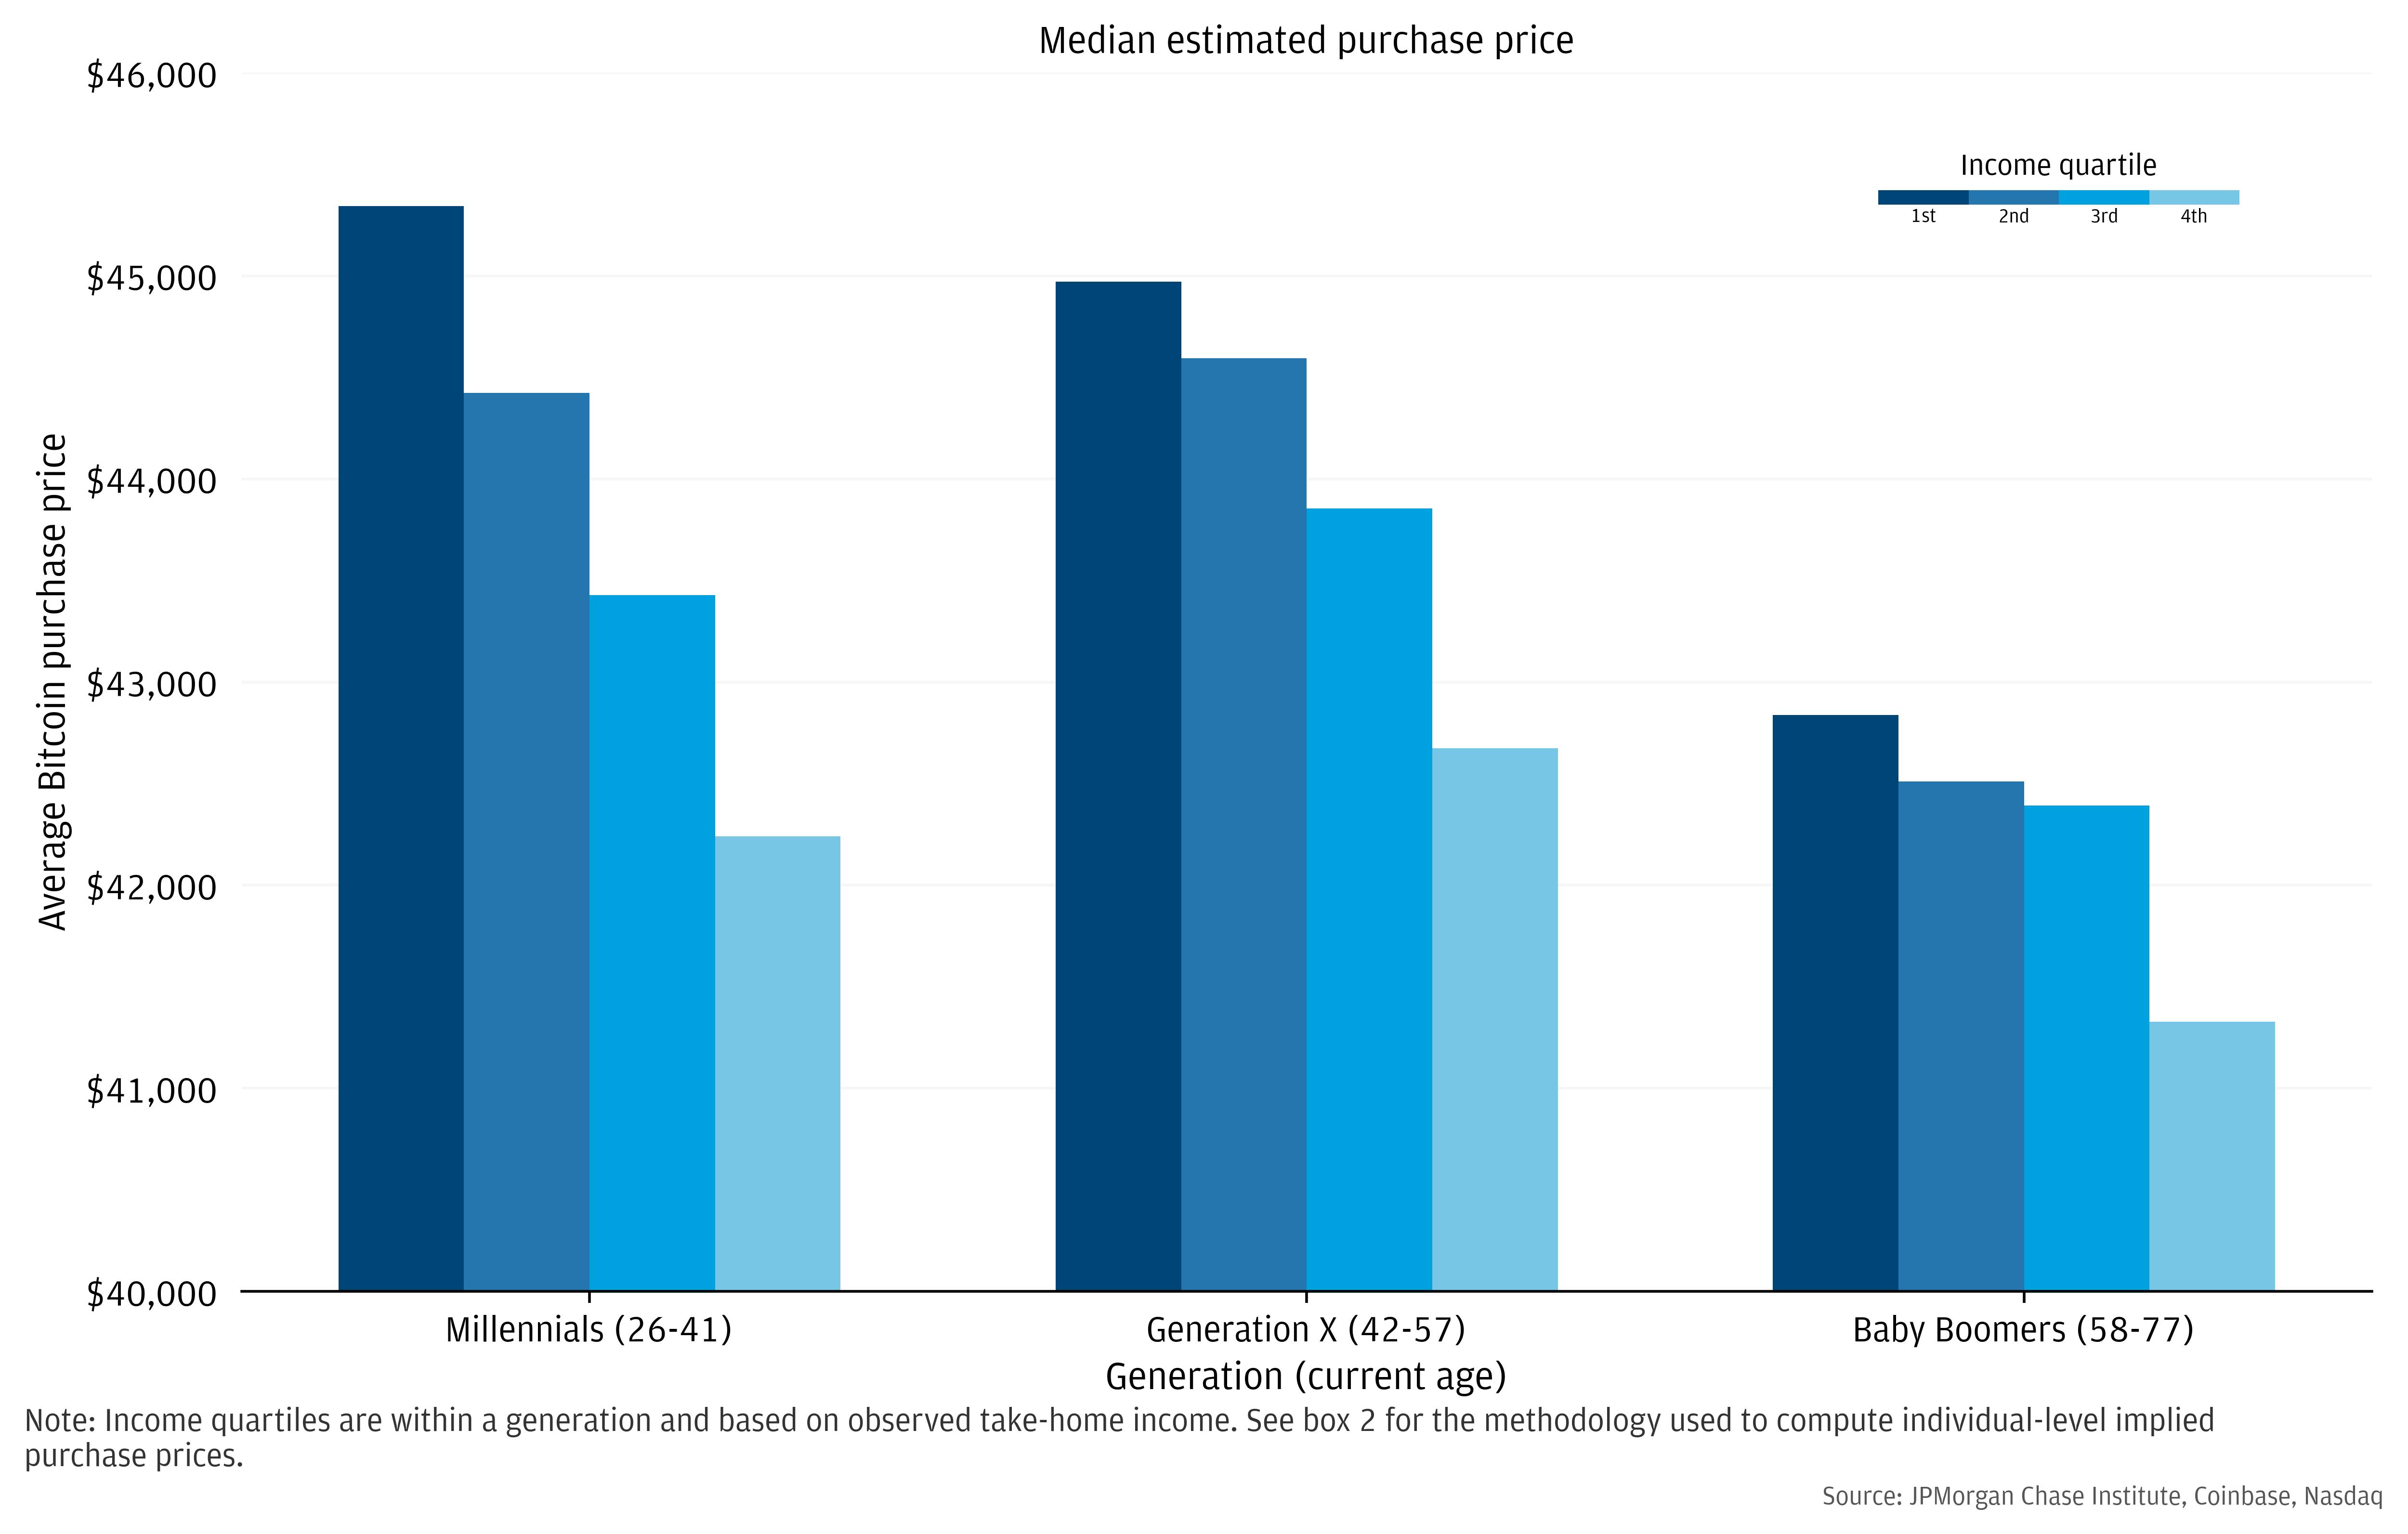
Looking at the distribution of average purchase prices—measured at the individual level—across our sample, we see substantially different median implied purchase prices to crypto by income group. The typical individual transferred money to crypto accounts when bitcoin was trading at a transaction-amount-weighted average level of purchase price of $43,900. The figure is $45,400 for individuals from the lowest income quartile and $42,400 for the highest, among millennials. Since some of these transfers may have been destined for investment in less volatile cryptocurrencies—or remained denominated in USD—our estimated purchase price exercise may inflate implied investment losses.
Figure 7: Individuals with lower incomes transferred money into crypto accounts when prices were higher, suggesting lower investment returns.
Source: JPMorgan Chase Institute, Coinbase, Nasdaq
Estimated crypto purchase prices also exhibit a modest premium paid by non-college graduates. These individuals bought at purchase prices about 2 to 4 percent higher than those with college and graduate degrees, respectively. Controlling for race, generation, gender, observed income, there is still about an $1,100 discount (approximately 2.5 percent) for grad school versus high school educated individuals. These are fairly muted differences compared with the overall income group disparities.
Figure 8: Individuals with lower education had somewhat higher implied crypto purchase prices. Purchase price by education level
| Median purchase price | Discount (to No college price) |
No college | 44,500 | 0.0% |
College degree | 43,700 | 1.8% |
Graduate degree | 42,800 | 3.8% |
Note: Purchase prices are computed for each individual as the transfer size-weighted average price of bitcoin on the date of the transfer.
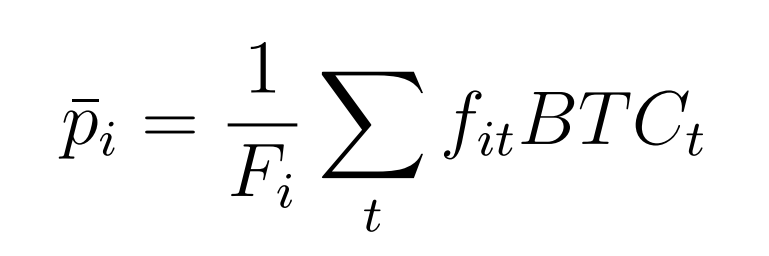
Since we do not directly observe the price of crypto trades, or the actual cryptocurrency involved, we rely on the timing of a transaction and the predominance of bitcoin in the market to estimate transaction prices. We use the closing price of bitcoin on the date of the transfer as an estimate of the purchase price. For each individual then, we can arrive at a flow-weighted average purchase price estimate via the following equation, where p̅i is the average purchase price of person i, Fi is the total amount of the person’s gross transfers to crypto, fit is the dollar value of each transfer at time t, and BTCt is the associated daily bitcoin closing price.
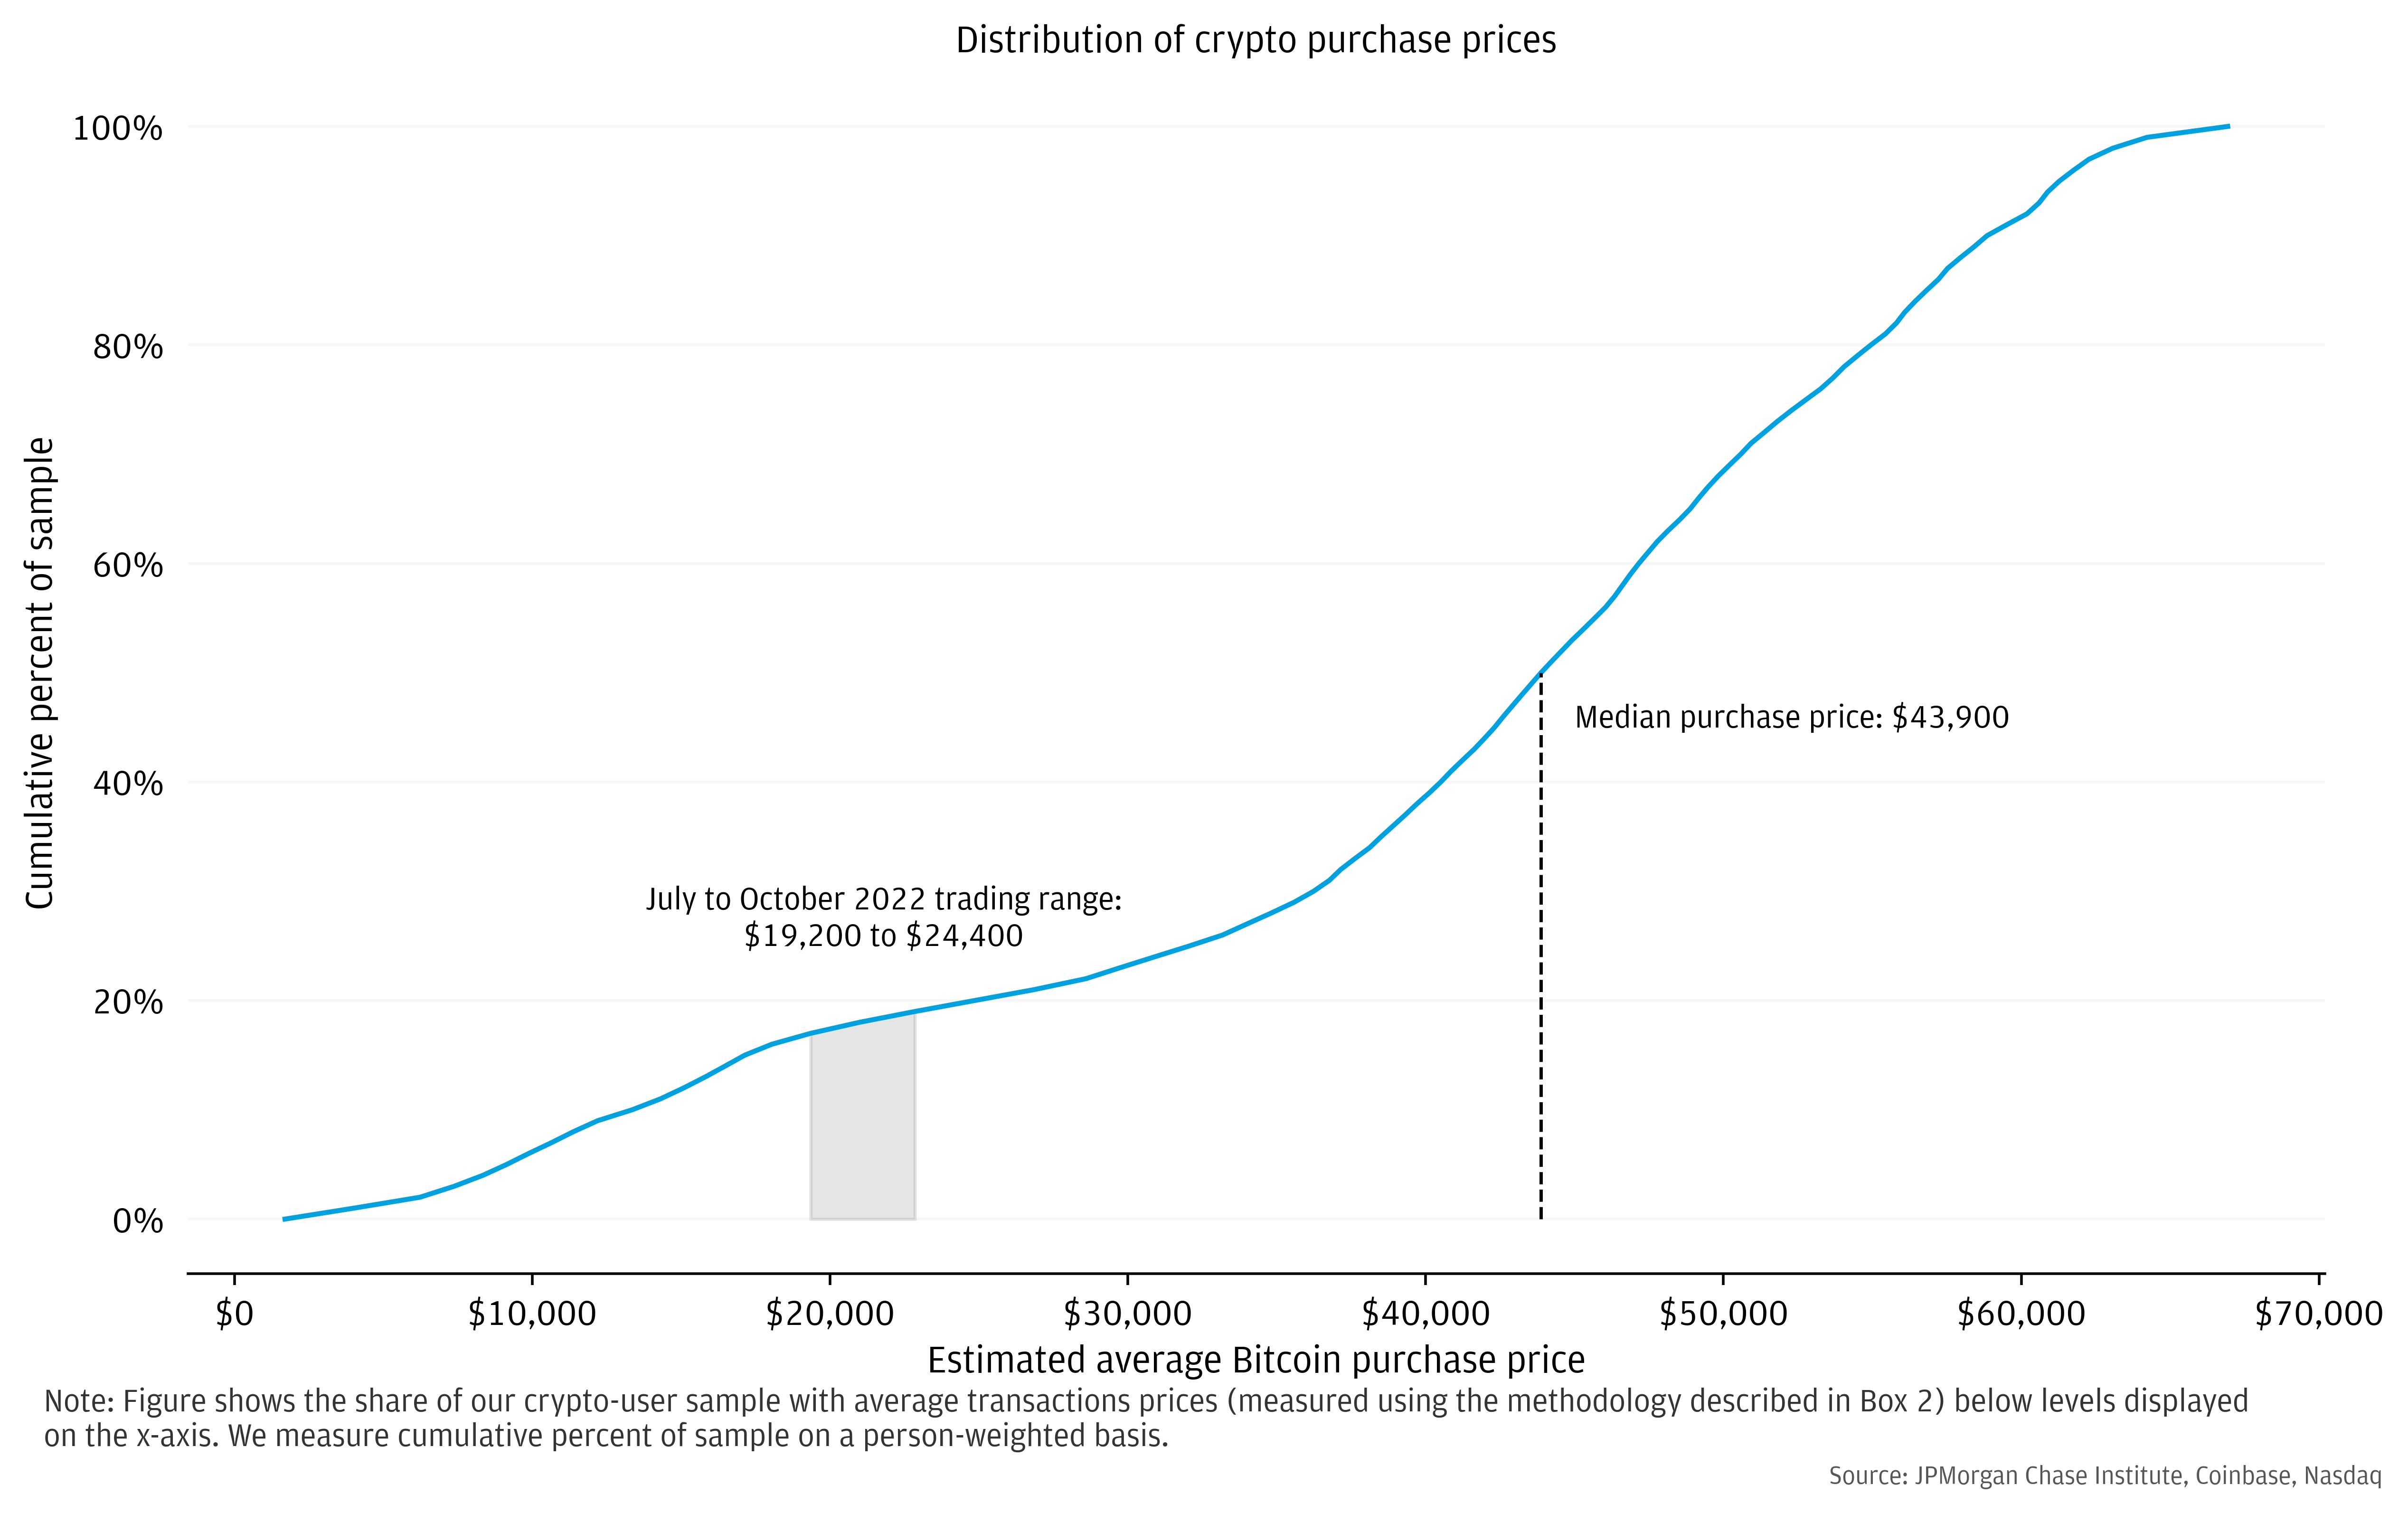
With prices trading near $20,000 over the past several months, our average transaction price measurements imply that the majority of U.S. individuals have faced losses on their crypto investments. While a number of individuals have transferred money out of crypto, especially around the price declines in May and June 2022, only 13 percent of individuals have transferred out as much money as they transferred into crypto accounts. Figure 9 shows the share of individuals in our sample with implied average crypto purchase prices across the range of bitcoin prices. Less than 20 percent of individuals that transferred money into crypto accounts did so when bitcoin was below the recent trading range sub-$20,000 as of November 2022. Over half of individuals made their average crypto transfers when prices were above $40,000, suggesting significant investment losses for that group.
Figure 9: The majority of U.S. crypto users made transfers to crypto accounts when prices were at substantially elevated values relative to current market levels.
Source: JPMorgan Chase Institute, Coinbase, Nasdaq
Crypto use has increased quickly among U.S. households, but the amounts invested for most people are relatively small. Despite the relatively modest overall exposure, a small subset of the population may have substantial financial risk to further crypto market declines. About 15 percent of crypto users have transferred on net over one month’s worth of take-home pay into crypto accounts, making them more vulnerable to the greater than 50 percent decline in crypto-asset prices observed since their peaks in late 2021.vii
The timing of transfers around significant price spikes is characteristic of herd-like behavior. A wide range of U.S. households transferred money into crypto accounts when those assets were trading near their highest levels. Using bitcoin prices around the time of transfers to crypto accounts as a proxy for investment price, we find that lower income households bought crypto at substantially higher prices. The majority of U.S. households were likely facing significant losses in percentage terms at cryptocurrency prices prevailing in late-2022.
Our analysis suggests that policymakers concerned with investor protection should consider the wide range of financial sophistication across the user base. The extent of crypto usage—in terms of the number of individuals involved and the depth of involvement—is higher for those with higher incomes. However, compared with investors in traditional investment accounts, the median crypto user is more likely to come from lower rungs of the income ladder and is more likely to be young and male. Crypto-assets may therefore merit a differentiated policy approach—compared with the existing architecture for traditional markets (e.g., stocks and bonds)—to effectively protect investors and the economy.
The Institute report The Stock Market and Household Financial Behavior documents trend-following behavior in flows into traditional financial investment accounts. The report found that, “… a 10 percent rise in stocks translates to a short-term increase in the magnitude of transfers of over 10 percent for both men and women …” In comparing trend-following in crypto vis-à-vis traditional investments, we find that greater share of crypto flows in recent years coincided with significant rises in crypto asset prices compared with the same metrics for traditional accounts and stock market returns.
As evidence of the partial reversal in the savings surge of 2020-21, household cash balances were declining as of mid-2022 (although remained elevated relative to pre-pandemic levels), according to Institute research. Meanwhile, the aggregate savings rate (FRED ticker: PSAVERT) has retreated from highs exceeding 20 percent in several months in 2020 and 2021 to just 3.5 percent as of August 2022. This is relative to a pre-pandemic baseline of 8.8 percent observed over 2019.
Self-identified demographic data was obtained in 2021 from a third party for the JPMorgan Chase Institute to conduct economic research examining financial outcomes by race, ethnicity, and gender. The demographic data was matched to internal banking records using encrypted quasi-identifiers. This de-identified file that contains banking records and demographics is only available to the JPMorgan Chase Institute.
The median take-home pay in the sample was about $48,000.
For Figure 5, we filter out accounts that experience a high degree of transfers vis-à-vis other accounts. This increases the likelihood that our data represent the bulk of an individidual’s financial activity, but the filter also disproportionately screens out clients that are more active in crypto. Without this filter, the median gross amount of transfers for an individual is somewhat higher, at $750.
As discussed in Finding 4, actual losses (or gains) may be worse, on average, for lower income individuals than Figure 5 may suggest, because they were more likely to transfer money into crypto accounts at high prices around price peaks.
The Nasdaq Crypto Index—which seeks to represent the investible universe of crypto assets—has fallen from a high of over 4,000 to about 1,000 as of November 2022.
We thank our research team, especially Edward Biggs, Melissa O’Brien, Guillaume Kasten-Sportes, and Khushboo Chougule, for their contributions to the analysis. We also thank Kristine Pham, Annabel Jouard, Kate Finnerty, Clarke Wilson and Steve Harrington for their support. We are indebted to our internal partners and colleagues, who support delivery of our agenda in a myriad of ways and acknowledge their contributions to each and all releases.
We would like to acknowledge Jamie Dimon, CEO of JPMorgan Chase & Co., for his vision and leadership in establishing the Institute and enabling the ongoing research agenda. We remain deeply grateful to Peter Scher, Vice Chairman, Demetrios Marantis, Head of Corporate Responsibility, Heather Higginbottom, Head of Research & Policy, and others across the firm for the resources and support to pioneer a new approach to contribute to global economic analysis and insight.
This material is a product of JPMorgan Chase Institute and is provided to you solely for general information purposes. Unless otherwise specifically stated, any views or opinions expressed herein are solely those of the authors listed and may differ from the views and opinions expressed by J.P. Morgan Securities LLC (JPMS) Research Department or other departments or divisions of JPMorgan Chase & Co. or its affiliates. This material is not a product of the Research Department of JPMS. Information has been obtained from sources believed to be reliable, but JPMorgan Chase & Co. or its affiliates and/or subsidiaries (collectively J.P. Morgan) do not warrant its completeness or accuracy. Opinions and estimates constitute our judgment as of the date of this material and are subject to change without notice. No representation or warranty should be made with regard to any computations, graphs, tables, diagrams or commentary in this material, which is provided for illustration/reference purposes only. The data relied on for this report are based on past transactions and may not be indicative of future results. J.P. Morgan assumes no duty to update any information in this material in the event that such information changes. The opinion herein should not be construed as an individual recommendation for any particular client and is not intended as advice or recommendations of particular securities, financial instruments, or strategies for a particular client. This material does not constitute a solicitation or offer in any jurisdiction where such a solicitation is unlawful.
Wheat, Chris, George Eckerd. 2022. “The Dynamics and Demographics of U.S. Household Crypto-Asset Use.” JPMorgan Chase Institute. https://www.jpmorganchase.com/insights/all-topics/financial-health-wealth-creation/dynamics-demographics-us-household-crypto-asset-cryptocurrency-use
Authors

Chris Wheat
President, JPMorganChase Institute

George Eckerd
Wealth and Markets Research Director, JPMorganChase Institute