
Figure 1: In March and early April 2022, balance levels rose across the income distribution, followed by balance declines through June.
Source: JPMorgan Chase Institute
Latest news

An Ohio-based company is protecting first responders around the world
With support from JPMorganChase, Fire-Dex is providing protective equipment to firefighters in 100 countries and all 50 states.
Learn moreLatest news

The consistency of health insurance coverage in small businesses: industry challenges and insights
Learn moreLatest news

Veteran’s Unconventional Path to Landing her Dream Job in Tech
U.S. Army Veteran Ashley Wigfall transitioned to a civilian role and charted her path to technologist through mentorship and skills training at the JPMorgan Chase tech hub in Plano, Texas.
Learn more
Findings
The COVID-19 pandemic resulted in an unprecedented recession that impacted families’ financial positions. Based on recent JPMorgan Chase Institute research, our Household Finances Pulse leverages de-identified administrative banking data to analyze changes in cash balances during the COVID-19 pandemic and ongoing recovery.1
This release examines the path of household cash balances through the end of June 2022, giving us a look at liquid asset trends during the COVID-19 pandemic and associated government financial supports, through the months of advanced Child Tax Credit (CTC) payments and following their expiration.2 We compare cash balance trends across income and age distributions and between families who did and did not receive advanced CTC payments. Updated income quartiles incorporate three full calendar years of families’ incomes, and additions to our income findings provide further detail on balance distributions by income (see the Data Box below, as well as Finding One).
To put our measures of family checking account balances into perspective with other household finance metrics, there are three important considerations to keep in mind. First, our balance growth numbers are based on nominal dollars. This is especially noteworthy given the high rate of inflation in the economy: consumer prices rose by 9.1 percent for the year ending June 2022, the fastest pace in four decades.3 In this sense, the growth we observe in nominal balances may not fully track growth in consumer spending power. Second, the charts below do not account for the secular upward trend of liquid balances prior to the pandemic. In our sample, cash balances in the first two months of 2020 had grown by roughly 7 percent on a year-over-year basis; previous Institute research showed an annual growth rate of 11 percent over a three year period for liquid assets.4 These annual rates imply that early 2022 cash balances could have been up by 23 to 37 percent compared to 2019 levels, independent of the pandemic and corresponding government interventions. Finally, there is significant heterogeneity in asset allocations for different groups of households.5 Families that hold a larger share of their financial wealth in checking accounts may have maintained a larger proportion of their balance increases from government intervention in their checking accounts. Thus, other cash balance metrics may differ from ours in amount or trend, based on these or other differences in measurement. Future releases of the Pulse will attempt to further quantify and address these factors.
With the Household Pulse sample now spanning more than three full years, we’ve updated our income categories to include recent income changes. Previous Pulse releases assigned income quartiles based on a family’s total income—all non-transfer inflows into their checking accounts—in 2019. Our new income quartiles are based on adjusted income, which is all checking account inflows minus transfers, Economic Impact Payments (EIP), and Unemployment Insurance (UI). We remove these income sources since they do not represent long-term income. We then establish quartiles using adjusted income from 2019, 2020, and 2021: within each year, we determine a family’s relative income rank among all families in our sample, and then take the average of the family’s adjusted income rank across the three years. This average rank is used to determine their final income quartile.
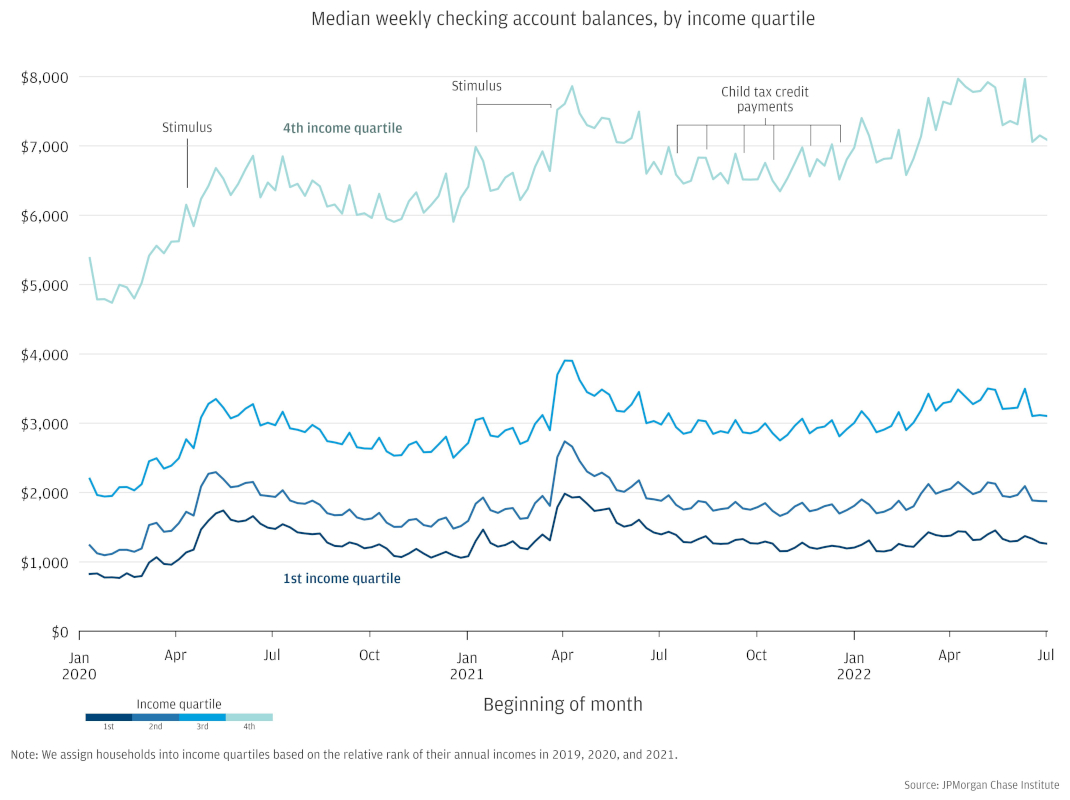
Figure 1 shows median weekly checking account balances by income quartile for the families in our sample. Following the seasonal pattern seen in pre-pandemic years, all income groups experienced balance level gains around March and April after tax return distributions, followed by a decline into the beginning of summer. For the fourth income quartile, balances in the most recent months of our data are comparable to their highs following the third round of EIP in April 2021. This contrasts with the first income quartile, whose balances have remained notably lower than their post-stimulus highs.
Figure 1: In March and early April 2022, balance levels rose across the income distribution, followed by balance declines through June.
Source: JPMorgan Chase Institute
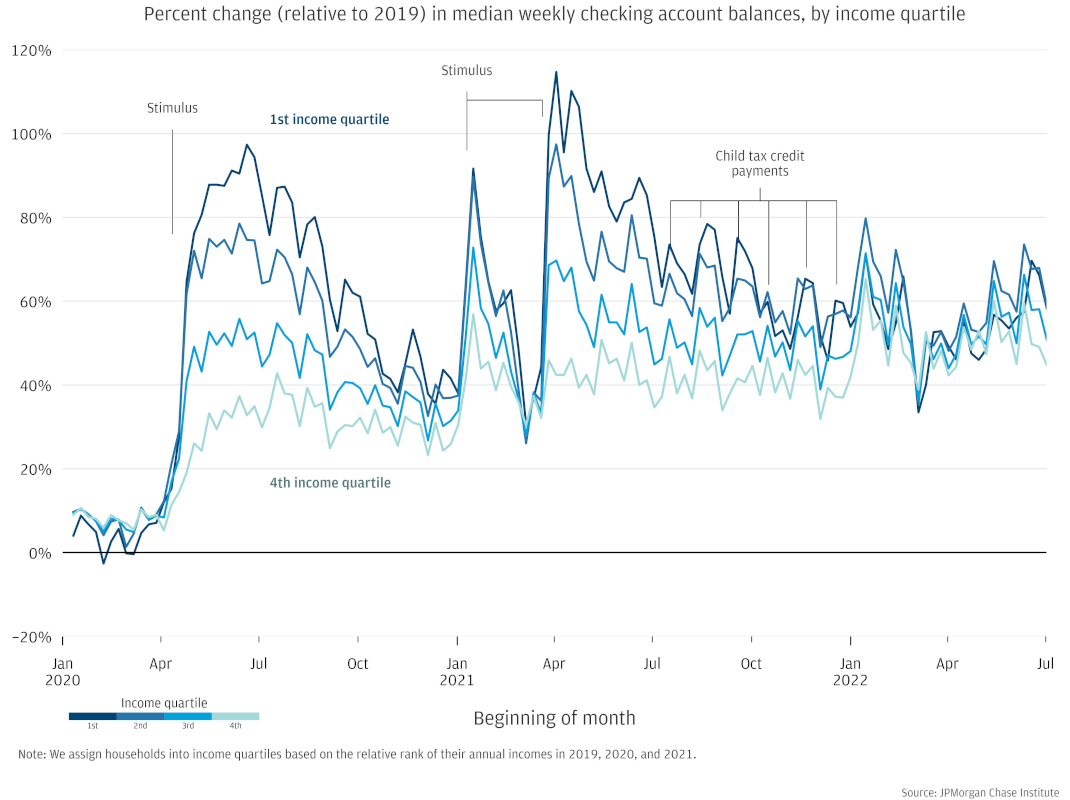
Figure 2 shows the change in median weekly checking account balances compared to the same weeks in 2019. Relative to 2019, balances remain significantly elevated for all income quartiles, but the path of balances through early summer shows a different trajectory this year. The balance gains seen at the end of March are smaller, and the drop into summer less pronounced, so the percent change relative to 2019 decreased in March but has shown a steady increase over the last quarter. Following each round of stimulus payments, balances increased relative to 2019 much more for the lowest income quartile than the highest. This distribution flattened over the last year, with less pronounced percent change differences across income groups. At the end of June 2022, median cash balances were 60 percent elevated for low-income families, compared to 45 percent elevated for high-income families. Note that this puts high-income families only somewhat above the upper bound of 37 percent elevation that we could expect to see from secular trends in a typical three-year period (see above discussion).
Figure 2: At the end of June 2022, median cash balances were 60 percent elevated for low-income families, compared to 45 percent elevated for high-income families.
Source: JPMorgan Chase Institute
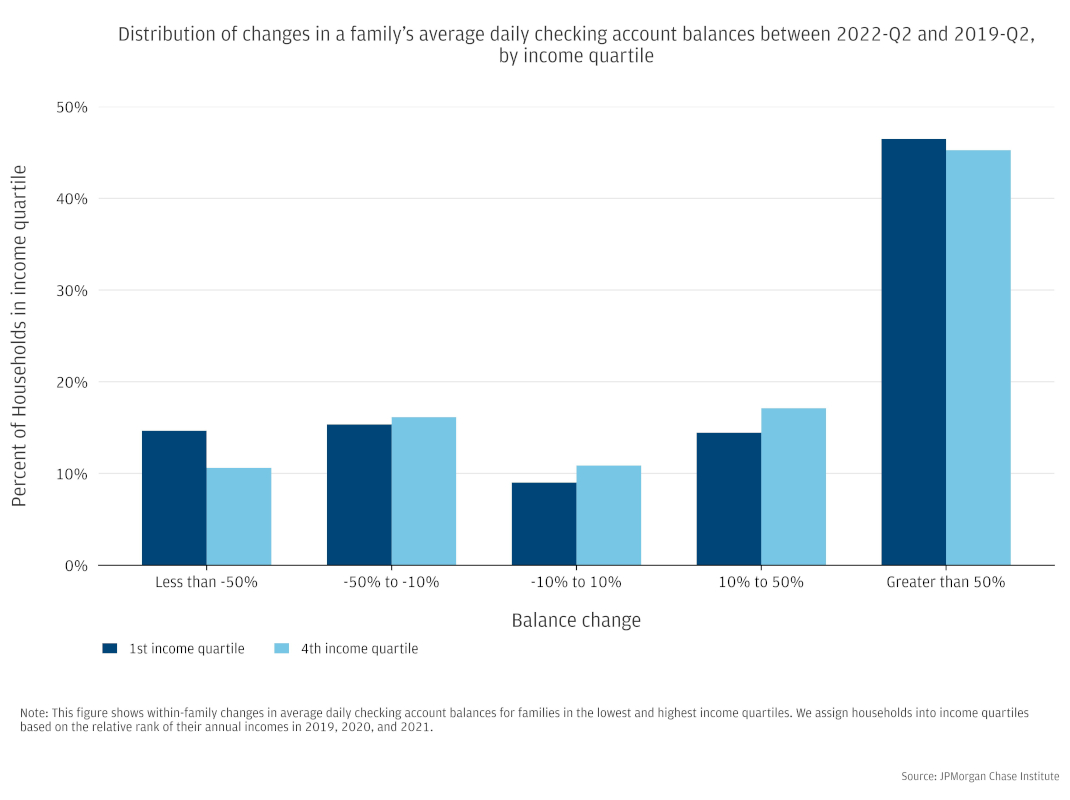
To understand what these overall increases mean for individual families, we further explore balances by tracking changes over time for each family in our sample, and assessing the distribution of these within-family balance changes. While median household balances were elevated between 45 and 60 percent in June 2022 relative to 2019, not all families experienced balance increases over that time. A significant proportion of families experienced a balance decrease, with low-income families being most likely to experience a loss (Figure 3).
Between the second quarters of 2019 and 2022, roughly 60 percent of families experienced an increase in balances, and most of those (45 percent of our sample) had balances increase by more than 50 percent. At the same time, roughly one-third of the lowest income and one-fourth of the highest income families experienced a balance decline of 10 percent or more. The largest balance decreases were concentrated in the lowest income group, with that group being most likely to experience a loss of worse than 50 percent (16 percent of the lowest earning families, compared with 11 percent of the highest earning families).
Figure 3: While 60 percent of families experienced balance increases between the second quarter of 2022 and the same period in 2019, roughly one-third of the lowest income and one-fourth of the highest income families experienced balance declines during this time.
Source: JPMorgan Chase Institute
New for this release of the Household Pulse, we include quarterly mean balances by income quartile, to enable comparisons with other data sources that report based on means. As discussed in past Institute research, the mean and median of household balances show significantly different trends over time.6 Like median balances, mean balances are higher for higher income families, as shown in Figure 4. The highest income families had mean balances three to four times higher than the lowest income families. The distribution of checking account balances is skewed, with some households having very large balances. This distribution structurally leads to means that are significantly higher than their corresponding medians. In addition to this structural difference, mean balances increased nearly every quarter during our sample period, except for some slight drops in the quarters following stimulus payments. This trajectory sharply contrasts with the trend we observe in median balances, which decrease considerably following stimulus payments.
|
Income Quartile |
|||
| Quarter | 1st |
2nd |
3rd |
4th |
2020-Q1 |
$ 4,173 |
$ 5,132 |
$ 7,195 |
$ 15,224 |
2020-Q2 |
$ 5,078 |
$ 6,209 |
$ 8,522 |
$ 17,250 |
2020-Q3 |
$ 5,312 |
$ 6,448 |
$ 8,921 |
$ 17,947 |
2020-Q4 |
$ 5,264 |
$ 6,482 |
$ 9,133 |
$ 18,640 |
2021-Q1 |
$ 5,684 |
$ 7,048 |
$ 9,853 |
$ 20,309 |
2021-Q2 |
$ 6,307 |
$ 7,735 |
$ 10,653 |
$ 21,513 |
2021-Q3 |
$ 6,171 |
$ 7,635 |
$ 10,572 |
$ 21,230 |
2021-Q4 |
$ 6,209 |
$ 7,777 |
$ 10,857 |
$ 22,090 |
2022-Q1 |
$ 6,418 |
$ 8,125 |
$ 11,385 |
$ 23,882 |
2022-Q2 |
$ 6,687 |
$ 8,529 |
$ 11,947 |
$ 24,813 |
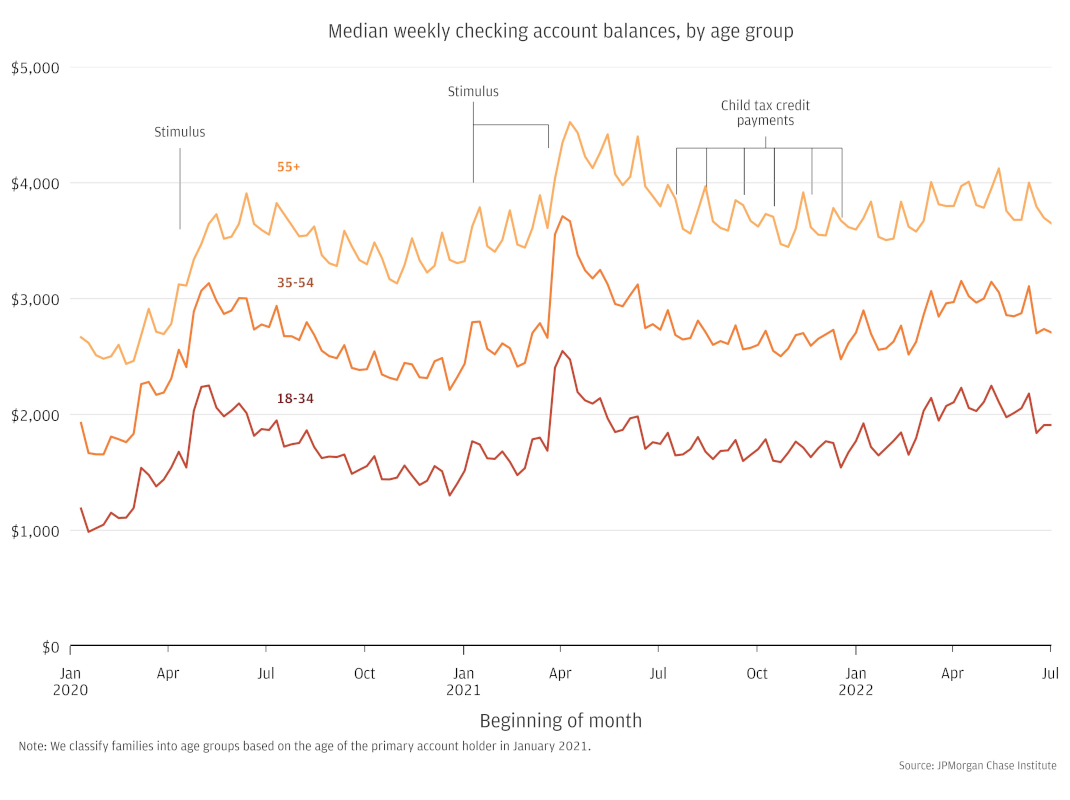
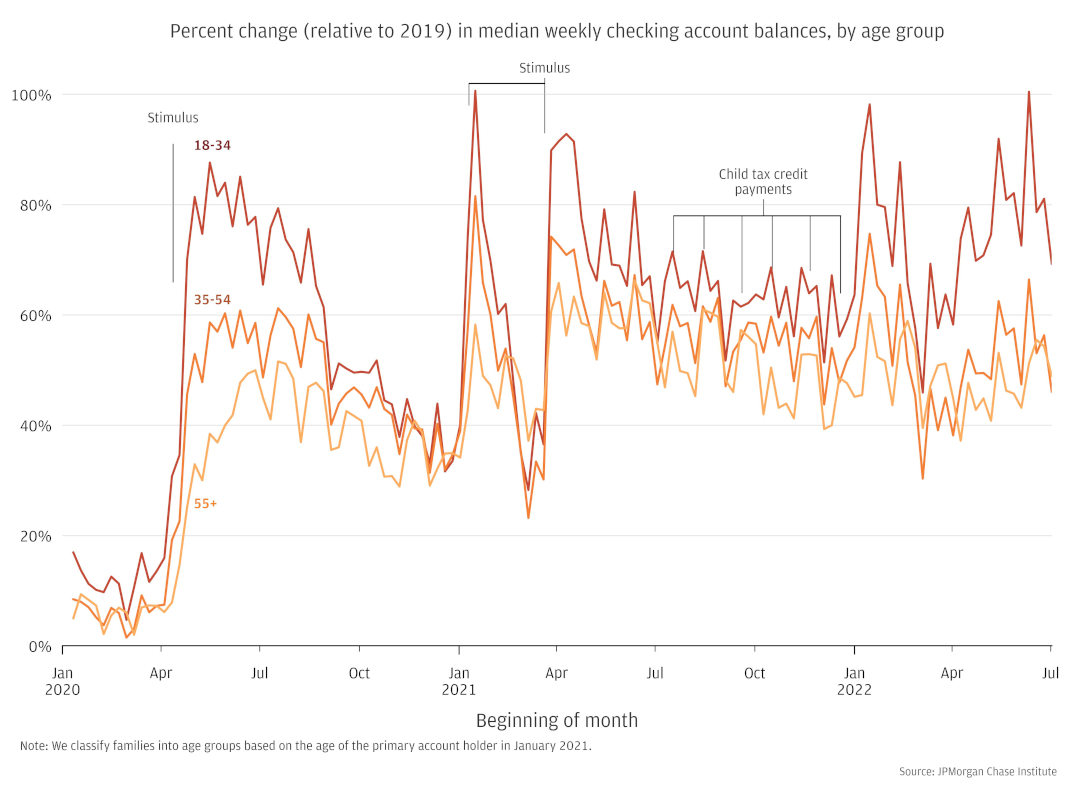
Checking account balances by age follow similar patterns as those discussed in the previous section by income: median balances increased with tax time in March and April, and decreased slightly in June. The June decreases were typical of seasonal fluctuations in balances, though slightly delayed relative to past years, when first-quarter balance increases depleted more immediately following tax-time peaks.
Figure 5: Median checking account balances remained elevated across age groups, with the youngest families maintaining the lowest cash balances.
Source: JPMorgan Chase Institute
The comparatively longer period of increased balances following tax time in 2022 is clear when assessing balances in terms of percent change relative to 2019 (Figure 6). At the end of March, balances were 38 to 45 percent elevated for the older age groups (aged 35 years and older), and 58 percent elevated for the youngest group (aged 18 to 34 years). Balance gains increased somewhat for the older groups during the remainder of the second quarter of 2022, ending June just under 50 percent elevated. The increase was larger for the youngest group, given the smaller starting balances and less pronounced balance declines in June—this group reached double their 2019 balances in early June 2022, and finished the month around 70 percent elevated.
These balance trends are interesting considering age differences in labor force participation trends. As noted in the previous Pulse release, labor force participation—the proportion of the civilian noninstitutional population currently in the labor force, measured by the Current Population Survey—regained much of its pandemic decreases by March 2022.7 For 18 to 34 year-olds, labor force participation rates had regained 90 percent of their pandemic drop by March 2022. That figure was 83 percent for 35 to 54 year-olds, but only 28 percent for those aged 55 years and over. The latest figures show relatively steady labor force participation between March and June 2022. Despite labor force participation rates remaining low, the 55 and older group continues to maintain elevated cash balances, ranging from 40 to 55 percent elevated relative to 2019 in the second quarter of 2022.
It is worth noting that households are placed into age groups based on the age of the primary account holder in January 2021. This means that as we extend our sample to include additional years of data, these age groups will all grow older. As has been well documented in prior research , younger age groups, particularly those under 35, have the highest income growth rates. As the 18-34 year old group in our data ages, they experience higher income growth than the other groups do, potentially inflating the balance growth that we observe in Figure 6.
Figure 6: At the end of June 2022, median checking account balances were 70 percent elevated for the youngest families, compared to just under 50 percent for older age groups.
Source: JPMorgan Chase Institute
As shown in the previous Pulse release, balances among CTC-targeted families decreased slightly in early 2022 following the end of advanced CTC payments, and increased again in late February, when families began receiving their tax refunds.8 Balances remained elevated throughout April and began decreasing in May, ending June 2022 around $2,700 compared to $3,300 throughout March and April. Non-targeted families followed a similar cash balance trajectory with less pronounced changes, ending June around $2,900 compared to $3,000 throughout March and April. Again, the June decreases were typical of seasonal fluctuations in balances, though occurring later than in past years, when tax-time balance gains were not held as long.
Figure 7: Cash balances remained elevated for advanced CTC recipients at the start of the second quarter of 2022, but began decreasing in May.
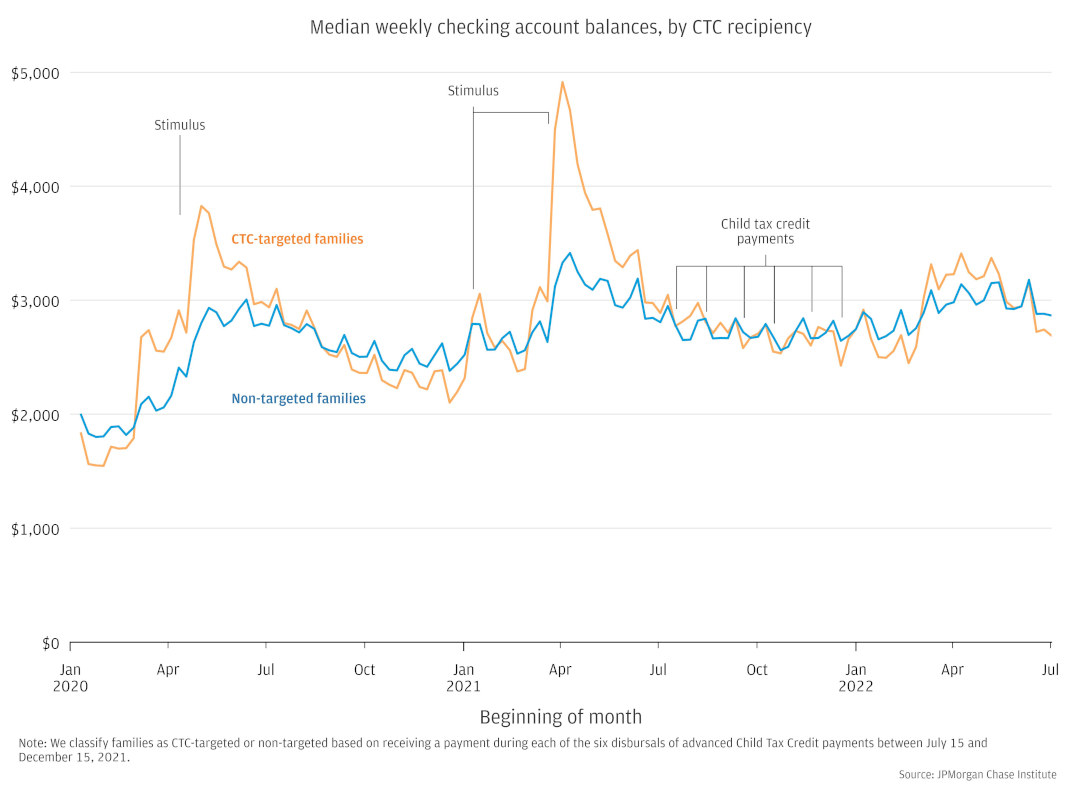
Source: JPMorgan Chase Institute
For the first four weeks of 2022, CTC-targeted families’ cash balances were 69 to 84 percent elevated relative to 2019, whereas non-targeted families’ balances were 58 to 71 percent elevated (Figure 8). This decreased after January, much more so for CTC-targeted families, who reached a low point of 16 percent elevation at the end of February, while non-targeted families remained 44 percent elevated. Elevations increased through the second quarter of the year, with CTC families ending June not far behind their non-targeted counterparts: 45 percent elevated compared to 55 percent.
The large changes in percent-change values for CTC-targeted families are due to differences in cash balance trajectories this year, compared to our reference year of 2019. While balances peaked around tax time in both years, 2019 balances quickly decreased following their peak. The prolonged balance elevation in 2022 (noted above) resulted in the increases in relative balance gains observed through April and May in Figure 8. Tax refunds this year have been smaller for many families, resulting in declines in cash balances relative to 2019 around the beginning of tax time in late-February (seen in Figures 2 and 6 as well). This decline has been most notable for CTC-targeted families. This is likely due to the difference between the advanced CTC payments distributed in 2021 and the CTC received in 2019. With half of the 2022 tax credit being disbursed in late 2021, families only received $1,500 or $1,800 per child at tax time in 2022, instead of the $2,000 per child in 2019. This difference in tax payments is consistent with absolute balance gains for CTC-targeted families during months that relative balances decreased.
Figure 8: In June 2022, cash balances among advanced CTC recipients were roughly 52 percent elevated compared to 60 percent among families who did not receive advanced CTC.
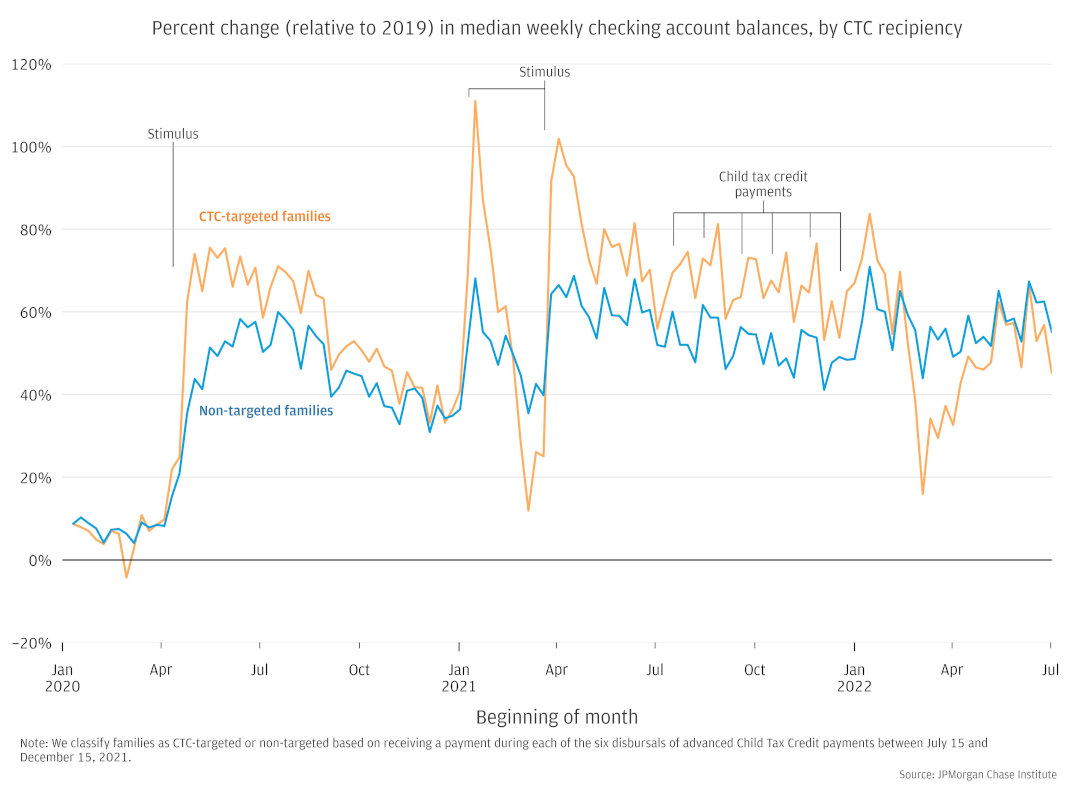
Source: JPMorgan Chase Institute
Our Household Pulse data asset covers 7.1 million families who were active checking account users between January 2019 and June 2022 and had at least $12,000 in adjusted income (see Box: Our updated income metrics) deposited to their Chase checking accounts every year in 2019, 2020 and 2021.
During the pandemic, the federal government provided cash assistance and relief to families through a range of fiscal interventions. Three rounds of stimulus, or Economic Impact Payments (EIP) provided cash benefits to families earning below specified income thresholds, with the dollar amount of the benefit determined by the size of the family, and progressively more paid per child in each round. Stimulus payments landed in April 2020, January 2021, and March 2021. Throughout this time, expanded unemployment insurance delivered payments to jobless workers, including gig workers and self-employed workers, with weekly supplements to typical benefits which were phased out in 2021. Finally, the American Rescue Plan increased the dollar amount of CTC payments and expanded eligibility for families in the 2021 fiscal year. Monthly advanced CTC payments were disbursed from July through December 2021, covering half of the total tax credit; the remainder will arrive when families file tax returns for the 2021 fiscal year.
https://home.treasury.gov/policy-issues/coronavirus/assistance-for-american-families-and-workers/economic-impact-payments
https://tcf.org/content/report/7-5-million-workers-face-devastating-unemployment-benefits-cliff-labor-day/
https://www.whitehouse.gov/child-tax-credit/
See Figure 29, which shows an upward trend of 11 percent per year for liquid assets—the deposits and cash equivalents in checking, savings, and Certificate of Deposit (CD) accounts—between January 2013 and December 2015.
https://www.jpmorganchase.com/content/dam/jpmc/jpmorgan-chase-and-co/institute/pdf/institute-coping-with-costs-report.pdf
For instance, the 2019 Survey of Consumer Finances shows that lower-income families hold a larger share of their financial wealth in checking accounts.
https://www.federalreserve.gov/econres/scfindex.htm
Data for 2019 through 2021 obtained via the following links:
https://www.bls.gov/cps/aa2019/cpsaat03.htm
https://www.bls.gov/cps/aa2020/cpsaat03.htm
https://www.bls.gov/cps/cpsaat03.htm
June 2022 data obtained from seasonally adjusted monthly info, Last Modified Date: August 05, 2022:
https://www.bls.gov/web/empsit/cpseea08b.htm
We thank our research team, specifically Edward Biggs and Carolyn Gorman, for their hard work and contribution to this research. Additionally, we thank Stephen Harrington, Annabel Jouard, and Robert Caldwell for their support. We are indebted to our internal partners and colleagues, who support delivery of our agenda in a myriad of ways, and acknowledge their contributions to each and all releases.
We are also grateful for the invaluable constructive feedback we received from external experts and partners. We are deeply grateful for their generosity of time, insight, and support.
We would like to acknowledge Jamie Dimon, CEO of JPMorgan Chase & Co., for his vision and leadership in establishing the Institute and enabling the ongoing research agenda. We remain deeply grateful to Peter Scher, Vice Chairman, Demetrios Marantis, Head of Corporate Responsibility, Heather Higginbottom, Head of Research & Policy, and others across the firm for the resources and support to pioneer a new approach to contribute to global economic analysis and insight.
This material is a product of JPMorgan Chase Institute and is provided to you solely for general information purposes. Unless otherwise specifically stated, any views or opinions expressed herein are solely those of the authors listed and may differ from the views and opinions expressed by J.P. Morgan Securities LLC (JPMS) Research Department or other departments or divisions of JPMorgan Chase & Co. or its affiliates. This material is not a product of the Research Department of JPMS. Information has been obtained from sources believed to be reliable, but JPMorgan Chase & Co. or its affiliates and/or subsidiaries (collectively J.P. Morgan) do not warrant its completeness or accuracy. Opinions and estimates constitute our judgment as of the date of this material and are subject to change without notice. No representation or warranty should be made with regard to any computations, graphs, tables, diagrams or commentary in this material, which is provided for illustration/reference purposes only. The data relied on for this report are based on past transactions and may not be indicative of future results. J.P. Morgan assumes no duty to update any information in this material in the event that such information changes. The opinion herein should not be construed as an individual recommendation for any particular client and is not intended as advice or recommendations of particular securities, financial instruments, or strategies for a particular client. This material does not constitute a solicitation or offer in any jurisdiction where such a solicitation is unlawful.
Wheat, Chris, Erica Deadman. 2022. “Household Pulse through June 2022: Gains for most, but not all.” JPMorgan Chase Institute. https://www.jpmorganchase.com/insights/all-topics/financial-health-wealth-creation/household-pulse-cash-balances-through-june-2022
Authors

Chris Wheat
President, JPMorganChase Institute

Erica Deadman
Consumer Research Lead