

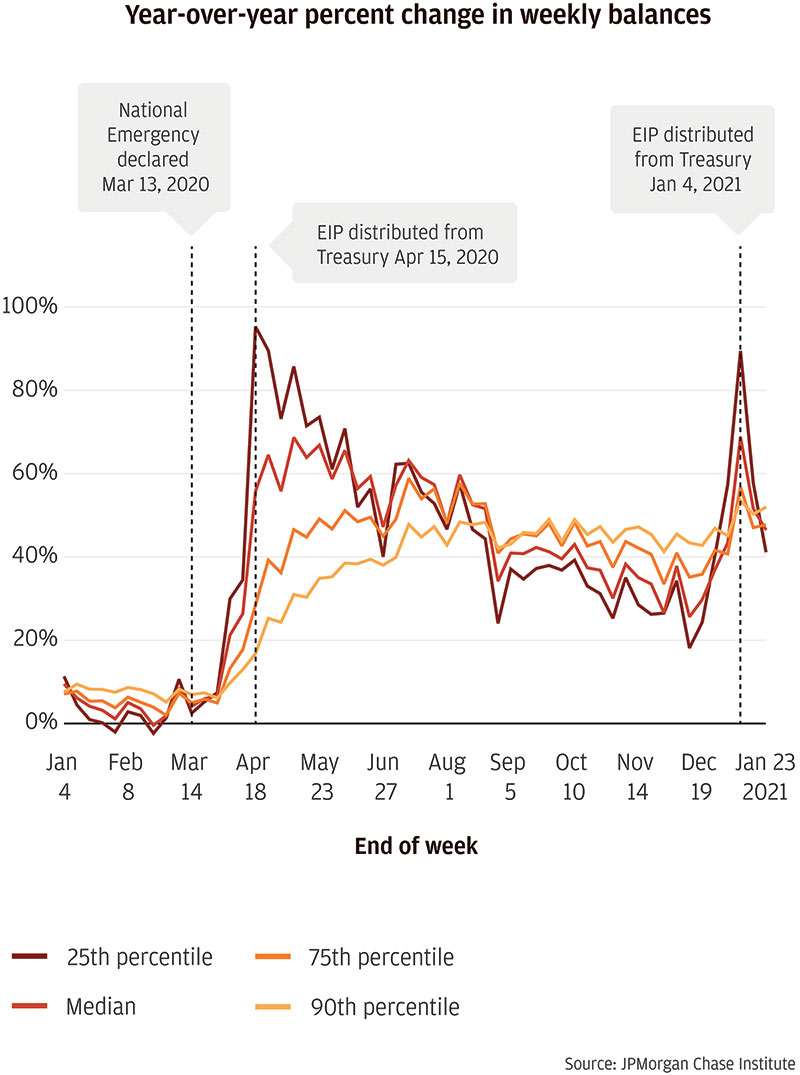
Balances increased across the distribution, with greater relative percent changes at the low end
Source: JPMorgan Chase Institute
Latest news

An Ohio-based company is protecting first responders around the world
With support from JPMorganChase, Fire-Dex is providing protective equipment to firefighters in 100 countries and all 50 states.
Learn moreLatest news

Veteran’s Unconventional Path to Landing her Dream Job in Tech
U.S. Army Veteran Ashley Wigfall transitioned to a civilian role and charted her path to technologist through mentorship and skills training at the JPMorgan Chase tech hub in Plano, Texas.
Learn more
Findings
More than a year after the declaration of national emergency on March 13, 2020, the COVID-19 pandemic continues to constrain economic activity in unprecedented ways. Restrictions on group gatherings and non-essential outings make certain businesses untenable, leading to layoffs and closures. In other industries, remote working has become the new normal, leading to dramatic shifts in daily needs and routines for employees. Schools have likewise struggled to reopen, with some forced back into remote instruction after increases in infections.
As families work to adapt to these frequently-changing conditions, economic health and stability are top of mind for policymakers. The most vulnerable among us have been impacted the most, with lower-income earners facing higher unemployment rates than their higher-earning counterparts (Ganong et al. 2020). The government responded with massive interventions to support households financially by funding stimulus checks, expanding and supplementing Unemployment Insurance (UI), and providing relief on debts.
In this report, we shed light on families’ financial positions during the pandemic, and how changes in behavior and policy have played a role. Using patterns in liquid balances as a lens into household finances, we aim to understand how the pandemic has affected financial vulnerability. Specifically, we focus on two main questions. First, how have liquid asset balances changed for families during the COVID-19 pandemic, and how does this differ across families—by demographic characteristics and industry of employment? And second, what are the drivers of these observed changes in balance? Specifically, how have consumer income, spending, and debt payments changed during the pandemic?
Balances increased across the distribution, with greater relative percent changes at the low end
Source: JPMorgan Chase Institute
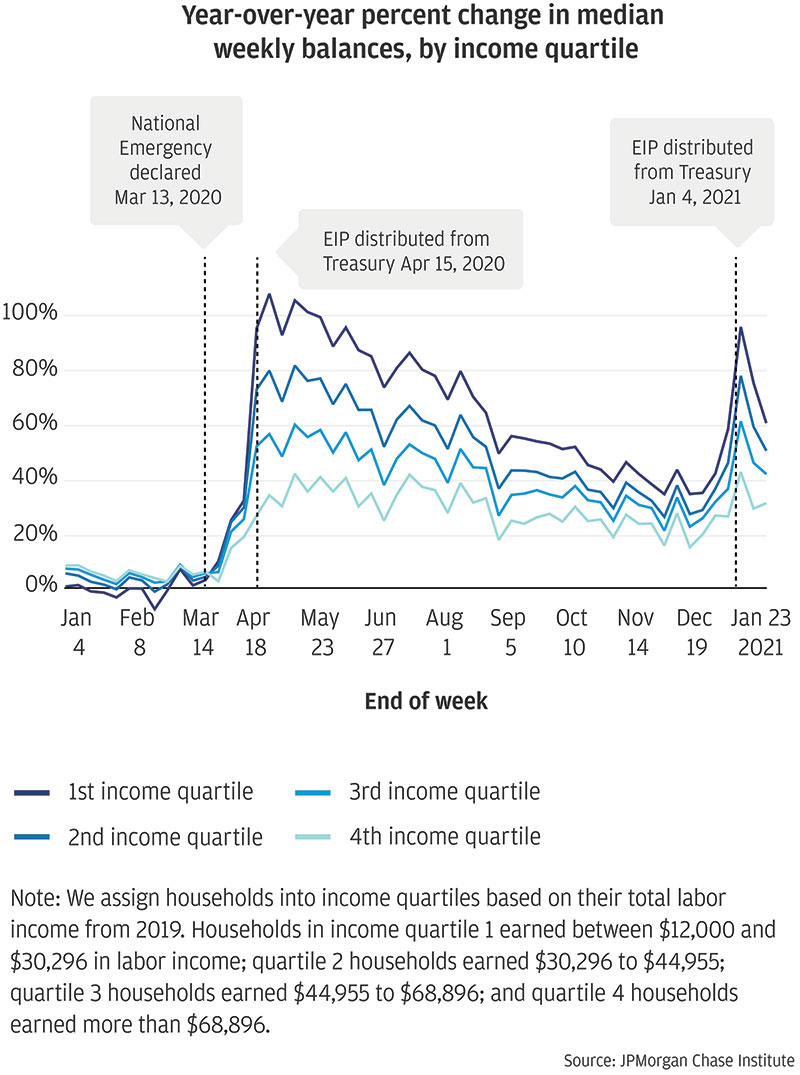
Low-income families saw the greatest year-over-year percent balance gains, but depleted those gains faster than high-income families
Source: JPMorgan Chase Institute
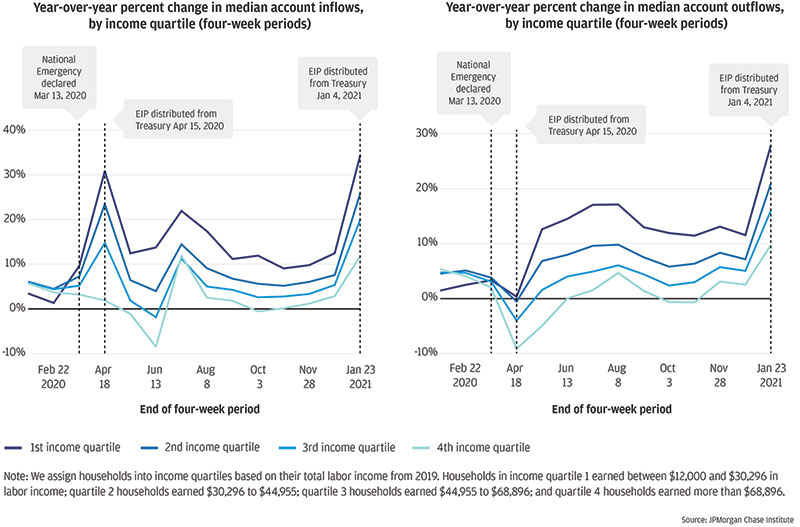
Balances grew initially due to increased account inflows and decreased outflows
Source: JPMorgan Chase Institute
Families had elevated cash buffers at the end of 2020, boosted again in January 2021 by a second round of stimulus. As we show above, the two rounds of stimulus boosted family cash balances to roughly 70 percent above the prior year in April 2020 and again in January 2021. Typically, families experience a further increase in cash balances during tax season, when most families receive tax refunds worth, on average, six weeks’ of income, fueling spending and saving for more than half the year (Farrell et al. 2019). Thus, cash buffers may remain elevated for some families into the first half of 2021, even without a third round of stimulus checks.
The spike in cash buffers after the second round of stimulus at the beginning of January 2021 appeared to be shorter-lived. While the balance gains following the first round of stimulus tapered off slowly throughout the remainder of the year, the balance gains from the second disbursement seemed to revert within the following weeks. There could be several factors contributing to the different patterns. First, the disbursement timeline for the second round was much more compact than the first. Second, spending—and outflows in general—were depressed during the spring of 2020, contributing positively to balances, absent a corresponding decrease in inflows. Given that outflows had mostly returned to typical levels by the end of 2020, that could partially explain a faster depletion of January 2021 balance gains. Finally, the second stimulus disbursement occurred when cash balances were still elevated, enabling families to use the stimulus funds more immediately rather than maintain them to further shore up cash buffer. We observe this via increases in spending, debt and credit card payments, and transfers to savings—all of which may have been on hold during the higher uncertainty of the early pandemic.
Social safety net and stimulus are playing a key role in boosting the cash buffers of families, especially low-income families, showing the importance of targeted support. On a percent basis, increases in cash balances were most pronounced for families in the lower income quartiles. Low-income families also experienced the largest increase in median total income during the pandemic, despite having the highest rate of job losses. Supplemental increases to UI benefits contributed to these increases in total income.
While liquid balances increased during the early period of the pandemic for all income quartiles, the ways in which income and expenditures contributed to those balances differed across the income spectrum. For most families, balances grew despite elevated outflows because of even larger increases in inflows, but high-income families experienced the reverse: balances grew despite decreases in inflows because of concurrent cuts in outflows. Families in the lowest three income quartiles exhibited year-over-year increases in spending and conditional debt and credit card payment amounts. They also experienced year-over-year increases in total income, supplemented by increases in unemployment insurance. The latter factors outweighed the former, resulting in growth in median checking account balances. In contrast, the highest-earning families had total income at parity with 2019 for most of the pandemic, representing a decrease relative to pre-pandemic elevation over the prior year. At the same time, their spending was below or at parity with 2019 levels, as were their debt payments. These decreases in outflow behavior were large enough to allow continued elevation in median balances for the highest-earning families, despite stable inflows.
A distributional view of the household sector is crucial to understanding the financial outcomes of the typical family during the pandemic. As shown in Finding One, balance trends differ by metric: means often remain steadily elevated while medians steadily decrease. This means that relying on aggregate average statistics alone may mask important changes in financial outcomes of the typical family. Moreover, aggregate statistics on the deposits of households and nonprofits as well as commercial banks do not isolate the outcomes of households as distinct from other sectors. This separation is critical to understanding the impacts of the pandemic and policies on the typical family.
We thank our research team, specifically Tanya Sonthalia and Yuning Liu, for their hard work and contributions to this research.
Additionally, we thank Anna Garnitz and Sruthi Rao for their support. We are indebted to our internal partners and colleagues, who support delivery of our agenda in a myriad of ways, and acknowledge their contributions to each and all releases.
We would like to acknowledge Jamie Dimon, CEO of JPMorgan Chase & Co., for his vision and leadership in establishing the Institute and enabling the ongoing research agenda. We remain deeply grateful to Peter Scher, Head of Corporate Responsibility, Heather Higginbottom, President of the JPMC PolicyCenter, and others across the firm for the resources and support to pioneer a new approach to contribute to global economic analysis and insight.
Authors

Fiona Greig
Former Co-President

Erica Deadman
Consumer Research Lead, JPMorganChase Institute

Pascal Noel
Neubauer Family Assistant Professor of Finance at the University of Chicago Booth School of Business