
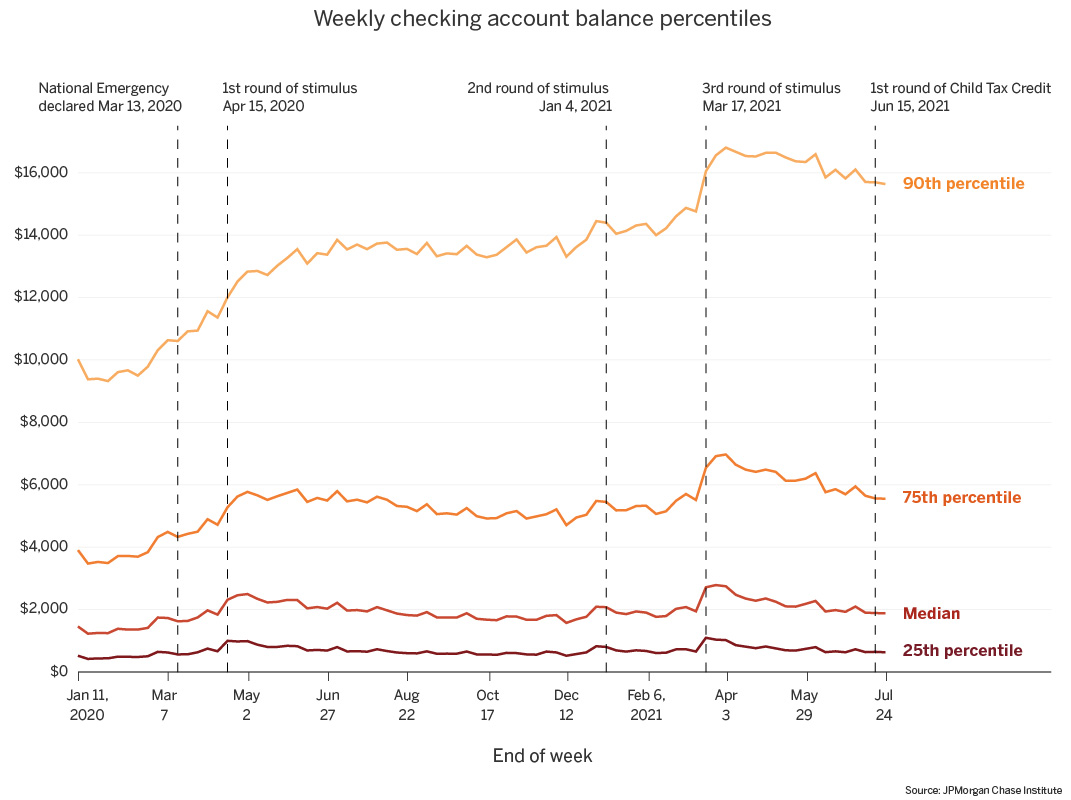
Figure 1: Cash balances increased with the arrival of each round of stimulus, and remain elevated relative to pre-pandemic levels
Latest news

An Ohio-based company is protecting first responders around the world
With support from JPMorganChase, Fire-Dex is providing protective equipment to firefighters in 100 countries and all 50 states.
Learn moreLatest news

Nationwide decline in housing affordability hits lower-income areas of Columbus
Learn moreLatest news

Veteran’s Unconventional Path to Landing her Dream Job in Tech
U.S. Army Veteran Ashley Wigfall transitioned to a civilian role and charted her path to technologist through mentorship and skills training at the JPMorgan Chase tech hub in Plano, Texas.
Learn more
The COVID-19 pandemic resulted in an unprecedented recession that impacted families’ financial positions. The JPMorgan Chase Institute leverages de-identified administrative banking data to assess checking account balances in conjunction with household income and spending. Based on recent JPMC Institute research, this Household Finances Pulse analyzes changes in cash balances during the COVID-19 pandemic and ongoing recovery across the distribution of cash balances and by income quartile.
During the pandemic, the federal government provided cash assistance directly to families through stimulus payments, unemployment insurance, and most recently, the Advanced Child Tax Credit (CTC). The first round of stimulus, or economic impact payments (EIP), started April 15, 2020 and delivered up to $1,200 per adult and $500 per qualifying child. A second round of EIP was distributed in January 2021, providing up to $600 per eligible adult or child The third round of stimulus was paid out beginning March 17, 2021, providing $1,400 per eligible adult or child. Throughout this time, expanded unemployment insurance delivered payments to jobless workers, including gig workers and self-employed workers, with a $600 weekly supplement between March and July 2020, and a $300 weekly supplement during October of 2020 and since January 2021. Twenty-six states phased such expansions in both eligibility and payment supplements in June and July 2021. On July 15, 2021, the first monthly Advanced Child Tax Credit payments were delivered, paying up to $300 per child under 6 years of age and up to $250 per child aged 6 to 17 years.
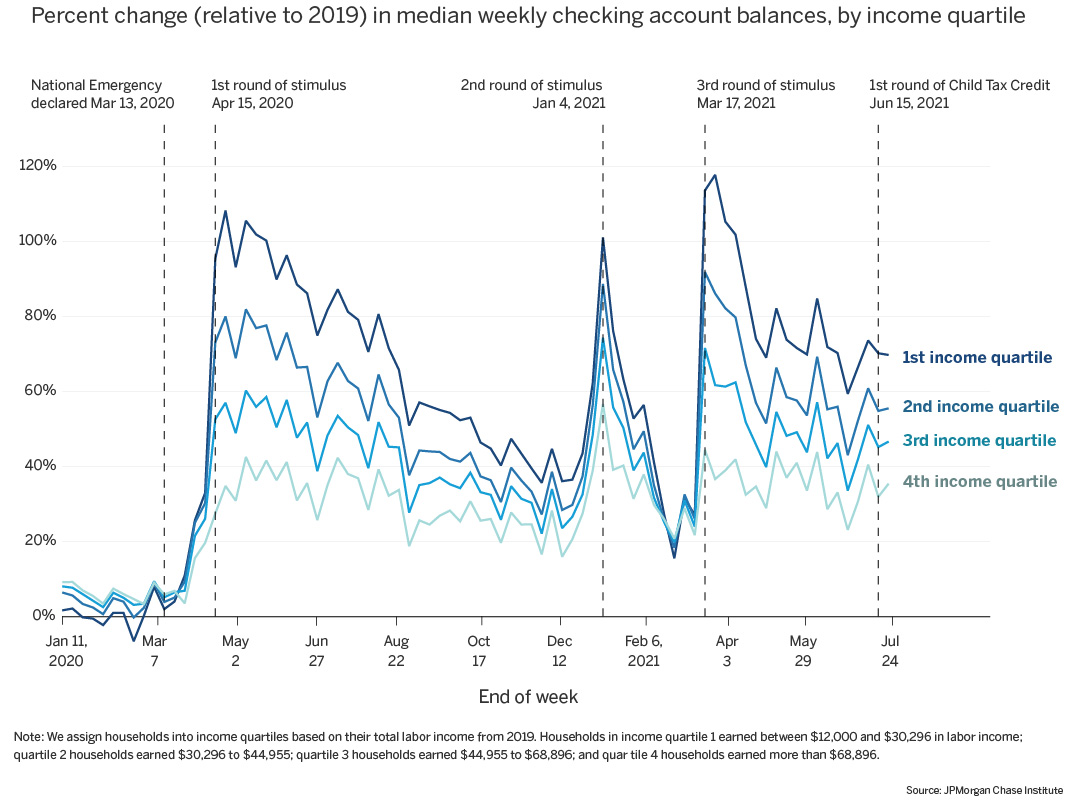
Median cash balances are more than 50 percent higher as of the end of July 2021 compared to the same period in 2019. As shown in Figures 1 and 2, we observe a greater percent increase in the 90th percentile of balances, suggesting continued growth, particularly at the top end of the liquid asset distribution. In addition, Figures 3 and 4 reveal that the balances of lower-income families (income quartile 1) are roughly 70 percent higher than 2019 levels, while higher-income families (income quartile 4) have balances roughly 35 percent higher than 2019 levels.
Following each round of stimulus, the low end of the liquid assets distribution and families with low incomes experienced larger proportional increases in balances but also faster depletion of those balance gains in the weeks after the stimulus, showing the importance of targeted support. Figures 1 and 3 show that the third round of stimulus was much larger in magnitude than the second round of stimulus, and delivered at a time when cash balances were already high. Possibly as a result, the balance gains from round three appear to be depleting more slowly than those from round two (Figures 2 and 4).
Given its smaller size and reach compared to stimulus payments, the Advanced Child Tax Credits did not result in a large cash boost seen with each round of stimulus. That said, the Advanced CTC is a monthly payment that may be slowing the depletion of balance gains from the third stimulus, thus supporting family cash buffers during the COVID pandemic. The aggregate magnitude of the Advanced Child tax credit payment is small relative to the other forms of government cash assistance discussed above. According to Treasury statements, the Federal Government disbursed $12.7 billion in Advanced Child Tax Credits in July 2021 compared to $28.3 billion in Unemployment Benefits in the same month (and $39.1 billion in June 2021), and more than $400 billion in the third round of Economic Impact Payments. Put differently, Advanced CTC was roughly half the size of federal UI payments in July and just 3 percent of the magnitude of the third round of stimulus.
These aggregate values are smaller in part because the share of families receiving the payment is smaller—roughly 35 million households with children, or 27 percent of the total 128 million households in the U.S., received the payments. In contrast, roughly 85 percent of adults received a stimulus check. In addition, the magnitude of the payment per family is smaller for the Advanced CTC than for any of the three rounds of stimulus. Importantly, leading up to the arrival of the Advanced CTC payment cash balances of families are falling. Thus, Advanced CTC may be helping to slow the spend down of cash balances after the third round of stimulus.
Figure 1: Cash balances increased with the arrival of each round of stimulus, and remain elevated relative to pre-pandemic levels
Figure 2: Cash balances increased with the arrival of each round of stimulus, with larger percent increases at the low end of the distribution
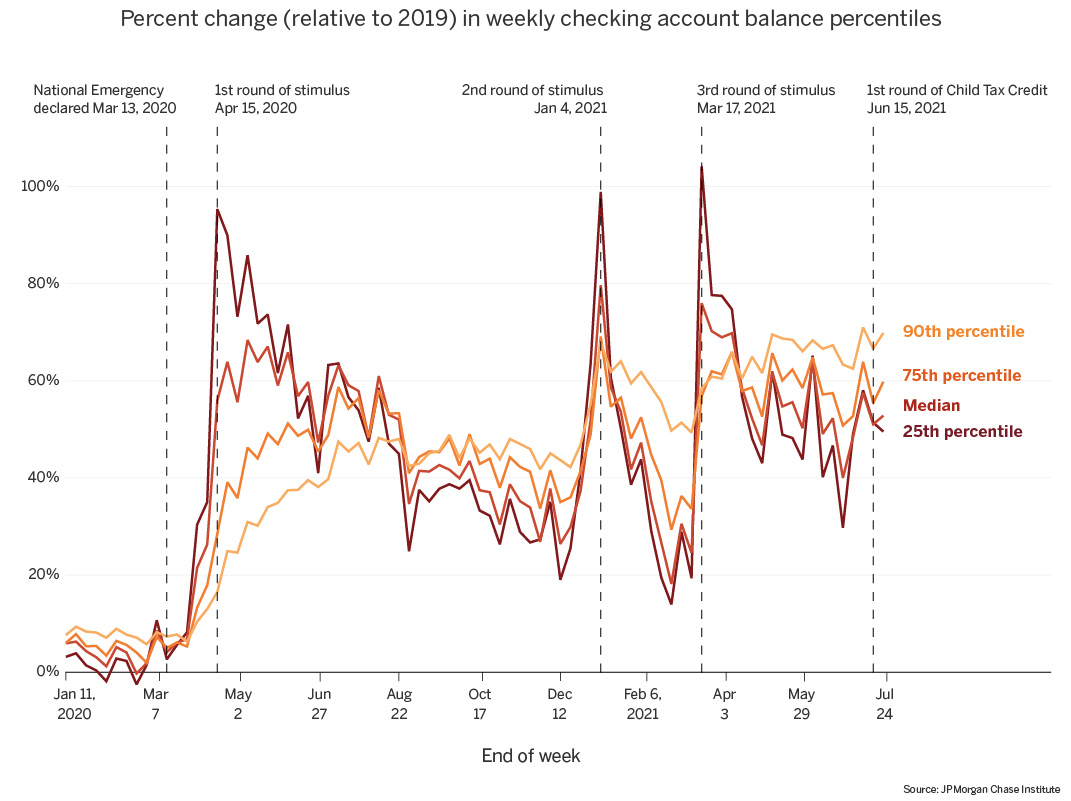
Figure 3: For families at all income levels, cash balances increased with the arrival of each round of stimulus, and remain elevated relative to pre-pandemic levels
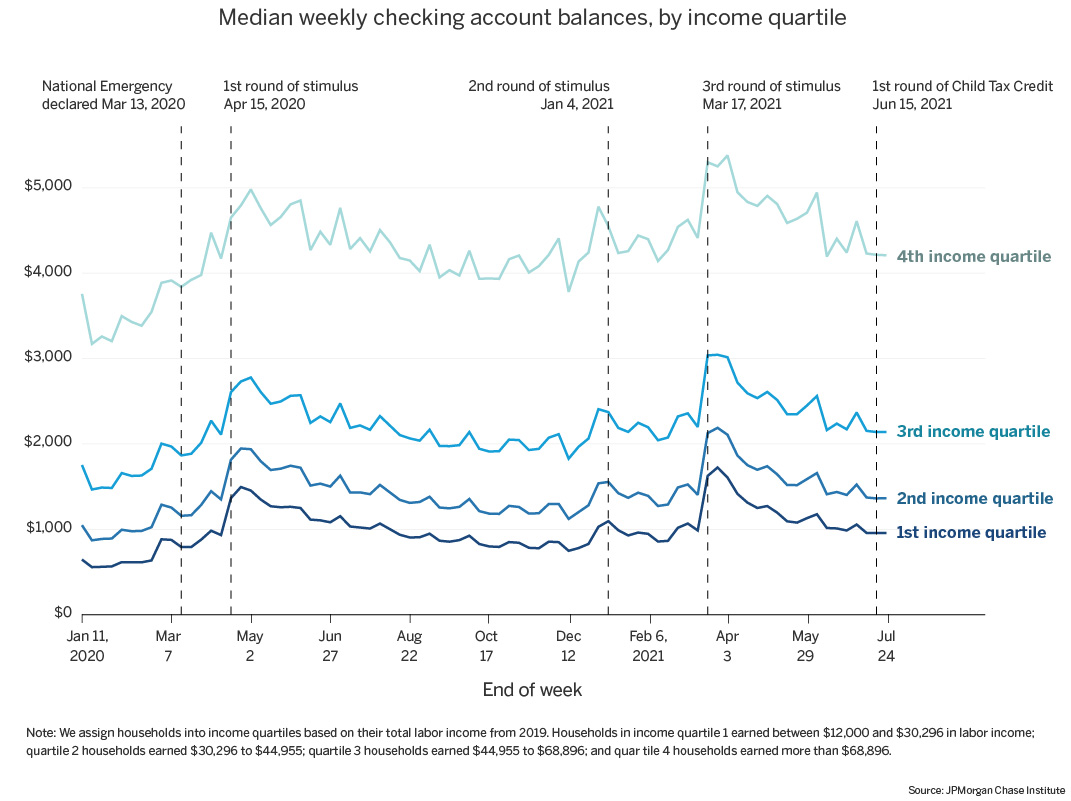
Figure 4: With each round of stimulus, low-income families saw the greatest percent gains in cash balances, but depleted those gains faster than high-income families
We thank our internal partners for his their support, specifically Anthony Rivera. We are indebted to our internal partners and colleagues, who support delivery of our agenda in a myriad of ways, and acknowledge their contributions to each and all releases.
We would like to acknowledge Jamie Dimon, CEO of JPMorgan Chase & Co., for his vision and leadership in establishing the Institute and enabling the ongoing research agenda. We remain deeply grateful to Peter Scher, Vice Chairman, Demetrios Marantis, Head of Corporate Responsibility, Heather Higginbottom, Head of Research & Policy, and others across the firm for the resources and support to pioneer a new approach to contribute to global economic analysis and insight.
This material is a product of JPMorgan Chase Institute and is provided to you solely for general information purposes. Unless otherwise specifically stated, any views or opinions expressed herein are solely those of the authors listed and may differ from the views and opinions expressed by J.P. Morgan Securities LLC (JPMS) Research Department or other departments or divisions of JPMorgan Chase & Co. or its affiliates. This material is not a product of the Research Department of JPMS. Information has been obtained from sources believed to be reliable, but JPMorgan Chase & Co. or its affiliates and/or subsidiaries (collectively J.P. Morgan) do not warrant its completeness or accuracy. Opinions and estimates constitute our judgment as of the date of this material and are subject to change without notice. The data relied on for this report are based on past transactions and may not be indicative of future results. The opinion herein should not be construed as an individual recommendation for any particular client and is not intended as recommendations of particular securities, financial instruments, or strategies for a particular client. This material does not constitute a solicitation or offer in any jurisdiction where such a solicitation is unlawful.
Authors

Fiona Greig
Former Co-President

Erica Deadman
Consumer Research Lead

Tanya Sonthalia
Research Associate