Research

The Consumer Response to a Year of Low Gas Prices

Evidence From 1 Million People

July 1, 2016

In 2015, gas prices in the United States were 25 percent lower than they had been in 2014. The US Energy Information Administration projected that this drop in prices would put roughly $700 back into the pockets of US households. Understanding in detail how big this boost really was, who experienced it, and how people responded has important implications for the economy and policymakers.

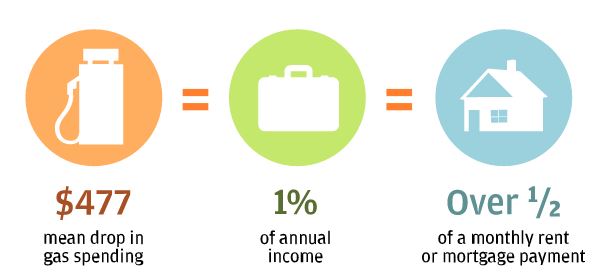
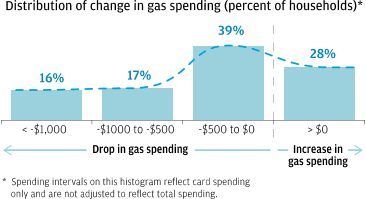
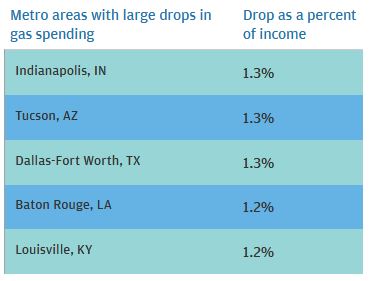
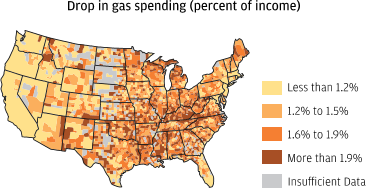
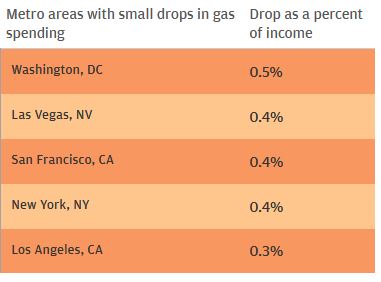
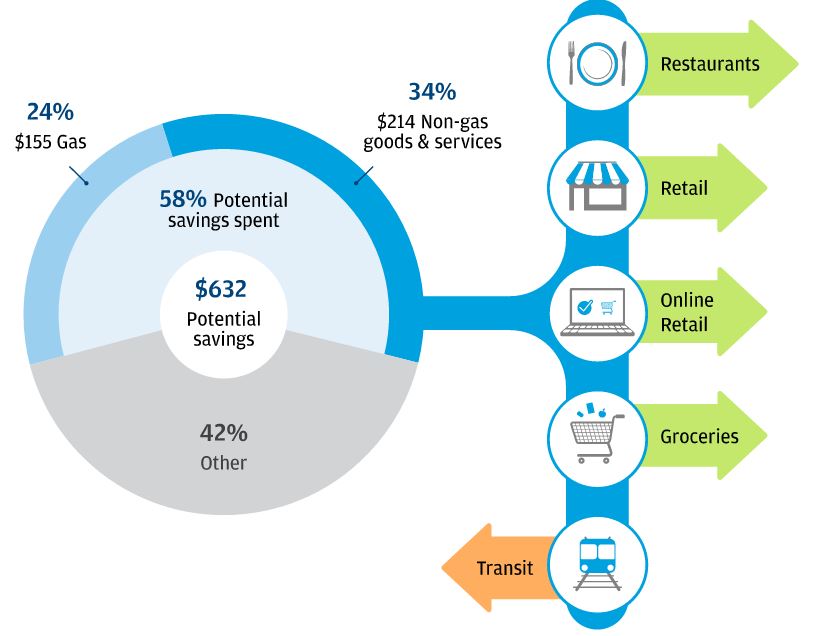
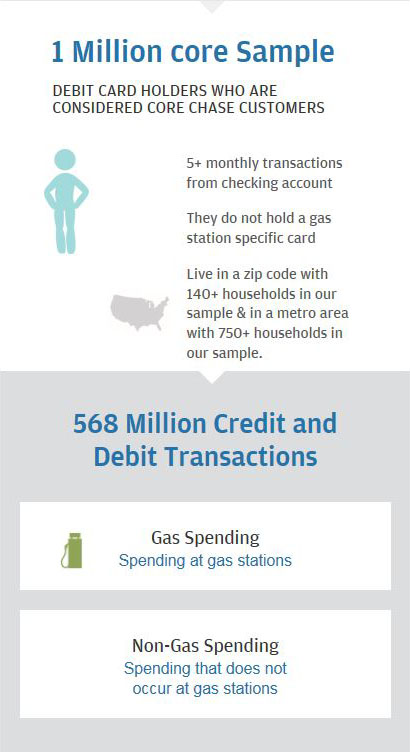
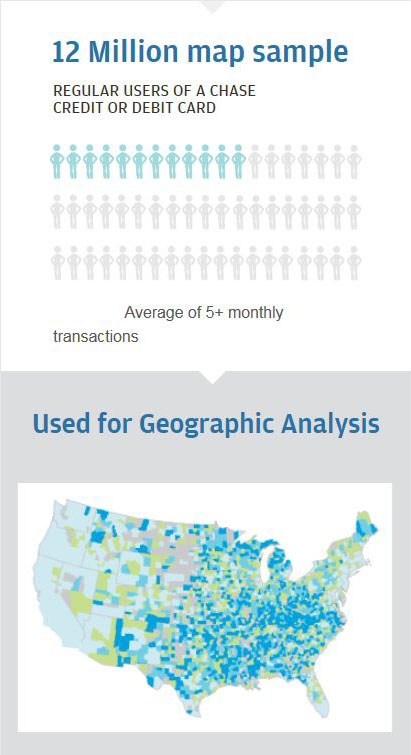
This report relies on an anonymized sample of one million Chase customers across 23 states to quantify the impact of lower gas prices in 2015. Middle-income households spent about $480 less on gas in 2015 than in 2014, the equivalent of more than a one percent increase in annual income for 60 percent of households. The drop in gas spending between 2014 and 2015 varied across the country, with lower impacts felt in the West and urban areas of the Northeast. Households had the potential to save $630 at the pump, of which they spent the majority—58 percent—primarily on non-gas goods and services such as restaurants and retail.

Our data, drawn from 57 million Chase regular debit and credit card customers illuminated the effects declining gas prices had across the US. These four findings cover gas spending and savingswho was the most and least impacted and how lower gas prices impacted consumer spending.

01

Middle-income households spent about $480 less on gas in 2015 than in 2014. Reductions in gas spending were equivalent to a one percent or greater increase in income for 60 percent of households.

Middle-income households experienced a $477 drop in gas spending from 2014 to 2015. This is a significant amount for middle-income individuals, equal to roughly 1 percent of income or more than half a month’s rent or mortgage payment.

60 percent of households—those in the bottom three income quintiles—experienced savings at the pump that were equivalent to at least 1 percent of annual income.

Infographic describe  Middle-income households

$477 mean drop in gas spending

1% of annual incom

Over 1/2 of a monthly rent or mortgage payment

01

Seventy-two percent of households spent less on gas in 2015 than in 2014, but households in the West and Northeast were impacted the least.

Most impacted: Seventy-two percent of households spent less on gas in 2015 than in 2014, including one in three households that saved more than $500.

Bar garph describes Distribution

Distribution of change in gas spending (percent of households)

Bar garph describes metro areas
Metro areas with large drops in gas spending Drop as a percent of income
Indianapolis, IN 1.3%
Tucson, AZ 1.3%
Dallas-Fort Worth, TX
1.3%
Baton Rouge, LA 1.2%
Louisville, KY 1.2%

Least impacted: Households in the West and Northeast were impacted the least.

Infographic describes Drop in gas spending

Drop in gas spending (percent of income)

Bar garph describes about metro areas with small drops in gas spending
Metro areas with small drops in gas spending Drop as a percent of income
Washington, DC 0.5%
Las Vegas, NV 0.4%
San Francisco, CA 0.4%
New York, NY 0.4%
Los Angeles, CA 0.3%
01

Households spent over $200—45 percent of their drop in gas spending—on things other than gas, primarily on restaurants and retail.

Households spent over $200 on non-gas goods and services, primarily on restaurants, retail, and groceries. Gains in these categories were offset by declines in Transit spending.

01

Households spent over $150 of their potential savings from lower gas prices declines at gas stations. Including this additional spending at gas stations, households spent 58 percent of their potential savings.

The 25 percent drop in gas prices generated a potential savings of $632 for middle-income households. Households spent 58 percent of their potential savings – 34 percent on non-gas goods and services and 24 percent on gas.

Infographic describes  the 25 percent drop in gas prices

24% $155 gas

58% Potential savings spent

42% Other

34% $214 Non-gas goods and services

$632 Potential Savings

Data

From a universe of over 57 million anonymized debit and credit card account holders nationwide, we created samples of 12 million regular card users and 1 million core Chase customers.

Gas prices were 25 percent lower in 2015 than in the prior year. From a universe of 57 million debit or credit card account holders we created samples of 1 million core Chase customers and 12 million regular card users. We ascertain the magnitude of savings households experienced from lower gas prices, and whether and on what they spent these windfall gains.

Infographic describes  57 Million Debit or Credit card account holders

57 Million Debit or Credit card account holders

Infographic describes a sample

1 Million core sample

Infographic describes 12 Million Debit or Credit card account holders sample

12 Million map sample

Authors

Diana Farrell

Diana Farrell

Founding and Former President & CEO

Fiona Greig

Fiona Greig

Former Co-President