Research

How falling gas prices fuel the consumer

Evidence from 25 million people. 


October 2015

Findings

The US government projects that American households will save on average $700 this year on gasoline, as the price of a gallon of gas has fallen by nearly $1.50 from its peak of $3.70 in April 2014 and is projected to remain low through 2015. But who feels the biggest increase in spending power? How much of that extra money do consumers spend, and what do they spend it on?

Until now, the answer to that question has come from surveys or estimates based on aggregate data and has indicated that less than half of the money saved at the pump was spent. However, this report by JPMorgan Chase Institute shows that individuals are spending roughly 80% of that extra money. With lower gas prices expected to last through the year, this extra disposable income is fueling consumer spending on categories other than gas.

Our data, drawn from 57 million Chase regular debit and credit card customers illuminated the effects declining gas prices had across the US. These four findings cover gas spending and savingsgeographic locationage and income level, and consumer spending.

01

Gas spending and the savings associated with gas price declines varied dramatically among U.S. individuals.

Median Americans spent on average $101 per month on gas between December 2013 and February 2014 when gas prices were high. High-gas spenders (the top 20% of gas spenders) spent $359 per month on gas using their credit and debit cards, more than triple the typical American, and low-gas spenders (the bottom 20% of gas spenders) spent only $2 per month, less than 2% of the typical American.

A year later, when gas prices hit their low point, the average American saved $22 per month on gas, but there was significant variation among individuals. Twenty-three percent of the population decreased their gas spending by 50% or more, and 16% increased their gas spending by 50% or more.

Infographic: Gas spending and the savings associated with gas price declines varied dramatically among U.S. individuals

$359 High-Gas Spenders

$101 Typical Gas Spenders

$2 Low-Gas Spenders

150x

01

People in the South and Midwest spent more on gas and saw larger increases in disposable income when gas prices declined relative to those on the East and West coasts.

People in the South and Midwest spent more on gas and saw larger increases in disposable income when gas prices declined relative to those on the East and West coasts. In the Midwest and South, “higher-impact states,” people saw the largest percentage declines in gas prices and gas spending as a fraction of income. In the East and West, “lower-impact states,” people saw smaller drops in gas prices and gas spending as a fraction of income. Initially, people in higher-impact states typically paid lower gas prices and consumed more gas than people in lower-impact states.

Infographic: People in the South and Midwest spent more on gas and saw larger increases in disposable income when gas prices declined relative to those on the East and West coasts
    Initial Gas Prices Initial Quantity of Gas Consumed Drop in Gas Prices
Higher-Impact States: Large Drop in Gas Spending Midwest: IA IN KS MI MO OH SD
South: AL KY LA MS OK TN TX
Low High High
Lower-Impact States
Small Drop in Gas Spending
East: CT DE DC FL MA MD NC NY PA
West: AK CA HI NV OR WA
High Medium Low
01

Savings at the gas pump represented more than 1% of monthly income for low-income individuals and disproportionately impacted younger Americans.

Although gas spending was highest among men, 30- to 49-year-olds and high-income earners, spending on gas represented a larger share of income for men, 18- to 29-year-olds and low-income earners than for other individuals as a whole.

Infographic: Savings at the gas pump represented more than 1% of monthly income for low-income individuals and disproportionately impacted younger Americans

AMOUNT OF $

Age  
30-39: $156
70+: $59  
Income  
$107: Low Income $160: High Income


% of INCOME

Age  
18-29: 3.4% 70+: $1.4%
Income  
5.6%: Low Income 1.5%: High Income

Increase in purchasing power from drop in gas spending

Notably, the recent low point in gas prices in January of 2015 yielded gas savings that represented 1.1% of monthly income for low-income individuals, equivalent to 1.6% of monthly income when projecting total gas spending and not just credit and debit card transactions.

Bar graph showing an increase in purchasing power from a drop in gas spending.
Group Based on a projection of total spending Based on Chase debit and credit card spending
Income Quintile 1 ($0 - $29,999) 1.6% 1.1%
Income Quintile 2 ($30,000 - $41,999) 1.3% 0.9%
Income Quintile 3 ($42,000 - $54,999) 1.1% 0.8%
Income Quintile 4 ($55,000 - $79,699) 0.9% 0.6%
Income Quintile 5 ($79,700 +) 0.5% 0.3%
01

Individuals spent roughly 80% of their savings from lower gas prices.

Individuals spent roughly 80% of their savings from lower gas prices. For every dollar less spent at the gas pump, individuals spent roughly 80 cents (72 - 89 cents) on other things. Almost 20% of the gas savings were spent at restaurants, but department stores, entertainment and electronics and appliances also saw significant gains.

Infographic: Individuals spent roughly 80% of their savings from lower gas prices.

ROUGHLY 80% SPENT ON NON-GAS CATEGORIES

Other:

  • Durable Goods
  • Non-Durable Goods
  • Services

Data

From a universe of over 57 million anonymized debit and credit card account holders nationwide, we created samples of 25 million regular card users and 1 million core Chase customers.

Drawing from a universe of over 57 million anonymized customers, we created samples of 25 million regular debit and credit card holders and 1 million core Chase customers to shed new light on the effects of gas price decreases on consumer spending. We examined spending behavior as prices dropped 45% to their recent trough in January 2015 to determine who experienced the biggest increase in spending power, how much money they spent, and what they bought. Answers to these questions are good indicators of what we can expect going forward if gas prices remain at these lower levels, as projected.


A closer look at the data used in this report.

25.6 million regular users of a Chase credit or debit card with an average of 5+ monthly transactions.

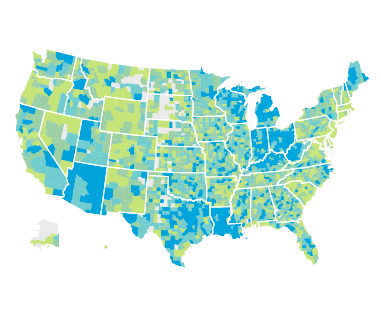
Map of United States used for geographic analysis.

Infographic showing sources of data used for this report.

1 Million DEBIT CARD HOLDERS WHO ARE CONSIDERED CORE CHASE CUSTOMERS

5+ monthly transactions from checking account

They do not hold a gas station specific card

Live in a zip code with 140+ other individuals in our sample.


376 Million Credit and  Debit Transactions

Gas Spending | Spending at gas stations

Non-Gas Spending | Spending that does not occur at gas stations

Conclusion

We conclude that people are spending their savings from the pump to a greater extent than previously thought, and that the recent gas price declines are fueling growth in personal consumption in nongas categories. This boost to consumers spending could be here to stay and even strengthen with time if gas prices remain low or continue to decrease as predicted. On the other hand, a substantial increase in gas prices might proportionately dampen consumer spend. We present evidence that the gains in discretionary spending from lower gas prices disproportionately accrue to low-income individuals, young people, and the Midwest and South, where people tend to spend more on gas. These regional and demographic differences are important inputs as policy makers consider gas tax reforms. Notwithstanding the environmental and infrastructure impacts from increased gas consumption, lower gas prices are good news for the U.S. consumer.

Authors


Diana Farrell

Diana Farrell

Founding and Former President & CEO

Fiona Greig

Fiona Greig

Former Co-President