

Figure 1: Retail investors’ exposure to market risk in their portfolios increased during the pandemic, then partially receded.
Latest news

An Ohio-based company is protecting first responders around the world
With support from JPMorganChase, Fire-Dex is providing protective equipment to firefighters in 100 countries and all 50 states.
Learn moreLatest news

Veteran’s Unconventional Path to Landing her Dream Job in Tech
U.S. Army Veteran Ashley Wigfall transitioned to a civilian role and charted her path to technologist through mentorship and skills training at the JPMorgan Chase tech hub in Plano, Texas.
Learn more
Research
October 1, 2024
Individual participation in financial market investment expanded significantly over the past decade, with considerable growth during the COVID-19 pandemic. The share of U.S. households with at least some stock holdings reached a record high as of 2022, according to data from the Federal Reserve,1 and the monthly percentage of individuals moving money from checking to brokerage accounts was three to four times higher during the pandemic than in the preceding years (Wheat and Eckerd, 2024a, 2024b).2 3 Consequently, a broader segment of the population has engaged in opportunities to generate additional wealth for retirement, home purchases, and savings for times of hardship, albeit while accepting market risk.
A significant factor in the rise of investing participation was the widespread availability of online self-directed brokerage accounts.4 These accounts provided easier access to capital markets for individuals who might otherwise be unable to invest, including those with limited liquid assets5 or without employer-provided retirement accounts. Given this expansion, policymakers have increasingly focused on understanding the tradeoffs between encouraging more individuals to invest and the heightened financial risks, especially for inexperienced investors.6 Timely data on investment risk in retail investors’ portfolios are limited.7 Prior research on behavior of retail investors predates the recent growth in investing and does not provide a direct measure of the potentially changing connection between financial markets and household portfolios.8 9
Our research aims to fill these gaps by examining investment portfolios in self-directed brokerage accounts. We use a new de-identified dataset of 500,000 investors spanning the years 2019 to 2023.10 The dataset includes holdings in stocks, mutual funds, ETFs, fixed income, cash and cash-equivalents. We measure risk to quantify the trade-offs retail investors made when selecting investments. Generally, higher risk implies a greater potential for losses, and to compensate, investors typically expect higher returns.
Our most notable finding is that market risk in portfolios rose substantially in 2020 and remained elevated through 2023, indicating that the average investor faced greater fluctuations in their portfolio value relative to the stock market. Going forward, these investors may also expect higher potential long-term wealth accumulation, given the historical tendency for the market to rise over time. Coupled with the research showing broader participation in investing, our findings indicate a stronger link between individuals’ wealth and financial markets than before the pandemic. Policymakers, including those at the Federal Reserve, should consider this relationship when assessing the impact of macroeconomic policy on individuals.
This report also examines how portfolio risk varied by investor sub-groups, including cohorts based on account start date, gender, and age. Our results indicate that investors establishing new accounts in 2020 and 2021 took on more risk than those in adjacent periods, likely influenced by unique market conditions and heightened attention to stock trading during the pandemic. We also find that women’s portfolios held less investment risk than men’s, and younger investors held more market risk than older investors.
These differences by cohort, gender, and age highlight the importance of providing investors with educational information about investment risks. While our analysis does not determine whether investors chose the appropriate level of risk for their financial objectives, our results highlight the need for accessible education tailored to diverse goals. Financial literacy can help investors better leverage the opportunities that self-directed accounts offer for wealth accumulation.
Our overall findings are summarized as follows:
Background: Investment risk and retail investors’ portfolios
We use granular data to assess risk in investment portfolios. Investment risk describes the trade-offs investors make when selecting investments. Securities with higher risk metrics typically have a greater likelihood or magnitude of potential losses, and investors expect higher returns to compensate. We consider two general risk categories: market (or systematic) risk, which affects the entire stock market, and idiosyncratic (or unsystematic) risk, such as single-stock volatility, which can be mitigated through diversification.
Our findings measure three portfolio risk metrics, encompassing both systematic and unsystematic risk along with a measure that captures the portion of return variation attributable to the former. In calculating these metrics, we use the S&P 500 as our market benchmark in regression models with portfolio and security returns. Appendix 2 provides further detail on the construction of these metrics.
We organize our analysis of retail investor risk dynamics around three findings. Finding 1 examines how exposure to market risk evolved from 2019 through 2023. Here, we focus solely on market risk due to limitations in accurately capturing changes in the other metrics over a short-time window. Findings 2 and 3 explore how all three types of portfolio risk varied across different investor cohorts and demographic characteristics, providing a comprehensive view of portfolio risk among retail investors. Appendix 2 provides further details on the construction of these metrics.
Market risk in retail investors’ portfolios increased on average by 15 percent from 2019 to 2021 and remained elevated through 2023.
Growth in retail investment activity during the pandemic was substantial. As of mid-2020, individuals were three to four times more likely to transfer money from checking accounts into retail brokerage accounts than they were from 2010 to 2015 (Wheat & Eckerd, 2024a). While increased investment participation is well-documented, relatively little is known about how individuals managed their risk in self-directed brokerage accounts during this time period.
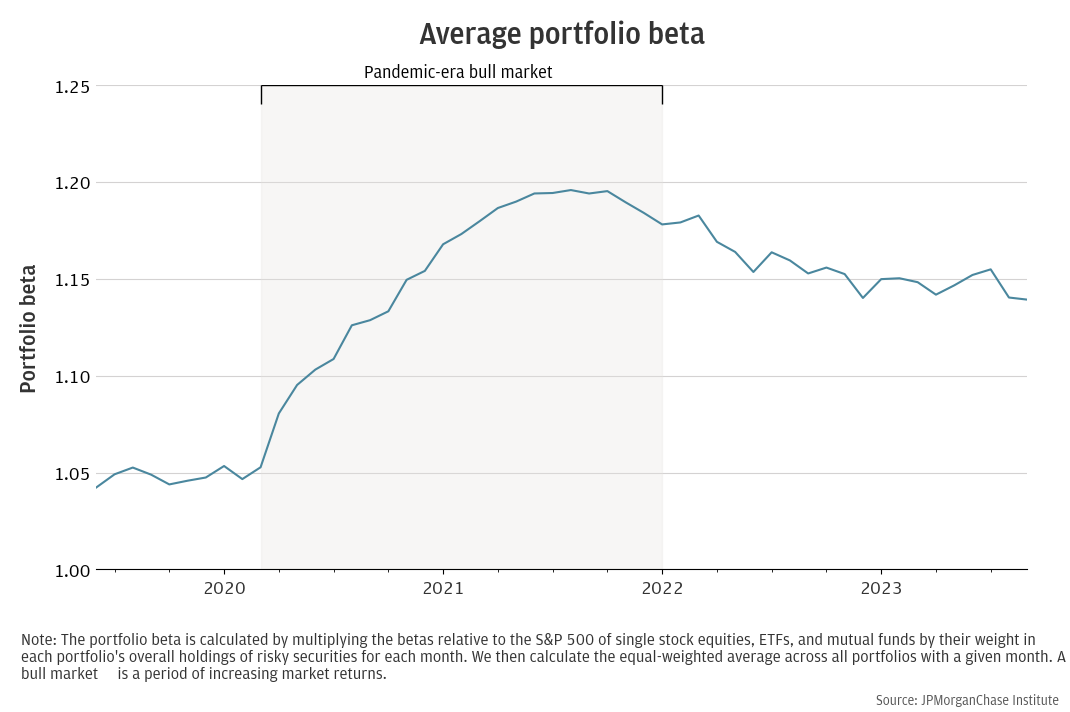
To document the evolution of market risk, we examine the exposure of retail investor holdings to changes in the U.S. stock market. We compute the beta of securities held in portfolios using the S&P 500 as the market benchmark.11 Figure 1 shows the average portfolio beta in our sample from 2019 to 2023. To focus our analysis on the risk-taking of typical investors, we present the equal-weighted12 average beta.13 These results indicate that investors’ portfolios assumed greater market risk during the pandemic bull market. Average portfolio beta began to rise sharply in March 2020, peaking in December 2021 at nearly 15 percentage points higher than the 2019 level. Although market risk levels started to decline after this peak, they remained 10 percentage points higher by mid-2023 than in 2019.
Figure 1: Retail investors’ exposure to market risk in their portfolios increased during the pandemic, then partially receded.
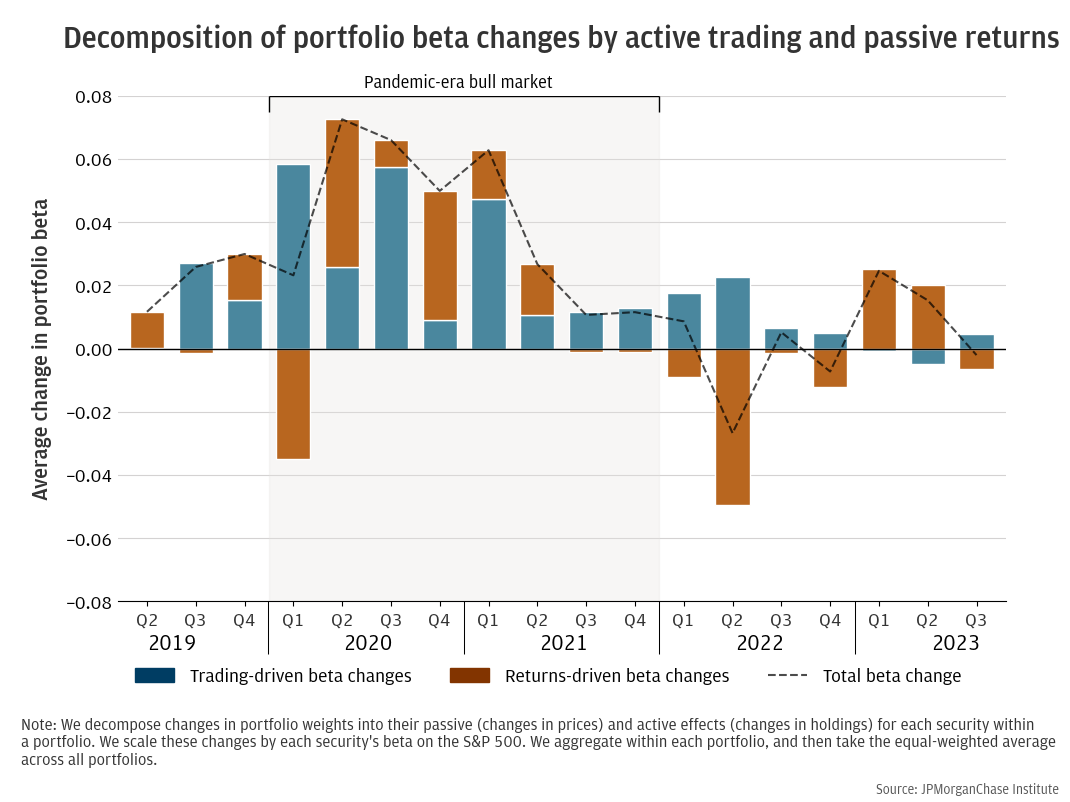
Changes in market risk are driven by two mechanisms. First, active trading decisions by investors to buy or sell securities can alter a portfolio’s beta. Portfolio beta increases when investors make net purchases of riskier securities than those previously held. Second, portfolio beta can change passively when investors hold quantities of shares constant, but changes in market prices alter the relative value of securities in the portfolio. Passive increases in beta result from relative price increases of high-beta securities already held by investors, which occur automatically during market upturns in the absence of active rebalancing. To identify the contributions of these two mechanisms to changes in overall market risk, we decompose changes in average portfolio beta following the approach of Calvert et al. (2009).
Figure 2 presents the results of our decomposition on a quarterly basis over our sample period. The analysis suggests that both active and passive factors contributed meaningfully to the rise in average portfolio beta from the first quarter of 2020 through the first quarter of 2021. Market declines in 2022, particularly in the second quarter, drove a passive decline in portfolio beta, partially offset by sustained trading activity to increase risk.14 From March 2020 to the December 2021 peak, active changes accounted for approximately two-thirds of the total average increase in market risk, while passive changes contributed the remaining one-third.15 The large contribution of active trading to increases in beta suggests investors had a strong appetite for market risk during this period, which they retained past the pandemic period.
Figure 2: Both trading and market returns drove significant increases in exposure to market risk during the pandemic.
Investors who opened accounts in 2020 and 2021 held more investment risk in their portfolios compared to those who opened accounts in adjacent periods.
A consideration of policymakers during a February 2021 Congressional hearing16 was that online self-directed brokerage accounts—amid the pandemic context of heightened media attention on investing, income growth, excess savings, and a bull market—might attract new investors prone to increased risk-taking. While this event was unprecedented, existing literature suggests that trading behavior in self-directed brokerage accounts was more sensitive to biases like heightened attention to the market during this period (Barber et al. 2023). Moreover, market returns early in an investor’s experience can have lasting effects on their risk perception (Malmendier and Nagel, 2011). The historic influx of new investors during the pandemic may be riskier than those who opened accounts before or after, potentially affecting their wealth in the short- and long-term.
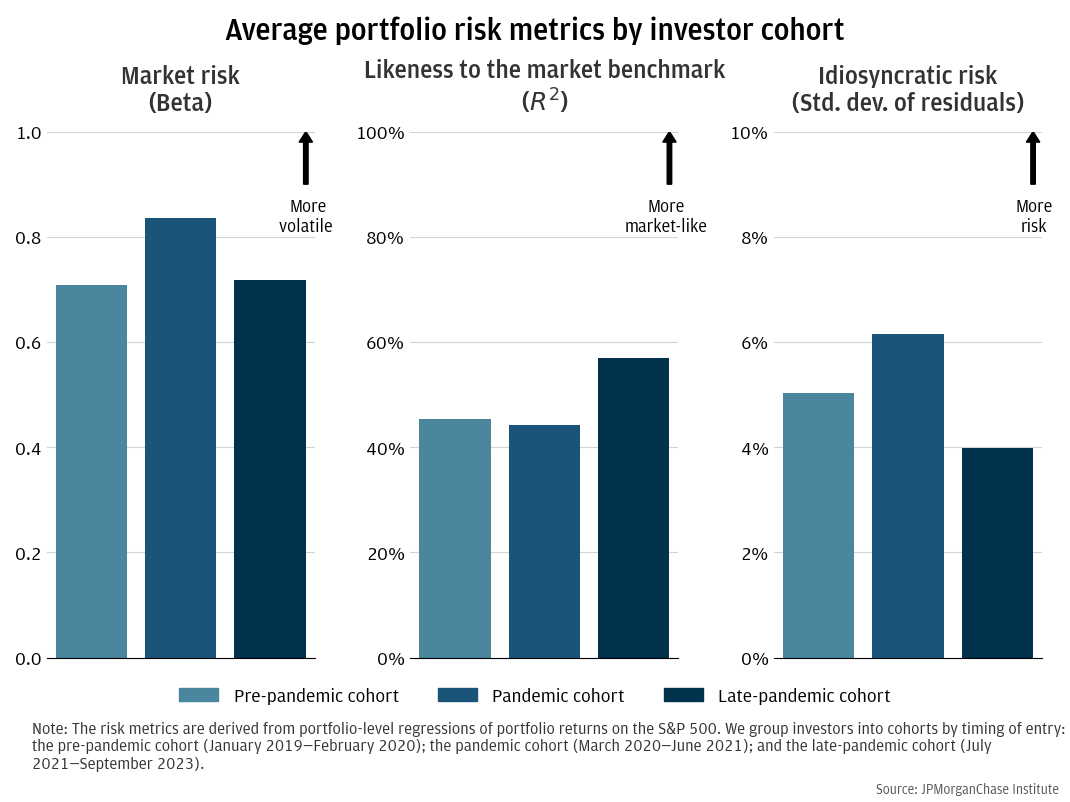
To explore this possibility, we segment our investor sample into three cohorts based on account opening dates: 1) a pre-pandemic cohort (January 2019 to February 2020); 2) a pandemic cohort (March 2020 to June 2021); and 3) a late-pandemic cohort (July 2021 to September 2023). We require these cohorts to have at least three months of investing behavior before analyzing their portfolio characteristics to avoid the volatility that occurs when investors initially fund their accounts.
Figure 3 compares market risk, likeness to the market benchmark, and idiosyncratic risk for each of the three investor cohorts. Consistent with strong market performance following the initial pandemic volatility in March 2020, we find significantly higher investment risk metrics in the pandemic cohort’s portfolios. Specifically, portfolios of the pandemic cohort had 12.6 to 11.7 percent higher beta than the cohorts that preceded and followed, respectively.
Figure 3: Investors who began investing during the pandemic-era tended to hold more risk than investors in adjacent periods.
As an illustrative example to demonstrate the significance of these differences in dollar terms, consider a hypothetical portfolio with the pandemic cohort’s beta and an initial investment of 60,000 dollars (near our sample average). From March 2020 to December 2021, following the total S&P 500 return of 84 percent, this portfolio would have gained an additional 6,400 dollars compared to a portfolio with the pre-pandemic beta. Conversely, during the 15 percent S&P 500 correction in 2022, this portfolio would have lost 1,100 dollars more than a portfolio with the pre-pandemic beta. Portfolios with higher beta gain more during market upswings but incur greater losses when markets correct.
The two remaining risk metrics shown in Figure 3 indicate that the pandemic cohort’s portfolios tracked the overall market less closely and held more idiosyncratic risk than the other cohorts, suggesting potential concentrated holdings of more volatile single stocks and less diversified portfolios. Specifically, R-squared—measuring likeness to the market benchmark—was 44 percent for the pandemic cohort, compared to 45 percent for the earlier cohort and 57 percent for the later cohort. Idiosyncratic risk—measured as the monthly standard deviation of portfolio returns—was higher at 6.1 percent for the pandemic cohort, relative to 5.0 and 4.0 percent for the earlier and later cohorts, respectively.
Demographic differences in investor cohorts offer important context for interpreting these results. The pandemic cohort of investors were 2.5 times more likely to be men and 1.1 times more likely to be Generation Z and Millennials.17 As shown in Finding 3, investors with these demographic characteristics have riskier portfolios generally, but demographic differences do not fully explain the gaps in risk by cohort, a result described statistically in Appendix 3. In addition, interpretation of these results should be considered in the context of the limitations of our data, which are discussed in Appendix 4: Research Limitations.
These estimates suggest that policymakers’ considerations about the heightened risk-taking behavior of new investors during the pandemic may have an empirical basis. This cohort may have been influenced by unique market conditions and heightened attention to stock trading during the pandemic period, which may have led to investment strategies with higher risk.
Women’s portfolios held less investment risk than men’s, and younger investors’ portfolios held more market risk than older investors.
Previous research on investment holdings in brokerage accounts shows that portfolio risk can vary by investor gender and age.18 These demographic differences can have implications for the long-term impacts of risk on wealth accumulation and the importance of tailored financial education. Here, we investigate our risk metrics—market risk, likeness to the market benchmark, and idiosyncratic risk—for portfolios by each demographic subpopulation.
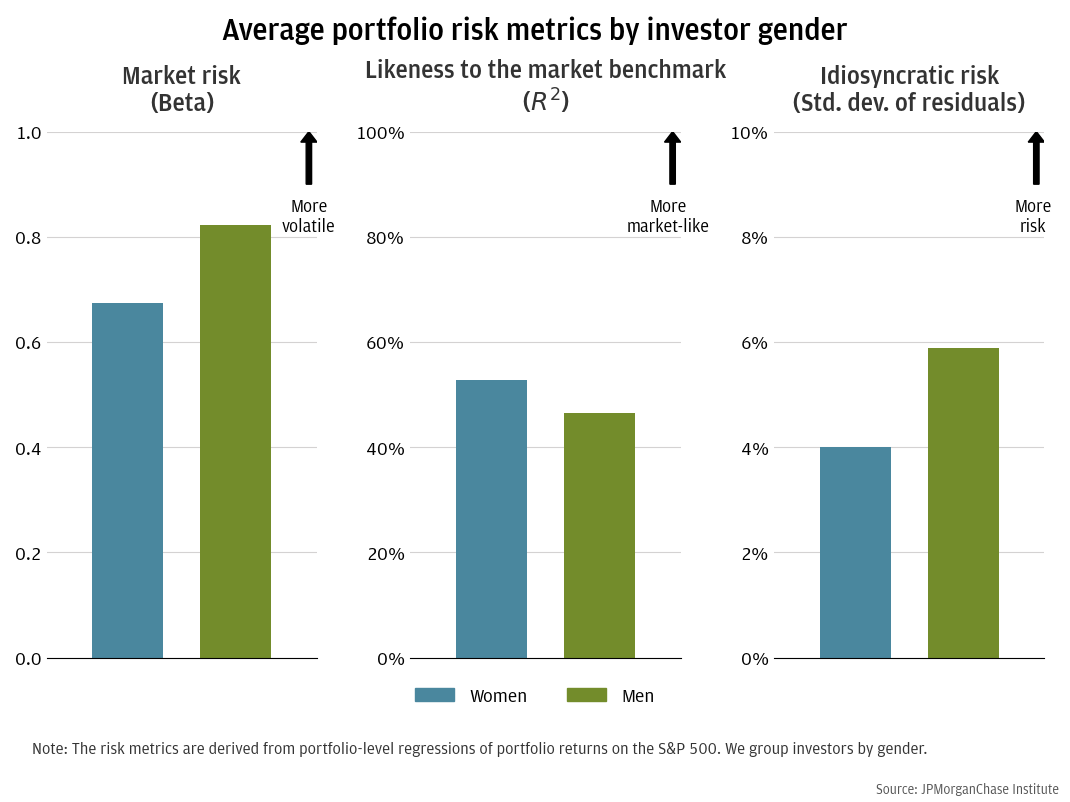
Figure 4 illustrates the differences in portfolio risk by investor gender. Consistent with prior research, women’s portfolios were lower beta, more aligned with the market benchmark, and lower in idiosyncratic risk, suggesting more investment in index funds and less volatile investments. In contrast, men’s portfolios were held higher market risk, less aligned with the market benchmark, and higher in idiosyncratic risk, suggesting a more concentration in single-stock equities and less diversification.19
Figure 4: Gender explained differences between the risk profiles of investors, as men’s portfolios tended to be riskier than women’s portfolios.
These results align with prior research that suggests women may be more risk-averse investors than men (Jianakoplos and Bernasek, 1998; Barber and Odean, 2001). Economic factors contributing to this difference include women’s greater vulnerability to poverty, lower lifetime earnings, less wealth, and longer lifespans, which necessitate higher savings (Bernasek and Shwiff, 2001). As women are likely to hold an increasing share of wealth due to generational wealth transfers in the coming years,20 tailoring investing education for goals that might differ by gender is increasingly important.
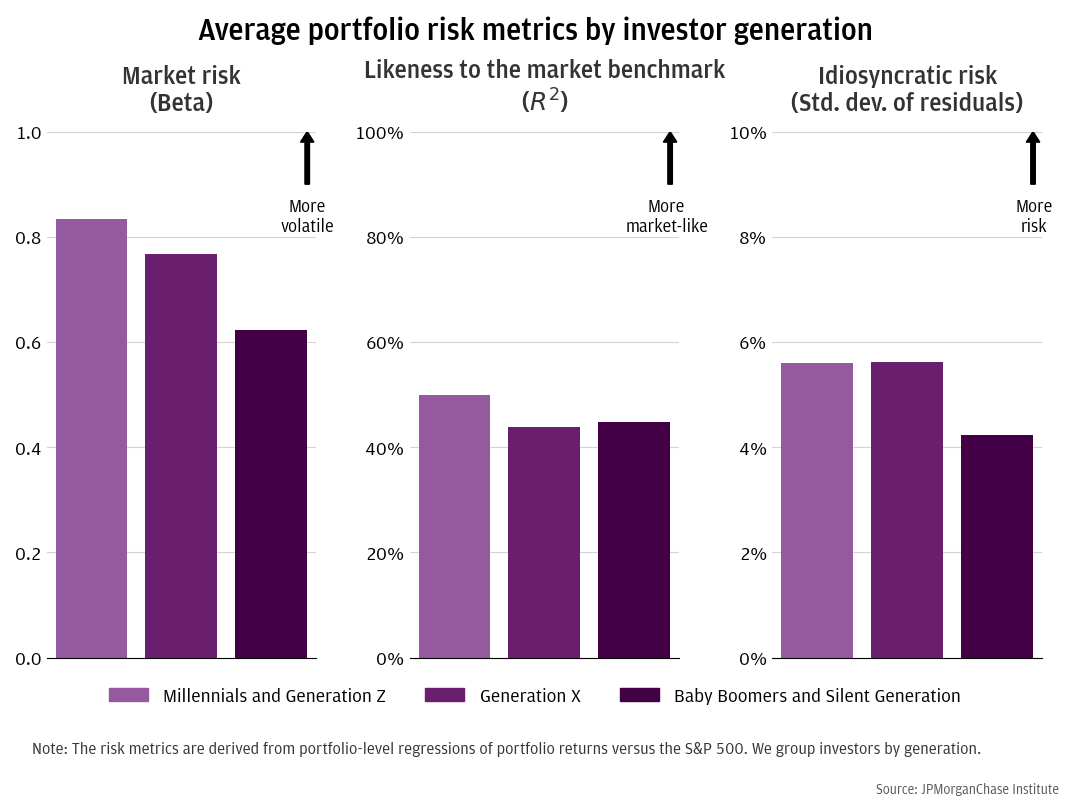
We also find differences by age group generally consistent with traditional investing patterns over the lifecycle: individuals tend to reduce market risk as they approach retirement (Ameriks and Zeldes, 2004). Figure 5 shows portfolio risk metrics by age as captured by investor generation.21 Consistent with earlier evidence on the typical lifecycle profile of investment risk,22 market risk was higher in the portfolios of younger individuals. Our results for likeness to the market benchmark and idiosyncratic risk were less directional with age. Younger investors’ portfolios exhibited more likeness to the market benchmark and higher idiosyncratic risk compared to older investors. This may be because older investors’ portfolios included other types of risk, such as interest rate risk from holdings of fixed income securities, making them less correlated with the S&P 500 but still relatively low in volatility.23
Figure 5: Stock market risk in portfolios tended to decline with investor age.
Appendix 3 shows that age and gender differences in risk persist when controlling for cohort effects and portfolio characteristics.
Conclusion
We examine retail investor risk during a period of significant economic changes from 2019 to 2023, using a dataset from Chase Wealth Management covering the portfolios of 500,000 investors in self-directed brokerage accounts. Our analysis reveals that market risk in retail investors’ portfolios increased by an average of 15 percent from 2019 to 2021, driven by active trading and the appreciation of riskier securities. The rise in market risk only partially receded to 10 percent by the end of 2023, indicating a lasting impact of pandemic-era volatility on household portfolios. We find that investors who opened accounts during the pandemic between 2020 to 2021 assumed more investment risk compared to those in adjacent periods. The results suggest investors may have been influenced by the unique market conditions and heightened attention to stock trading during the pandemic. Additionally, our analysis shows notable differences in portfolio risk by age and gender. Portfolios of men and younger investors were more sensitive to market returns, exhibiting higher levels of risk compared to those of women and older investors.
Implications
This report introduces a new source of data on retail investors’ portfolio holdings in self-directed brokerage accounts, aiding policymakers in understanding the expanding connections between financial markets and individuals’ financial health. Implications of this research apply to the following domains:
The increased exposure to market risk in retail investors’ portfolios during the pandemic, along with differences in portfolio risk by cohort, gender, and age, indicates the need for policymaker awareness, financial literacy, and ongoing research.
Appendix 1: Data and Summary Statistics
Our research uses a new de-identified dataset from Chase Wealth Management containing the portfolios of 500,000 retail investors in self-directed brokerage accounts from 2019 through 2023.25 The dataset includes month-end snapshots of holdings in stocks, mutual funds, ETFs, fixed income, and cash.26 We observe the quantities of positions held and closing market prices, and we approximate flows in and out of securities by changes in these quantities and prices. The data encompasses both standard investment accounts and tax-advantaged Individual Retirement Accounts (IRAs). For investors with both types of accounts, holdings are aggregated at the individual level. The dataset is also enriched with investor age and gender, supporting analysis of heterogeneity across demographics. For a discussion of data limitations, see Appendix 4: Research Limitations.
We apply the following filters to curate the data used in this report. After aggregating positions across all self-directed accounts at a customer-month level, we require investors to have an average total portfolio wealth of at least 1,000 dollars and a minimum of 12 months of investment history. We also censor extreme outliers in the averages we report.
Table 1 presents summary statistics of investment portfolios and demographic characteristics. On average, investors in our sample have 60,000 dollars in investment balances, hold 7 positions, and trade once or twice a month in their self-directed brokerage accounts. The sample is predominantly male, with Millennials as the largest generation. The pandemic cohort—those who opened brokerage accounts in 2020 and 2021—constitutes half of the sample, while the other two cohorts split the remaining half.
Portfolio statistics |
Average |
Portfolio wealth |
60,000 |
Positions |
7 |
Monthly Trades |
1.5 |
Demographic statistics |
Percent of sample |
Male |
70 |
Generation Z |
5 |
Millennial |
40 |
Generation X |
30 |
Baby Boomers |
17 |
Silent Generation |
1 |
Pre-pandemic cohort |
25 |
Pandemic cohort |
50 |
Late-pandemic cohort |
25 |
N |
500,000 |
Appendix 2: Modeling Risk with our Data
Investment portfolios hold securities with varying risk levels. Using standard statistical methods, we run OLS regressions to calculate risk factors for both portfolios and individual securities. Specifically, we regress monthly returns of each security or portfolio on the S&P 500. Each regression assumes time-invariant risk characteristics either at the portfolio or security level. The regression for securities informs Finding 1, while the regression for portfolios informs Findings 2 and 3. Both analyses require a minimum of 12 months of historical data.
One factor security regression, where s is each security, and t is each month:
Rs,t = αs,t + βsRmt + εs,t
One factor portfolio regression, where i is each investor:
n∑s=1 PWi,s,tRi,s,t = αi,t + βiRmt + εi,t
For these regressions, we focus on three estimates:
Table 2 presents statistics from individual portfolio-level regressions. The average portfolio had a beta below one (note, Figure 1 shows higher betas, as it only includes the portion invested in single-stock equities, ETFs, and mutual funds). We also find an R2 indicating that half of the portfolio risk is explained by the S&P 500, and an idiosyncratic risk measure of 6 percent calculated from the average monthly return standard deviation of residuals.
Regression statistics |
Market risk (Beta) |
Likeness to market benchmark (R2) |
Idiosyncratic risk (Std. dev. of residuals) |
Average |
.77 |
.48 |
.05 |
Appendix 3: Further insights into heterogeneity within portfolios
To ensure the robustness of metrics on differences in portfolio risk, we use OLS regressions to explain the variation in portfolio market risk (beta); likeness to the market benchmark (R2); and idiosyncratic risk (the standard deviation of the residuals), alongside a set of controls. The specification is as follows:
Risk Metric = α + D0 * Cohort + B0Age + D1Men + B1Log Average Portfolio Wealth + B2Log Total Trades + B3 Log Average Positions + B4 Average Portfolio Weight in Equity
Our primary coefficients of interest are the binary variables for cohort, age, and gender. For controls, we include portfolio-level statistics: average portfolio wealth, total trades, average positions, and the percentage of the portfolio allocated towards risky securities. We use two specifications: the second includes portfolio weight in equities. This variable helps approximate differences driven by security selection within equities, but we also present results without it, as it is endogenous and closely related to risk metrics.
Table 3 reports the portfolio-level regression results. Differences between subpopulations by age, gender, and cohort remain robust with the inclusion of the observed controls. Consistent with Finding 2, the pandemic cohort’s portfolios had higher market risk and less diversification—as interpreted by higher betas, lower R2, and higher idiosyncratic risk—compared to neighboring cohorts. Consistent with the plots in Finding 3, men’s portfolios had higher market risk and less diversification, as interpreted by higher beta, lower R2, and higher idiosyncratic risk. The age results in this analysis confirms that the portfolios of younger investors had higher market risk and higher R2. However, the result for idiosyncratic differs from Finding 3. The coefficient on age suggests older investors had higher idiosyncratic risk. This may be due to allocations in fixed income or low-beta stocks with more idiosyncratic risk, consistent with Korniotis and Kumar (2011).
Regression output |
Beta |
Beta |
R2 |
R2 |
Idiosyncratic |
Idiosyncratic |
Intercept |
0.9998*** |
0.1139*** |
0.2363*** |
0.0442*** |
0.1157*** |
0.0647*** |
|
(0.0067) |
(0.0069) |
(0.0037) |
(0.0042) |
(0.0008) |
(0.0009) |
Pandemic cohort |
0.0519*** |
0.0521*** |
-0.0301*** |
-0.0301*** |
0.0089*** |
0.0089*** |
|
(0.0024) |
(0.0021) |
(0.0013) |
(0.0013) |
(0.0003) |
(0.0003) |
Late pandemic cohort |
0.0191*** |
0.0451*** |
0.0921*** |
0.0977*** |
-0.0096*** |
-0.0081*** |
|
(0.0030) |
(0.0027) |
(0.0017) |
(0.0016) |
(0.0004) |
(0.0004) |
Men |
0.0488*** |
0.0215*** |
-0.0646*** |
-0.0705*** |
0.0140*** |
0.0124*** |
|
(0.0022) |
(0.0020) |
(0.0012) |
(0.0012) |
(0.0003) |
(0.0003) |
Age |
-0.0008*** |
-0.0003*** |
-0.0030*** |
-0.0029*** |
0.0002*** |
0.0003*** |
|
(0.0001) |
(0.0001) |
(0.0000) |
(0.0000) |
(0.0000) |
(0.0000) |
Log avg. portfolio wealth |
-0.0254*** |
-0.0131*** |
0.0403*** |
0.0430*** |
-0.0084*** |
-0.0077*** |
|
(0.0007) |
(0.0006) |
(0.0004) |
(0.0004) |
(0.0001) |
(0.0001) |
Log total trades |
-0.0728*** |
-0.0427*** |
-0.0537*** |
-0.0471*** |
0.0047*** |
0.0065*** |
|
(0.0012) |
(0.0010) |
(0.0006) |
(0.0006) |
(0.0001) |
(0.0001) |
Log avg. positions |
0.2274*** |
0.1531*** |
0.1254*** |
0.1093*** |
-0.0058*** |
-0.0100*** |
|
(0.0016) |
(0.0014) |
(0.0009) |
(0.0009) |
(0.0002) |
(0.0002) |
Avg. portfolio weight in equity |
0.9824*** |
0.2129*** |
0.0566*** |
|||
|
(0.0039) |
(0.0024) |
(0.0005) |
|||
R-squared |
0.0964 |
0.2811 |
0.1879 |
0.2136 |
0.0741 |
0.1156 |
R-squared adj |
0.0964 |
0.2811 |
0.1879 |
0.2136 |
0.0741 |
0.1155 |
N |
245826 |
245826 |
245826 |
245826 |
245826 |
245826 |
Standard errors are in parathesis. *** p < 0.01; ** p < 0.05; * p < 0.1 |
||||||
Appendix 4: Research Limitations
Our analytical approach has several limitations that warrant consideration. While we measure increased risk-taking in investment accounts, our analysis does not show the impact of this heightened risk directly on individuals’ broader financial health. Future research will investigate the impact of changes in investor investment wealth on consumption. Another limitation is that our analysis does not evaluate whether investors are fulfilling their financial goals with a chosen level of risk, partly due to a lack of information on investors’ objectives for their finances.
We are also constrained by our data coverage. The available time frame from 2019 to 2023 makes it difficult to contextualize changes in retail investor risk-taking over a longer historical period. This time frame also overlapped with changes to the Chase self-directed investing platform that might have increased the number of available securities or other features. Additionally, unlike other online-only platforms, the population using self-directed accounts in our sample may consist of more traditional banking customers with higher incomes than the general population. Our data may provide a conservative look at cohort effects, as there was reportedly more elevated risk-taking on other platforms not included in this analysis.28 Furthermore, we do not observe investments held at other companies, meaning our analysis does not comprehensively cover all investors’ financial assets. We also do not include in our analysis any assets that individuals may hold in Chase advisory accounts; this affects only a small fraction of our sample.
Aiello, Darren, Scott R. Baker, Tetyana Balyuk, Marco Di Maggio, Mark J. Johnson, and Jason D. Kotter. 2023. “The Effects of Cryptocurrency Wealth on Household Consumption and Investment.” NBER working paper. https://doi.org/10.3386/w31445
Aiello, Darren, Scott R. Baker, Tetyana Balyuk, Marco Di Maggio, Mark J. Johnson, and Jason D. Kotter. 2023. “Who Invests in Crypto? Wealth, Financial Constraints, and Risk Attitudes.” NBER working paper.
Ameriks, John and Stephen P. Zeldes. 2004. "How Do Household Portfolio Shares Vary with Age?" Working Paper. https://business.columbia.edu/sites/default/files-efs/imce-uploads/szeldes/pdfs/Ameriks_Zeldes_age_Sept_2004d.pdf
Barber, Brad M. and Terrance Odean. 2000. “Trading is Hazardous to Your Wealth: The Common Stock Investment Performance of Individual Investors.” The Journal of Finance 55 (2): 773-806. https://doi.org/10.1111/0022-1082.00226
Barber, Brad M., and Terrance Odean. 2001. "Boys Will Be Boys: Gender, Overconfidence, and Common Stock Investment." The Quarterly Journal of Economics 116 (1): 261–292. https://doi.org/10.1162/003355301556400
Barber, Brad M., and Terrance Odean. 2013. “The Behavior of Individual Investors,” in Handbook of the Economics of Finance. G.M. Constantinides and M. Harris & R.M. Stulz. http://dx.doi.org/10.1016/B978-0-44-459406-8.00022-6
Barber, Brad M., Xing Huang, Terrance Odean, and Chris Schwarz. 2021. “Attention-Induced Trading and Returns: Evidence from Robinhood Users.” Working Paper. http://dx.doi.org/10.2139/ssrn.3715077
Bernasek, Alexandra and Stephanie Shwiff. 2001. “Gender, Risk, and Retirement.” Journal of Economic Issues XXXV (2): 345-356. https://doi.org/10.1080/00213624.2001.11506368
Calvet, Laurent E., John Y. Campbell, and Paolo Sodini. 2009. "Fight or Flight? Portfolio Rebalancing by Individual Investors." Quarterly Journal of Economics 124 (1). https://doi.org/10.3386/w14177
Jianakoplos, Nancy Ammon and Alexandra Bernasek. 1998. "Are Women More Risk Averse?" Economic Inquiry 36 (4): 620-630. https://doi.org/10.1111/j.1465-7295.1998.tb01740.x
Kogan, Shimon, Igor Makarov, Marina Niessner, and Antoinette Schoar. 2023. “Are Cryptos Different? Evidence from Retail Trading.” NBER Working Paper. https://doi.org/10.3386/w31317
Korniotis, George M. and Alok Kumar. 2011. “Do Older Investors Make Better Investment Decisions?” The Review of Economics and Statistics 93 (1): 244–265. https://doi.org/10.1162/REST_a_00053
Malmendier, Ulrike and Stefan Nagel. 2011. "Depression Babies: Do Macroeconomic Experiences Affect Risk-Taking?" The Quarterly Journal of Economics 126 (1): 373–416. https://doi.org/10.1093/qje/qjq004
Wheat, Chris and George Eckerd. 2024a. “The Rise in Retail Investing: Roles of the Economic Cycle and Income Growth.” JPMorganChase Institute. https://www.jpmorganchase.com/institute/research/financial-markets/the-rise-in-retail-investing-roles-of-the-economic-cycle-and-income-growth
Wheat, Chris and George Eckerd. 2024b. “The changing demographics of retail investors.” JPMorganChase Institute. https://www.jpmorganchase.com/institute/research/financial-markets/the-changing-demographics-of-retail-investors
We thank Liz Ellis, Annabel Jouard, Oscar Cruz, and Alfonso Zenteno for their support and acknowledge the efforts of Sarah Kuehl, Preeti Vaidya, and Bryan Kim to make the data that made this report possible available to the Institute research team. We are indebted to our internal partners and colleagues who support delivery of our agenda in a myriad of ways and acknowledge their contributions to each and all releases.
We would like to acknowledge Jamie Dimon, CEO of JPMorganChase, for his vision and leadership in establishing the Institute and enabling the ongoing research agenda. We remain deeply grateful to Peter Scher, Vice Chairman, Tim Berry, Head of Corporate Responsibility, Heather Higginbottom, Head of Research & Policy, and others across the firm for the resources and support to pioneer a new approach contributing to global economic analysis and insight.
This material is a product of JPMorganChase Institute and is provided to you solely for general information purposes. Unless otherwise specifically stated, any views or opinions expressed herein are solely those of the authors listed and may differ from the views and opinions expressed by J.P. Morgan Securities LLC (JPMS) Research Department or other departments or divisions of JPMorgan Chase & Co. or its affiliates. This material is not a product of the Research Department of JPMS. Information has been obtained from sources believed to be reliable, but JPMorgan Chase & Co. or its affiliates and/or subsidiaries (collectively J.P. Morgan) do not warrant its completeness or accuracy. Opinions and estimates constitute our judgment as of the date of this material and are subject to change without notice. No representation or warranty should be made with regard to any computations, graphs, tables, diagrams or commentary in this material, which is provided for illustration/reference purposes only. The data relied on for this report are based on past transactions and may not be indicative of future results. J.P. Morgan assumes no duty to update any information in this material in the event that such information changes. The opinion herein should not be construed as an individual recommendation for any particular client and is not intended as advice or recommendations of particular securities, financial instruments, or strategies for a particular client. This material does not constitute a solicitation or offer in any jurisdiction where such a solicitation is unlawful.
Wheat, Chris, Melissa O’Brien, George Eckerd. 2024. “Retail risk: Investors’ portfolios during the pandemic.” JPMorganChase Institute. https://www.jpmorganchase.com/institute/all-topics/financial-health-wealth-creation/retail-risk-investors-portfolios-during-the-pandemic
Authors

Chris Wheat
President, JPMorganChase Institute

Melissa O’Brien
Research Vice President for Wealth and Markets, JPMorganChase Institute

George Eckerd
Research Director for Wealth and Markets, JPMorganChase Institute
Footnotes
See Survey of Consumer Finances. In 2022, 58 percent of U.S. families held stock, up from 53 percent in 2019. This measure includes both directly and indirectly held stock (such as in pooled investment funds like ETFs and mutual funds).
Research using administrative Chase data found that investing participation steadily increased over the later years of the pre-pandemic expansion period, with participation spiking during the pandemic (Wheat and Eckerd 2024a).
In addition, research using Robinhood user data found that unique participants on the platform quadrupled from early 2019 to 2020, and that measurements of retail flow in the Nasdaq were approximately 2.5 times greater over the same period (Barber et al. 2021).
Self-directed brokerage accounts grew in popularity during the pandemic due to their low-or-no required minimum assets and commission-free trades. Other factors driving this trend included growth in household income, heightened levels of savings, and increased media attention on investing. See “Investing 2020: New Accounts and the People Who Opened Them” from FINRA Investor Education Foundation, as well as Wheat and Eckerd (2024a).
Advisory services for wealth management typically have minimum asset requirements for eligibility.
A Congressional hearing in February 2021 considered the potential vulnerability of individual investors in an environment of social-media-driven investing and the “gamification” of trading on other investing platforms. See the section “Gamification and Social Media” of the House of Representatives Financial Services Committee hearing memo for the February 18, 2021, Full Committee Hearing entitled, “Game Stopped? Who Wins and Loses When Short Sellers, Social Media, and Retail Investors Collide?”
While public data such as the Survey of Consumer Finances provide national estimates of investor wealth, data containing the retail investors’ portfolios are maintained by private companies and rarely accessible for research.
Economists Brad Barber and Terrence Odean used brokerage data from 1991 to 1996 to publish foundational research on retail investor portfolios. See Barber and Odean (2000) and Barber and Odean (2001) regarding investor risk and demographics. See Barber and Odean (2013) on behavioral biases.
While existing research covers self-directed investing since the start of the pandemic period, it does not inform risk taking or demographic differences in investor behavior. For example, Barber et al. (2021) used brokerage data from the pandemic period to revisit some dimensions of investing, revealing that retail investors were influenced by attention-driven trading. Kogen et al. (2023) found that retail investor exhibit contrarian behavior, trading more when overall stock market prices fell. Aiello et al. (2023a, 2023b) used administrative data tracking transfers from checking to brokerage accounts as a proxy for direct observation.
For more details on our dataset, refer to Appendix 1: Data and Summary Statistics.
See Appendix 2 for details of our beta estimation approach.
This approach is agnostic to the relative value of the portfolios, in contrast to a value-weighted average, which would place greater weight on the wealthiest investors.
We also subset our sample to a pre-pandemic investor cohort who opened accounts in 2019 and remove the first three months of their investing history. This isolates the change in average beta from the volatility of new accounts. Later in Finding 2, we compare average risk levels by all cohorts in our sample.
The differences in beta between Figure 1 and Figure 2 at the start of the time series is due to sample composition change in the beginning of the observed period; the sample was growing until the cohort cutoff in February 2020.
To calculate this metric, we apply the approach of Figure 2, but instead of aggregating on the quarterly level, we aggregate across the entire pandemic period. Differences between Figure 2 and this metric may arise due to the unbalanced sample.
Refer to endnote 6 for more details on the congressional hearing regarding retail investors.
Generation Z was born between 1997 and 2012. Millennials were born between 1981 and 1996. https://www.pewresearch.org/short-reads/2019/01/17/where-millennials-end-and-generation-z-begins/
See endnotes 8 and 9 for a discussion of this literature.
Appendix 3 further investigates the dimensions that determine relative investment portfolio risk; while demographic characteristics explain some of the variation in the differences between cohorts in Finding 2, they do not fully account for increased risk taking.
See “Women as the next wave of growth in US wealth management,” McKinsey & Company, July 29, 2020.
See Pew Research on the definitions of generations.
Ameriks and Zeldes (2004).
These results are somewhat consistant with Korniotis and Kumar (2011), who found that older investors held stocks with lower market betas compared to younger investors, and that these differences sharpened as investors age. In contrast to our results in this finding, they also found older investors held stocks with higher idiosyncratic volatility. However, our additional analysis in Appendix 3 is more aligned with their results.
See Finding 2 for a discussion of this trend.
This time window coincides with the introduction of Chase “You Invest” brokerage accounts (now known as Chase self-directed brokerage accounts). These accounts allow investors to purchase securities with no-minimum balance and no-fees for trading, linked to their Chase deposit accounts.
Our data does not contain outright holdings of cryptocurrencies. In addition, we do not include options and other more niche types of securities, as holdings of these types of financial assets are low.
Reported sample size of 245,826 is lower than the full sample of investors due to missing data on demographics tagging and filters on investors who only hold cash.
See, for example, “Robinhood Has Lured Young Traders, Sometimes With Devastating Results,” The New York Times, July 20, 2020, and “Does Robinhood Make It Too Easy to Trade? From Free Stocks to Confetti,” Wall Street Journal, August 2020.