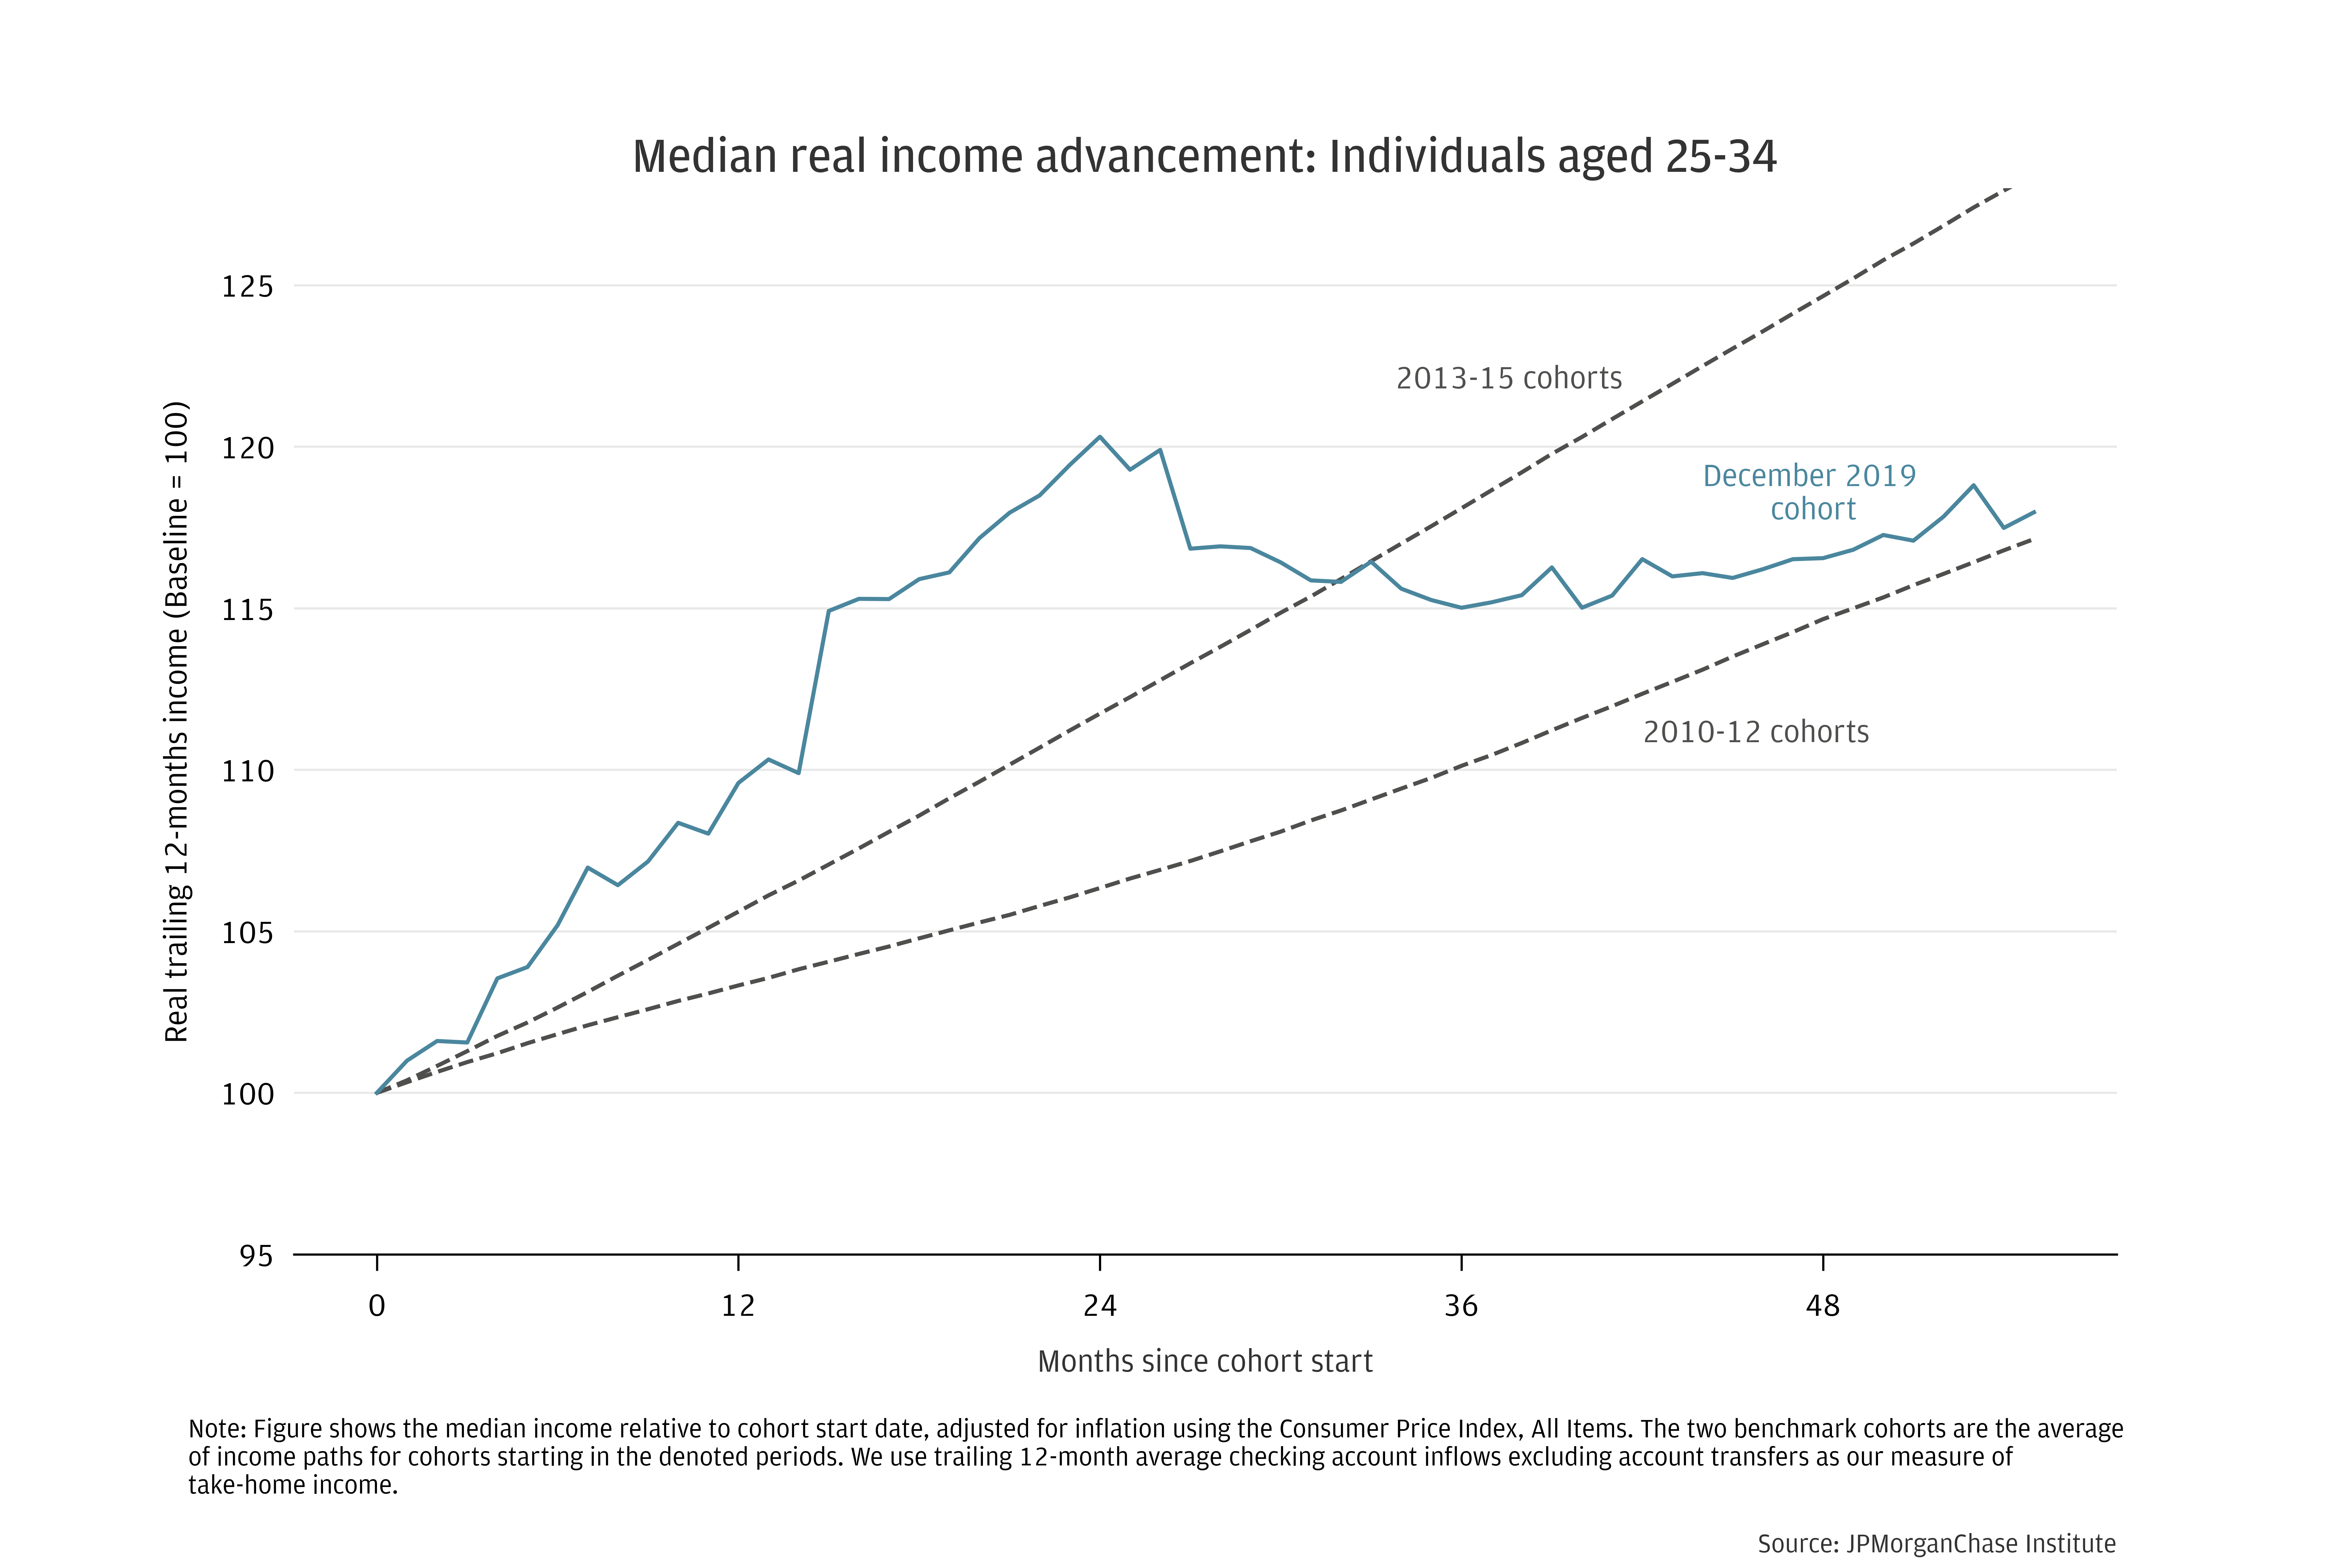
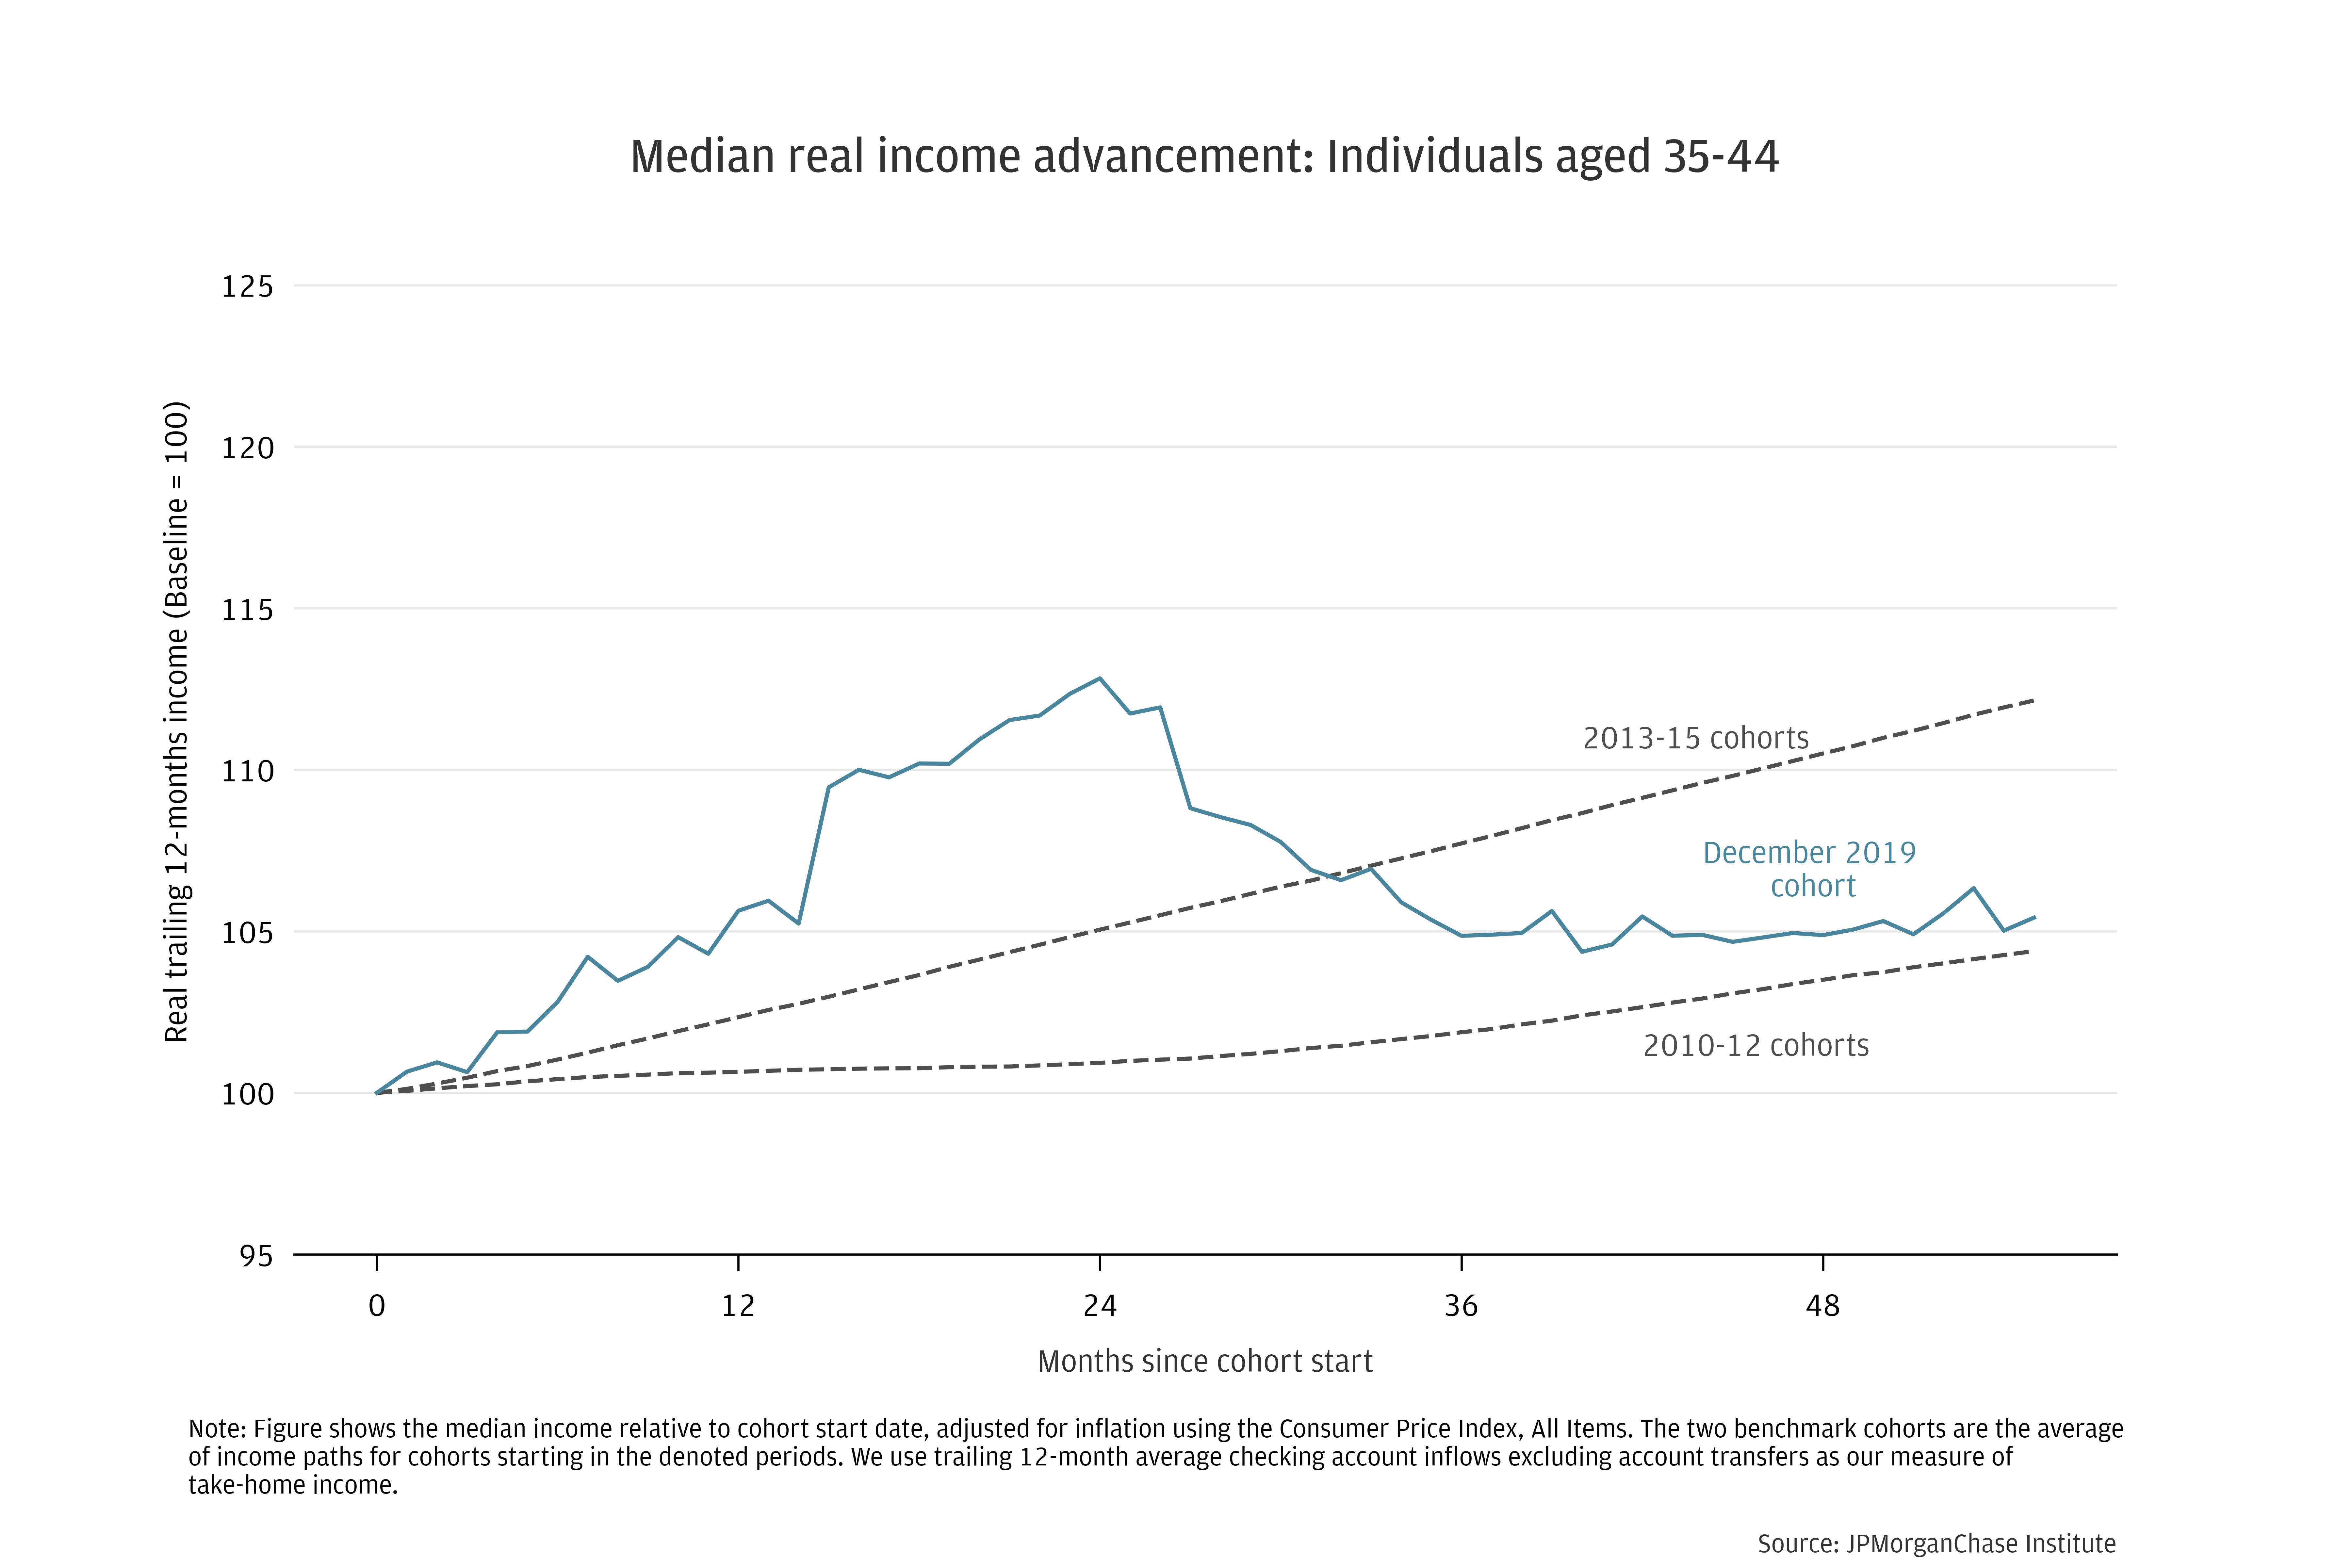
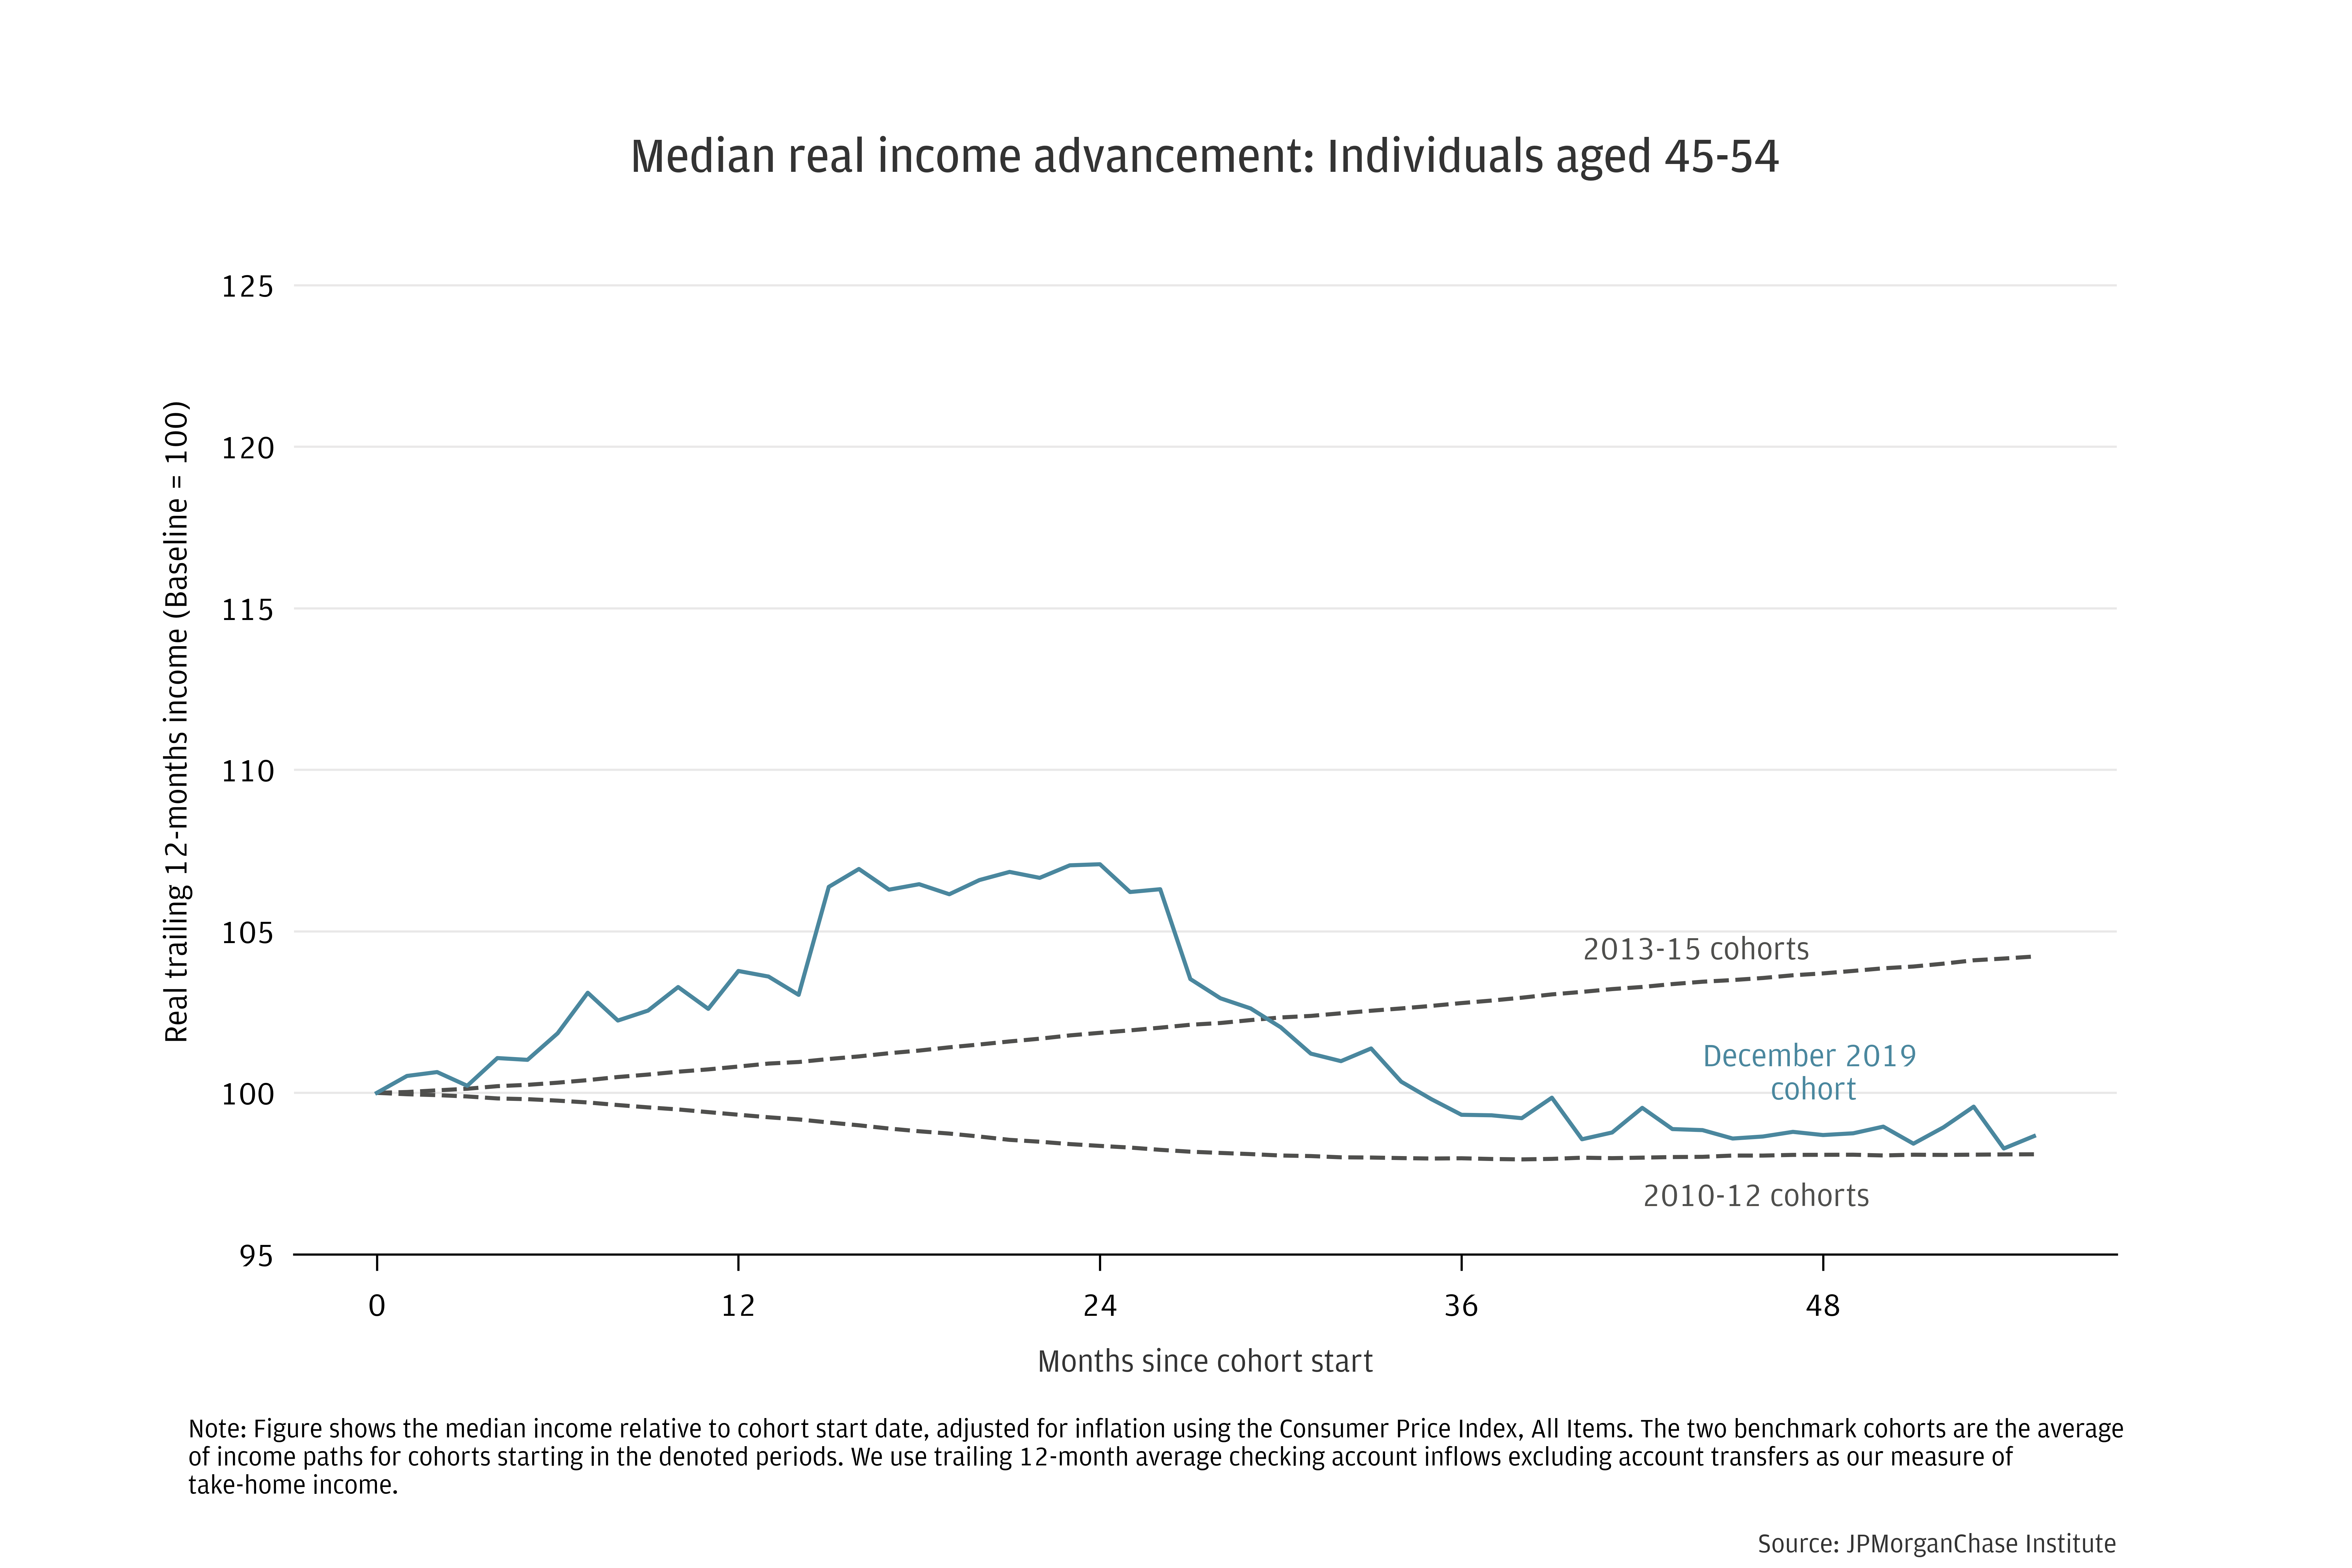
Figure 1: Early- and mid-career progression: Real income gains from the pre-pandemic baseline were lower than same-aged cohorts starting in 2013−2015, and the trend over the past few years has also fallen short of the 2010-2012 cohorts.

Research
September 12, 2024
Several years after the start of pandemic-era economic upheaval, the comparison of individual-level incomes against a 2019 baseline captures a growing arc of people’s career progression. This update adds age-group-specific estimates of household purchasing power, focusing the analysis on differences between workers experiencing the pandemic volatility at varying stages of life. Because individuals tend to have higher income growth early in their working years, we present cohorts of individuals starting in 2019 against the experience of same-aged cohorts prior to the pandemic. This perspective grounds our real income growth metrics against a proxy for reasonable expectations (as represented by recent history) for financial advancement over time.
Age group cohorts covering individuals from 25 through their early 50s as of December 2019 have experienced changes in the purchasing power of incomes through mid-2024 that land towards the low end of the range of benchmarks during the 2010s. Median real income outcomes of age groups closer to typical retirement age, or early retirement, have been poorer than those for the same-aged cohorts even during the weak comparison of the early 2010s. The rise in early retirements during the pandemic (apparent in publicly available data) has likely shifted earlier typical retirement-related income declines, potentially contributing to the pattern.
Along with a companion report tracking income dynamics by income quartiles and race, this research demonstrates how recent economic performance has passed through to take-home pay for typical individuals. Large-scale publicly available data on income in the U.S. do not provide the up-to-date, multi-year, and within-individual perspective shown in this analysis. While the take-home pay metric used here is somewhat narrower than total compensation, which would include gross pay and benefits, it is an important tangible element of people’s financial lives.
We organize the analysis around the following two findings by age group—first considering individuals of early and middle working years and second looking at individuals closer to retirement age.
Real incomes of early and middle working age individuals have largely stagnated over the last two years, leaving net gains since 2019 roughly in line with the slow growth seen in the early 2010s.
We compare median real income growth paths for cohorts of age-grouped individuals beginning in December 2019 against same-age benchmarks from the long economic expansion during the 2010s.1 Unemployment rose to as high as 10 percent during late 2009 and steadily fell to below 4 percent in 2018, remaining near that level until the pandemic. Mirroring the changing state of the labor market, aggregate measures of real wages were essentially flat in the early 2010s before steadily rising during the mid- and late-2010s as the labor market tightened (custom FRED link).2
With data through July 2024, we can track four-and-a-half-year income paths from the pre-pandemic baseline. To benchmark recent trends against the 2010s, we form two benchmarks. The first comprises cohorts starting in the early years after the Great Recession: monthly panels starting January 2010 to December 2012 (ending July 2014 to June 2017). We average over these 36 cohorts to form a more stable, less idiosyncratic benchmark. We construct the second from monthly cohorts starting January 2013 to August 2015 (ending July 2017 to February 2020), which largely spans moderate and tight labor market conditions; the unemployment rate fell below the Congressional Budget Office’s estimate of full employment in early 2017 and remained below that level until March 2020 (custom FRED link).
The three panels in Figure 1 show the evolution of median real incomes for individuals ages 25−34, 35−44, and 45−54, respectively, as of December 2019−May 2024, compared to the two benchmark periods. Pandemic-specific dynamics stand out: relatively rapid gains (inclusive of Unemployment Insurance and Economic Impact Payments) lead to a peak around month 24 since cohort start (December 2021). At this stage, the latter two pandemic stimulus payments remained in the trailing twelve-month window, but inflation had not yet peaked. Price-adjusted incomes subsequently dropped to a level in between the two benchmarks and stabilized as inflation cooled. As of the most recent month in our data, total growth of median income for each age group has been higher than growth in the same-aged post Great Recession cohorts, but notably lower than total growth in the mid-2010s cohort. Moreover, growth in the past two years ranged from tepid for the youngest age group to negative for the older groups, falling short relative to benchmarks from the 2010s.
Figure 1: Early- and mid-career progression: Real income gains from the pre-pandemic baseline were lower than same-aged cohorts starting in 2013−2015, and the trend over the past few years has also fallen short of the 2010-2012 cohorts.

The decline in income paths over the successive panels of Figure 1 is qualitatively in line with the historical tendency for older individuals to experience lower growth. For example, in academic research based on Social Security Administration data on male incomes spanning 1978-2013 (Guvenen et al., 2021), 29-year-olds earn 37 percent more on average than 25-year-olds, while 49-year-olds only earn 5 percent more than 45-year-olds. Labor earnings peaked at age 54, on average, in those data.3
Our analysis uses de-identified data from over 15 million checking account users 2007−2024. We adjust our income proxy—account inflows after excluding transfers—for inflation using the Consumer Price Index, All Items. We compute trailing 12-month average income for each individual at each point in time for which they have at least $1,000 of recent earnings. This sample requirement reduces the likelihood that our analysis contains a large number of individuals using other accounts for the bulk of their activity. For each person in each point in time, t, we compute the trailing twelve-month earnings level in windows ranging from t + 1 to t + 55. For the main cohort in question, the last data point in this analysis is July 2024, allowing for a history of 55 months from the pre-pandemic baseline of December 2019.
A companion report uses similar data and methodology but focuses on a shorter earnings window to better capture higher-frequency changes in the paths of median real incomes. Here, the focus is more about comprehensive changes in standards of living, so we trade off the higher-frequency view for 12-month windows, which better capture irregular components of total take-home pay, such as periodic bonuses.
For individuals later in their careers or in early retirement, median real incomes declined more than same-aged individuals in benchmarks from the 2010s.
As workers get closer to retirement age, income growth tends to slow and turn negative (Guvenen et al. 2021). For the cohort starting in December 2019, we saw lifecycle dynamics directionally consistent with this pattern, but declines in real income have exceeded recent historical norms. The two panels in Figure 2 show outcomes for individuals aged 55−64 and 65-70 as of December 2019.
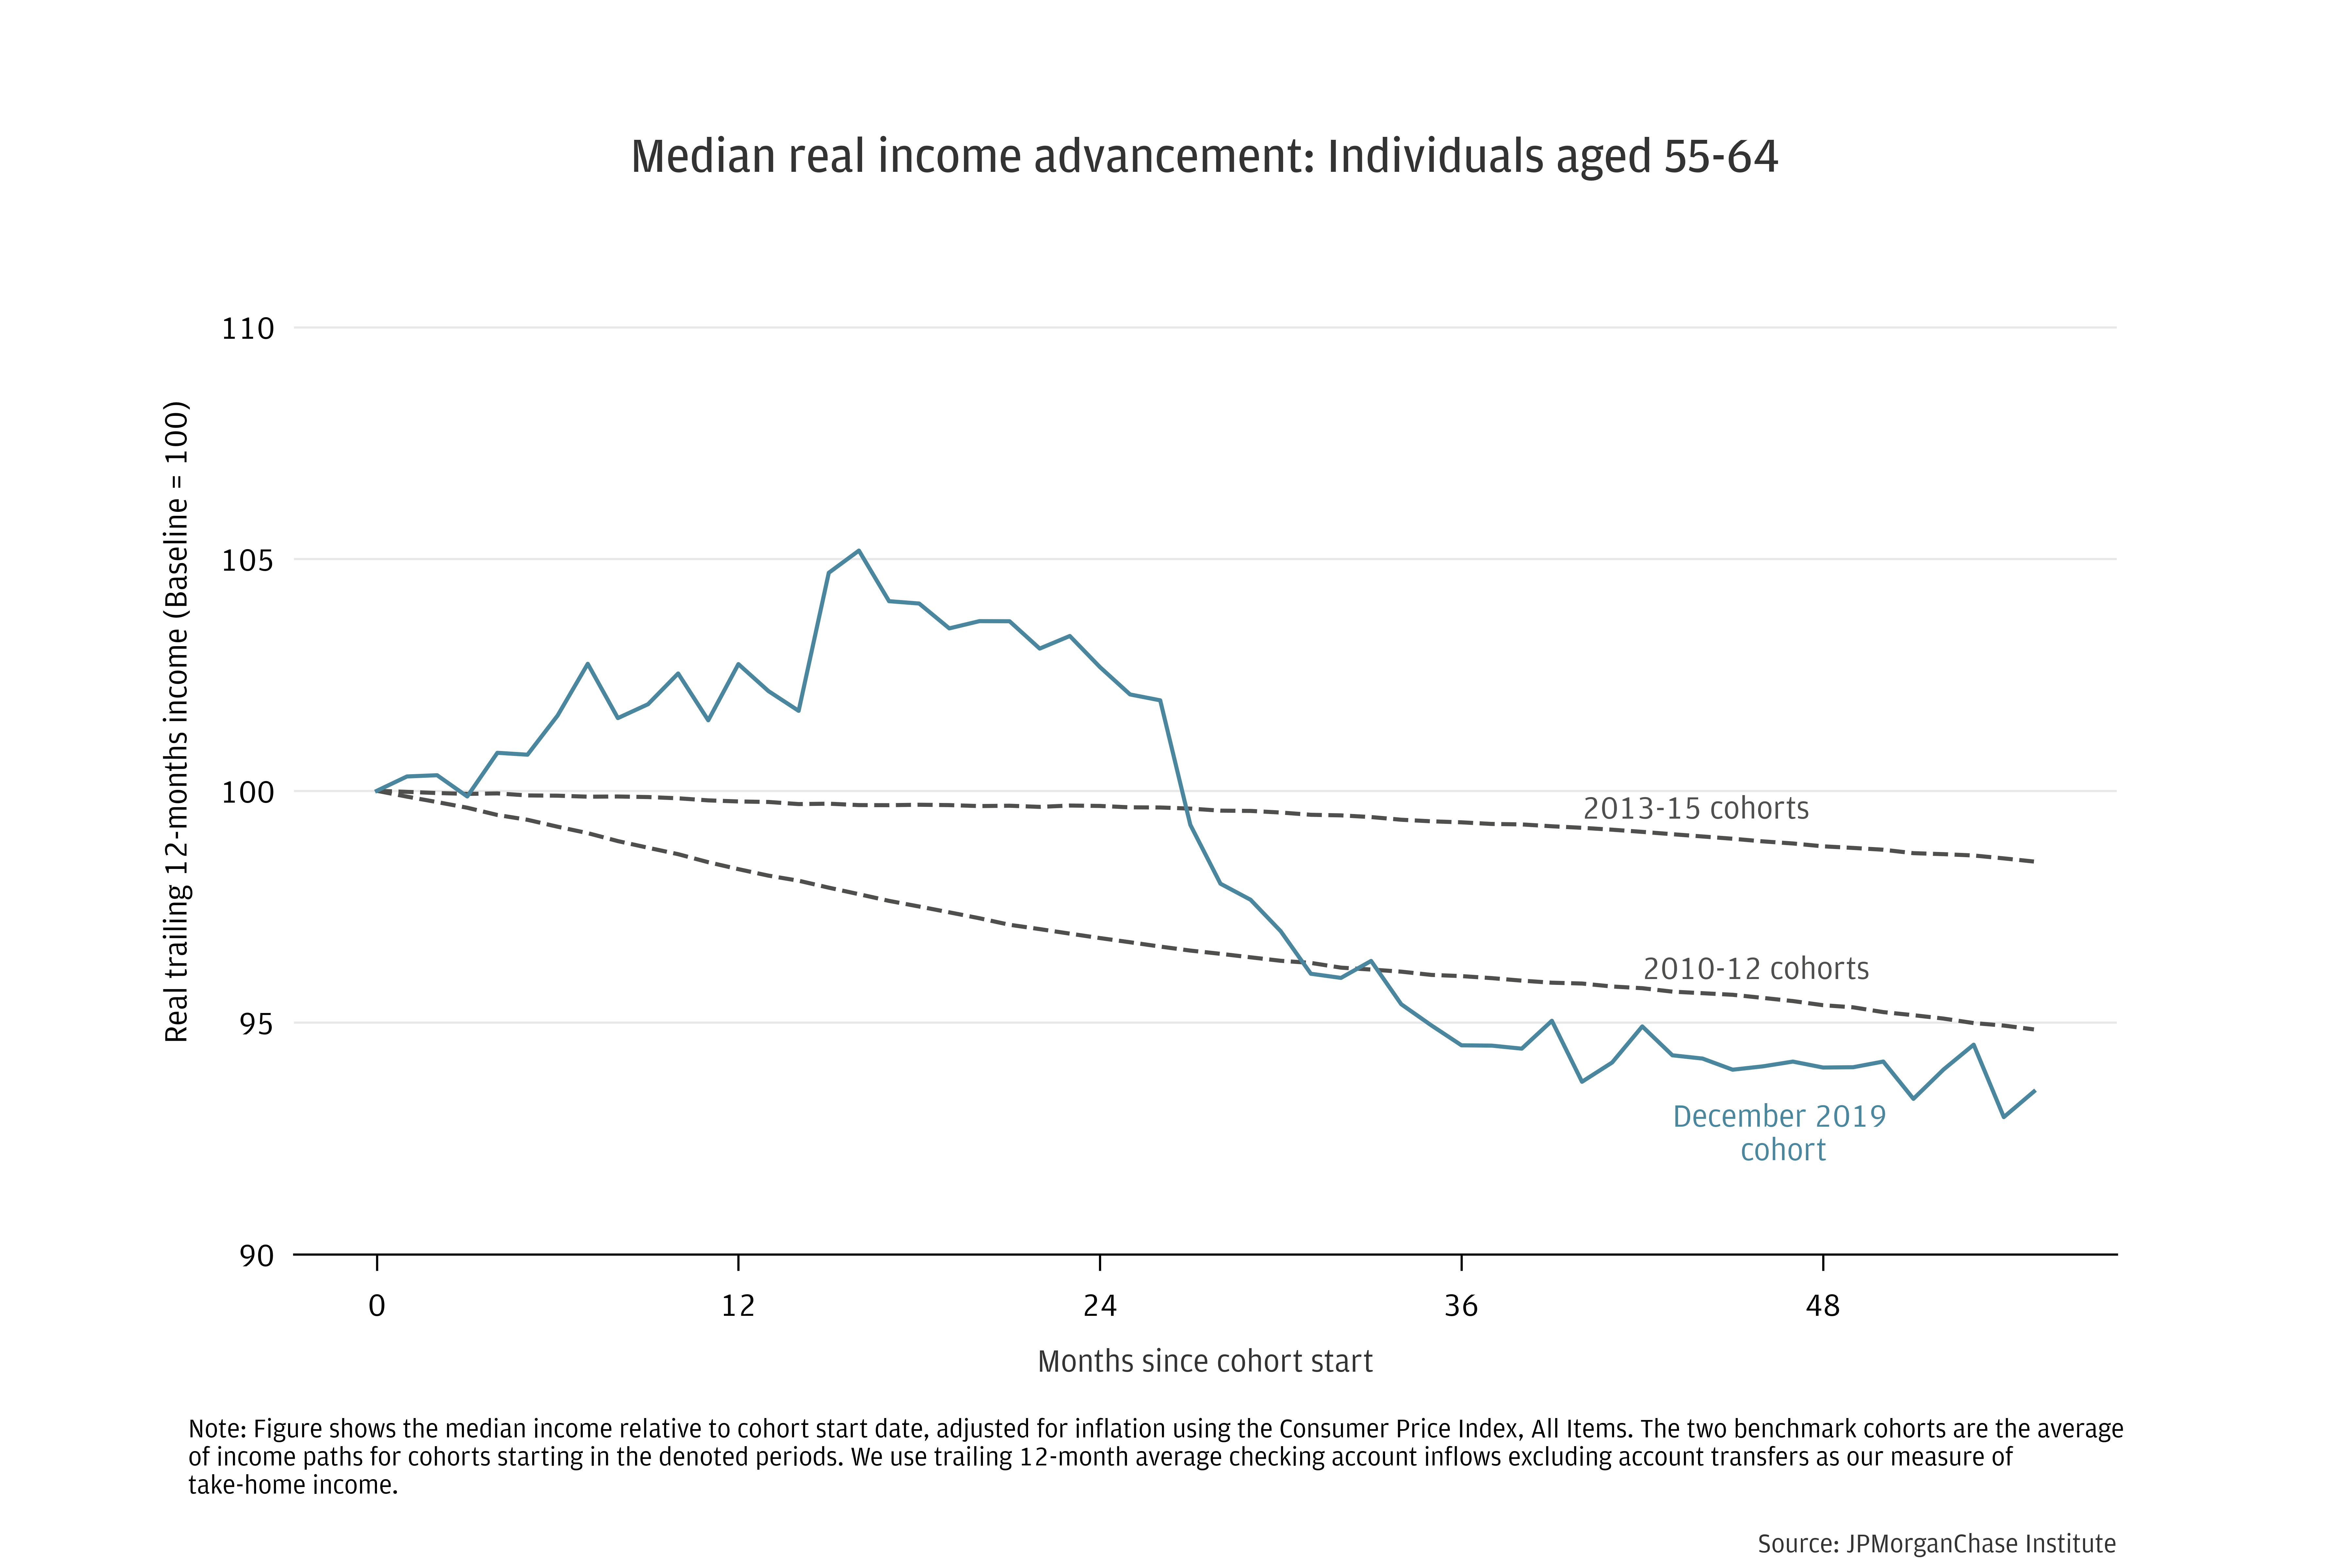
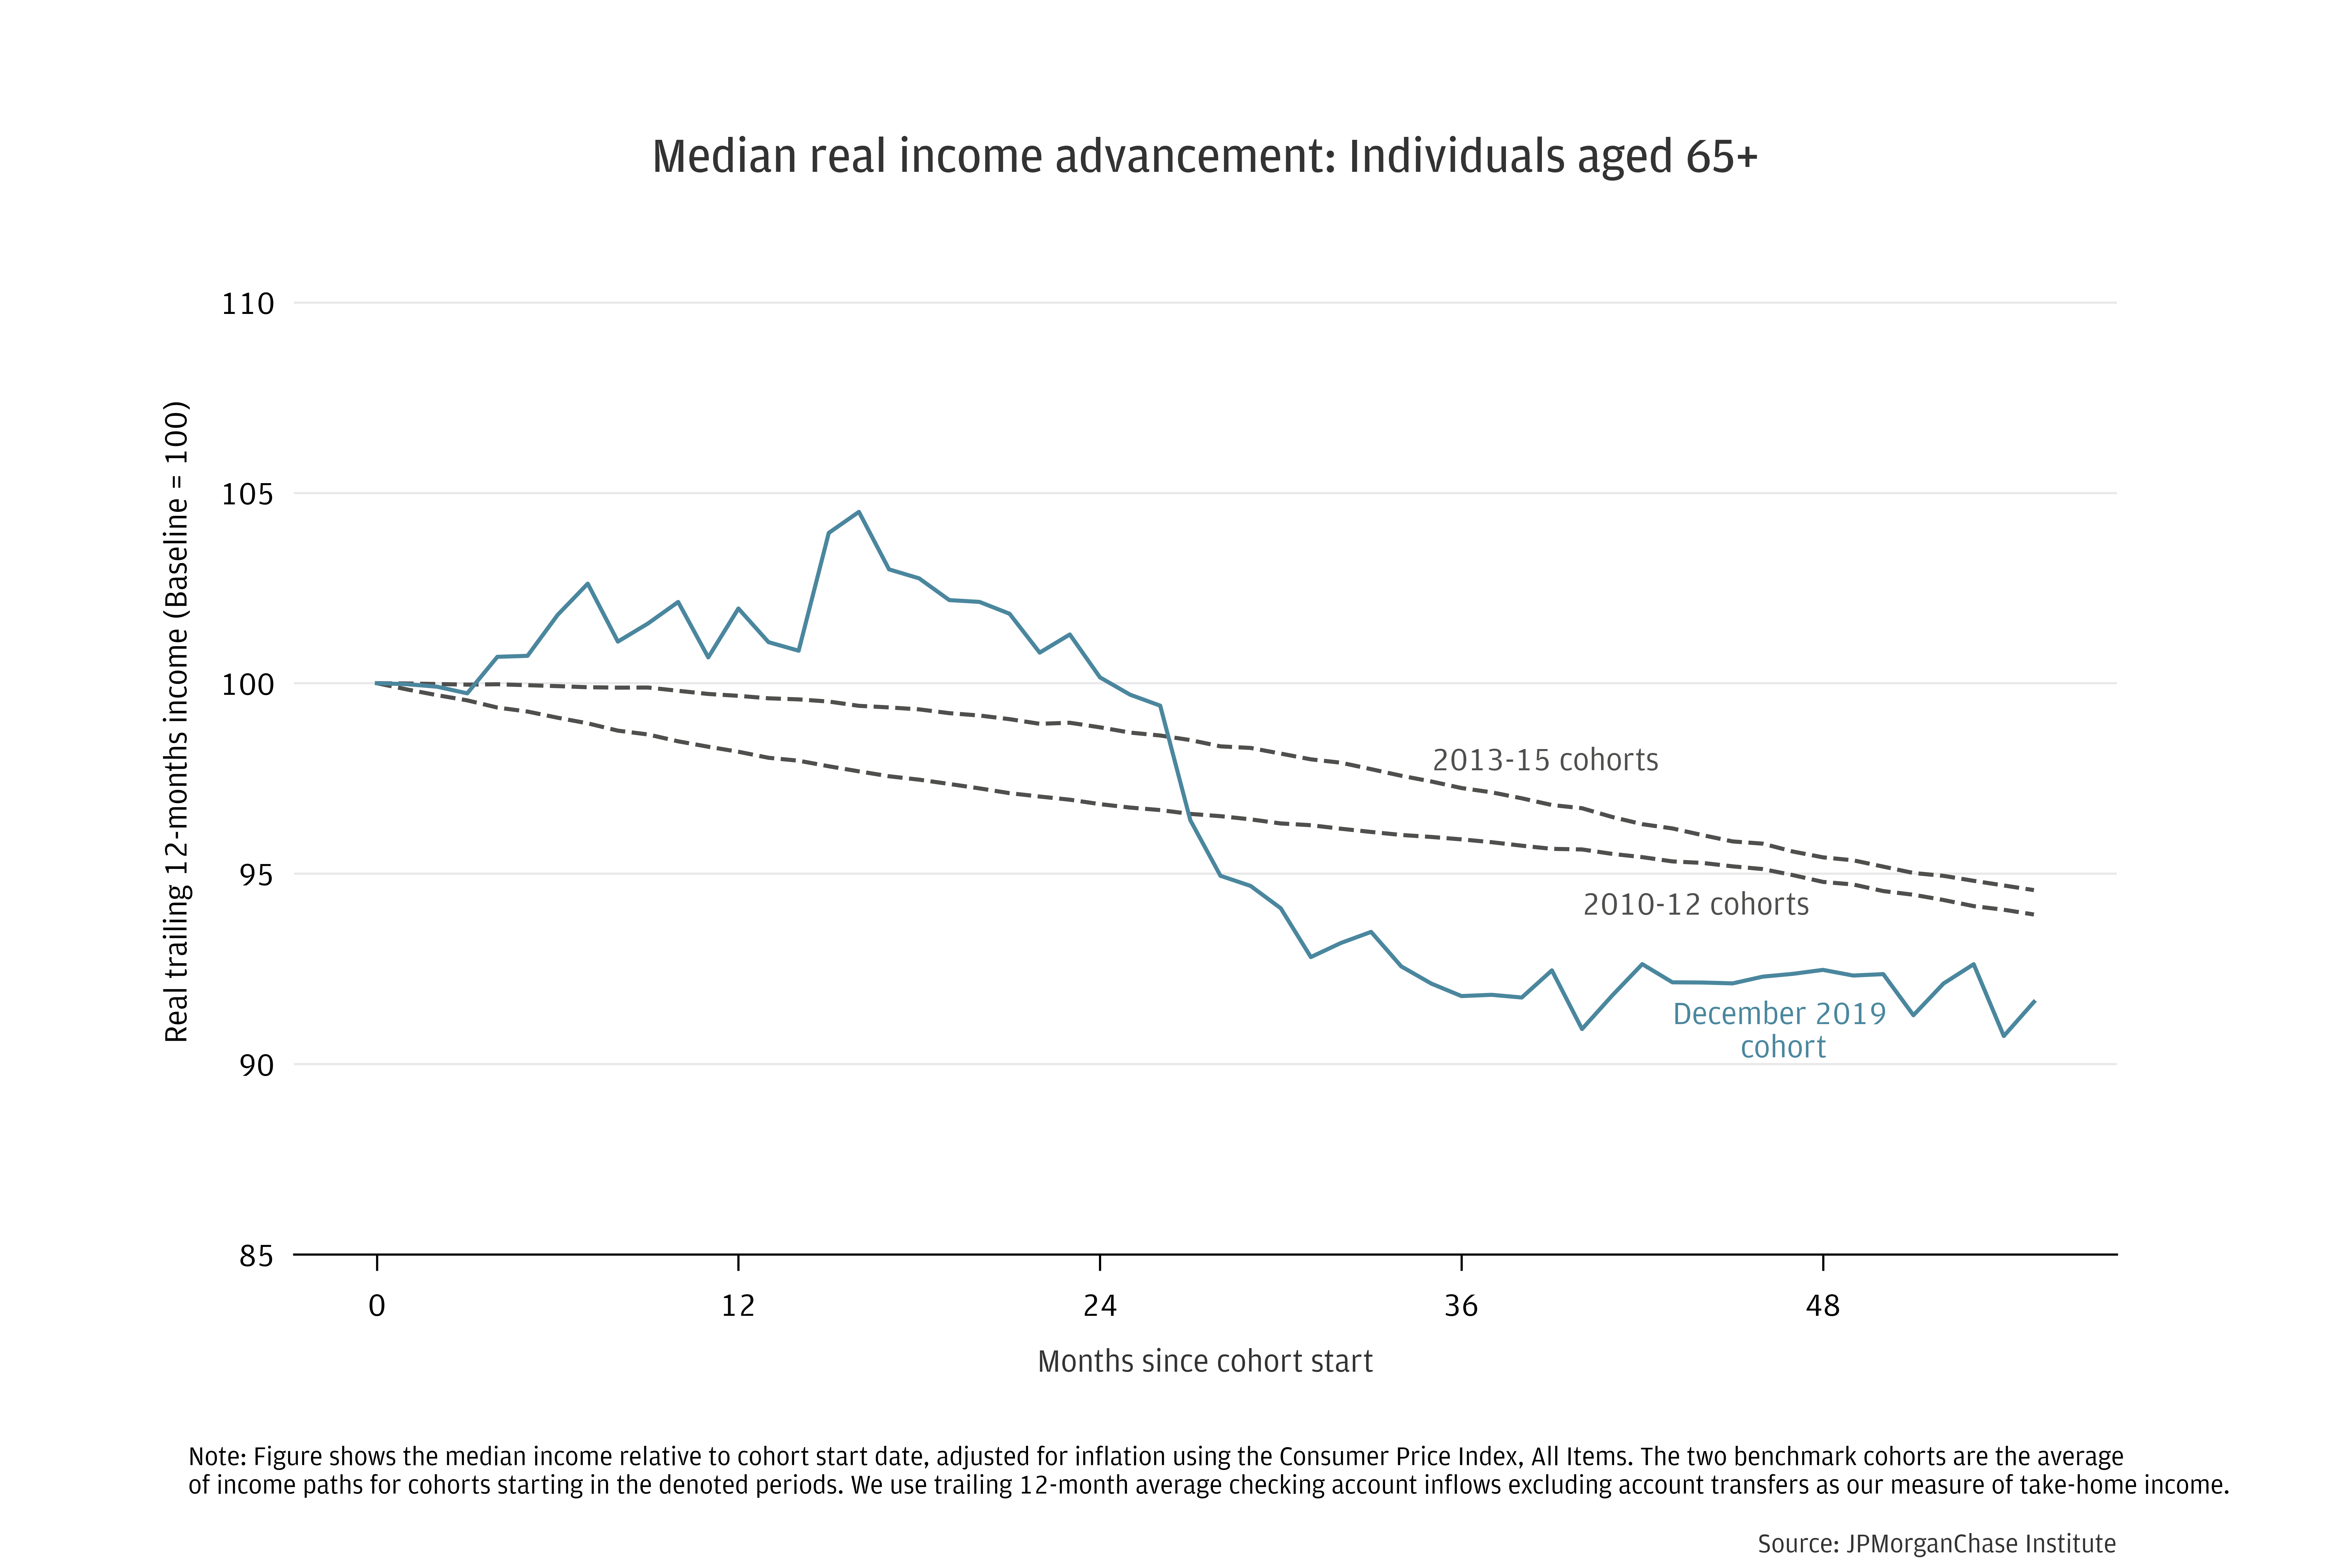
Federal Reserve analysis shows a notable rise in retirements during the pandemic, in excess of demographic trends (Montes, Smith, and Dajon, 2022). Given the historical tendency for incomes to fall when people retire,4 earlier retirements would shift these declines earlier in people’s lives and potentially explain the changing dynamics in our data. If pandemic early retirements are in fact the main factor, the apparent shortfall seen for the December 2019 cohort may decline over time.
Most individuals in their early and middle working years experienced relatively weak real income growth from December 2019 through mid-2024, compared to outcomes seen during 2010s. For these age groups, income growth over this four-and-a-half year period has been only slightly better than the sluggish performance of the early recovery from the Great Recession (cohorts starting 2010-2012).
Individuals in their mid-50s through early retirement years in December 2019 experienced real income declines worse than both benchmarks from the 2010s. Early retirements during the pandemic may be a driver for these individuals. Beyond pandemic-specific or health-related factors, the shift earlier in retirements may also reflect a response to wealth effects generated by rising home and stock values. Better understanding the reasons for the increase in retirements during the pandemic remains a topic of ongoing research interest at the Institute and among policymakers.
Footnotes
The post-Great Recession expansion—from June 2009 to February 2020—was the longest on record dating from 1854, according to the National Bureau of Economic Research Business Cycle Dating Committee (link).
The link shows trends in Average Hourly Earnings and the Employment Cost Index for Wages and Salaries, adjusted for CPI inflation. The real wage indicators were roughly flat from the end of 2009 through 2014, and subsequently increased at about a 1 percent per year average pace until the pandemic.
The data in Guvenen et al. (2021) cover 1978-2013.
Estimates of the typical ratio of post-retirement spending needs to pre-retirement income are below 100 percent. See for example (Butrica, Smith, and Iams, 2012).
Butrica, Barbara A. and Smith, Karen E. and Iams, Howard. 2012. “This is Not Your Parents’ Retirement: Comparing Retirement Income Across Generations.” Social Security Bulletin, Vol. 72, No. 1, pp. 37-58, 2012, Available at SSRN: https://ssrn.com/abstract=1997415
Guvenen, Fatih, Karahan, Fatih, Ozkan, Serda, and Jae Song. 2021. “What Do Data on Millions of U.S. Workers Reveal about Lifecycle Earnings Dynamics?” Econometrica 89(5): 2303-2339. https://doi.org/10.3982/ECTA14603
Montes, Joshua, Christopher Smith, and Juliana Dajon. 2022. "’The Great Retirement Boom’: The Pandemic-Era Surge in Retirements and Implications for Future Labor Force Participation.” Finance and Economics Discussion Series. November 2022. https://www.federalreserve.gov/econres/feds/the-great-retirement-boom.htm
Okun, Arthur M. 1973. “Upward Mobility in a High-Pressure Economy”. Brookings Papers on Economic Activity 4(1): 207-262. https://www.brookings.edu/articles/upward-mobility-in-a-high-pressure-economy/
We thank our research team, especially Guillaume Kasten-Sportes, for their contributions to the analysis. We also thank Liz Ellis, Annabel Jouard, Oscar Cruz, and Alfonso Zenteno for their support. We are indebted to our internal partners and colleagues, who support delivery of our agenda in a myriad of ways and acknowledge their contributions to each and all releases.
We would like to acknowledge Jamie Dimon, CEO of JPMorganChase, for his vision and leadership in establishing the Institute and enabling the ongoing research agenda. We remain deeply grateful to Peter Scher, Vice Chairman, Tim Berry, Head of Corporate Responsibility, Heather Higginbottom, Head of Research & Policy, and others across the firm for the resources and support to pioneer a new approach contributing to global economic analysis and insight.
This material is a product of JPMorganChase Institute and is provided to you solely for general information purposes. Unless otherwise specifically stated, any views or opinions expressed herein are solely those of the authors listed and may differ from the views and opinions expressed by J.P. Morgan Securities LLC (JPMS) Research Department or other departments or divisions of JPMorgan Chase & Co. or its affiliates. This material is not a product of the Research Department of JPMS. Information has been obtained from sources believed to be reliable, but JPMorgan Chase & Co. or its affiliates and/or subsidiaries (collectively J.P. Morgan) do not warrant its completeness or accuracy. Opinions and estimates constitute our judgment as of the date of this material and are subject to change without notice. No representation or warranty should be made with regard to any computations, graphs, tables, diagrams or commentary in this material, which is provided for illustration/reference purposes only. The data relied on for this report are based on past transactions and may not be indicative of future results. J.P. Morgan assumes no duty to update any information in this material in the event that such information changes. The opinion herein should not be construed as an individual recommendation for any particular client and is not intended as advice or recommendations of particular securities, financial instruments, or strategies for a particular client. This material does not constitute a solicitation or offer in any jurisdiction where such a solicitation is unlawful.
Wheat, Chris, and George Eckerd. 2024. “Climbing up (or off) the career ladder: Lifecycle income progression by age.” JPMorganChase Institute. https://www.jpmorganchase.com/institute/all-topics/financial-health-wealth-creation/climbing-up-or-off-the-career-ladder-lifecycle-income-progression-by-age

Chris Wheat
President, JPMorganChase Institute

George Eckerd
Research Director for Wealth and Markets, JPMorganChase Institute