
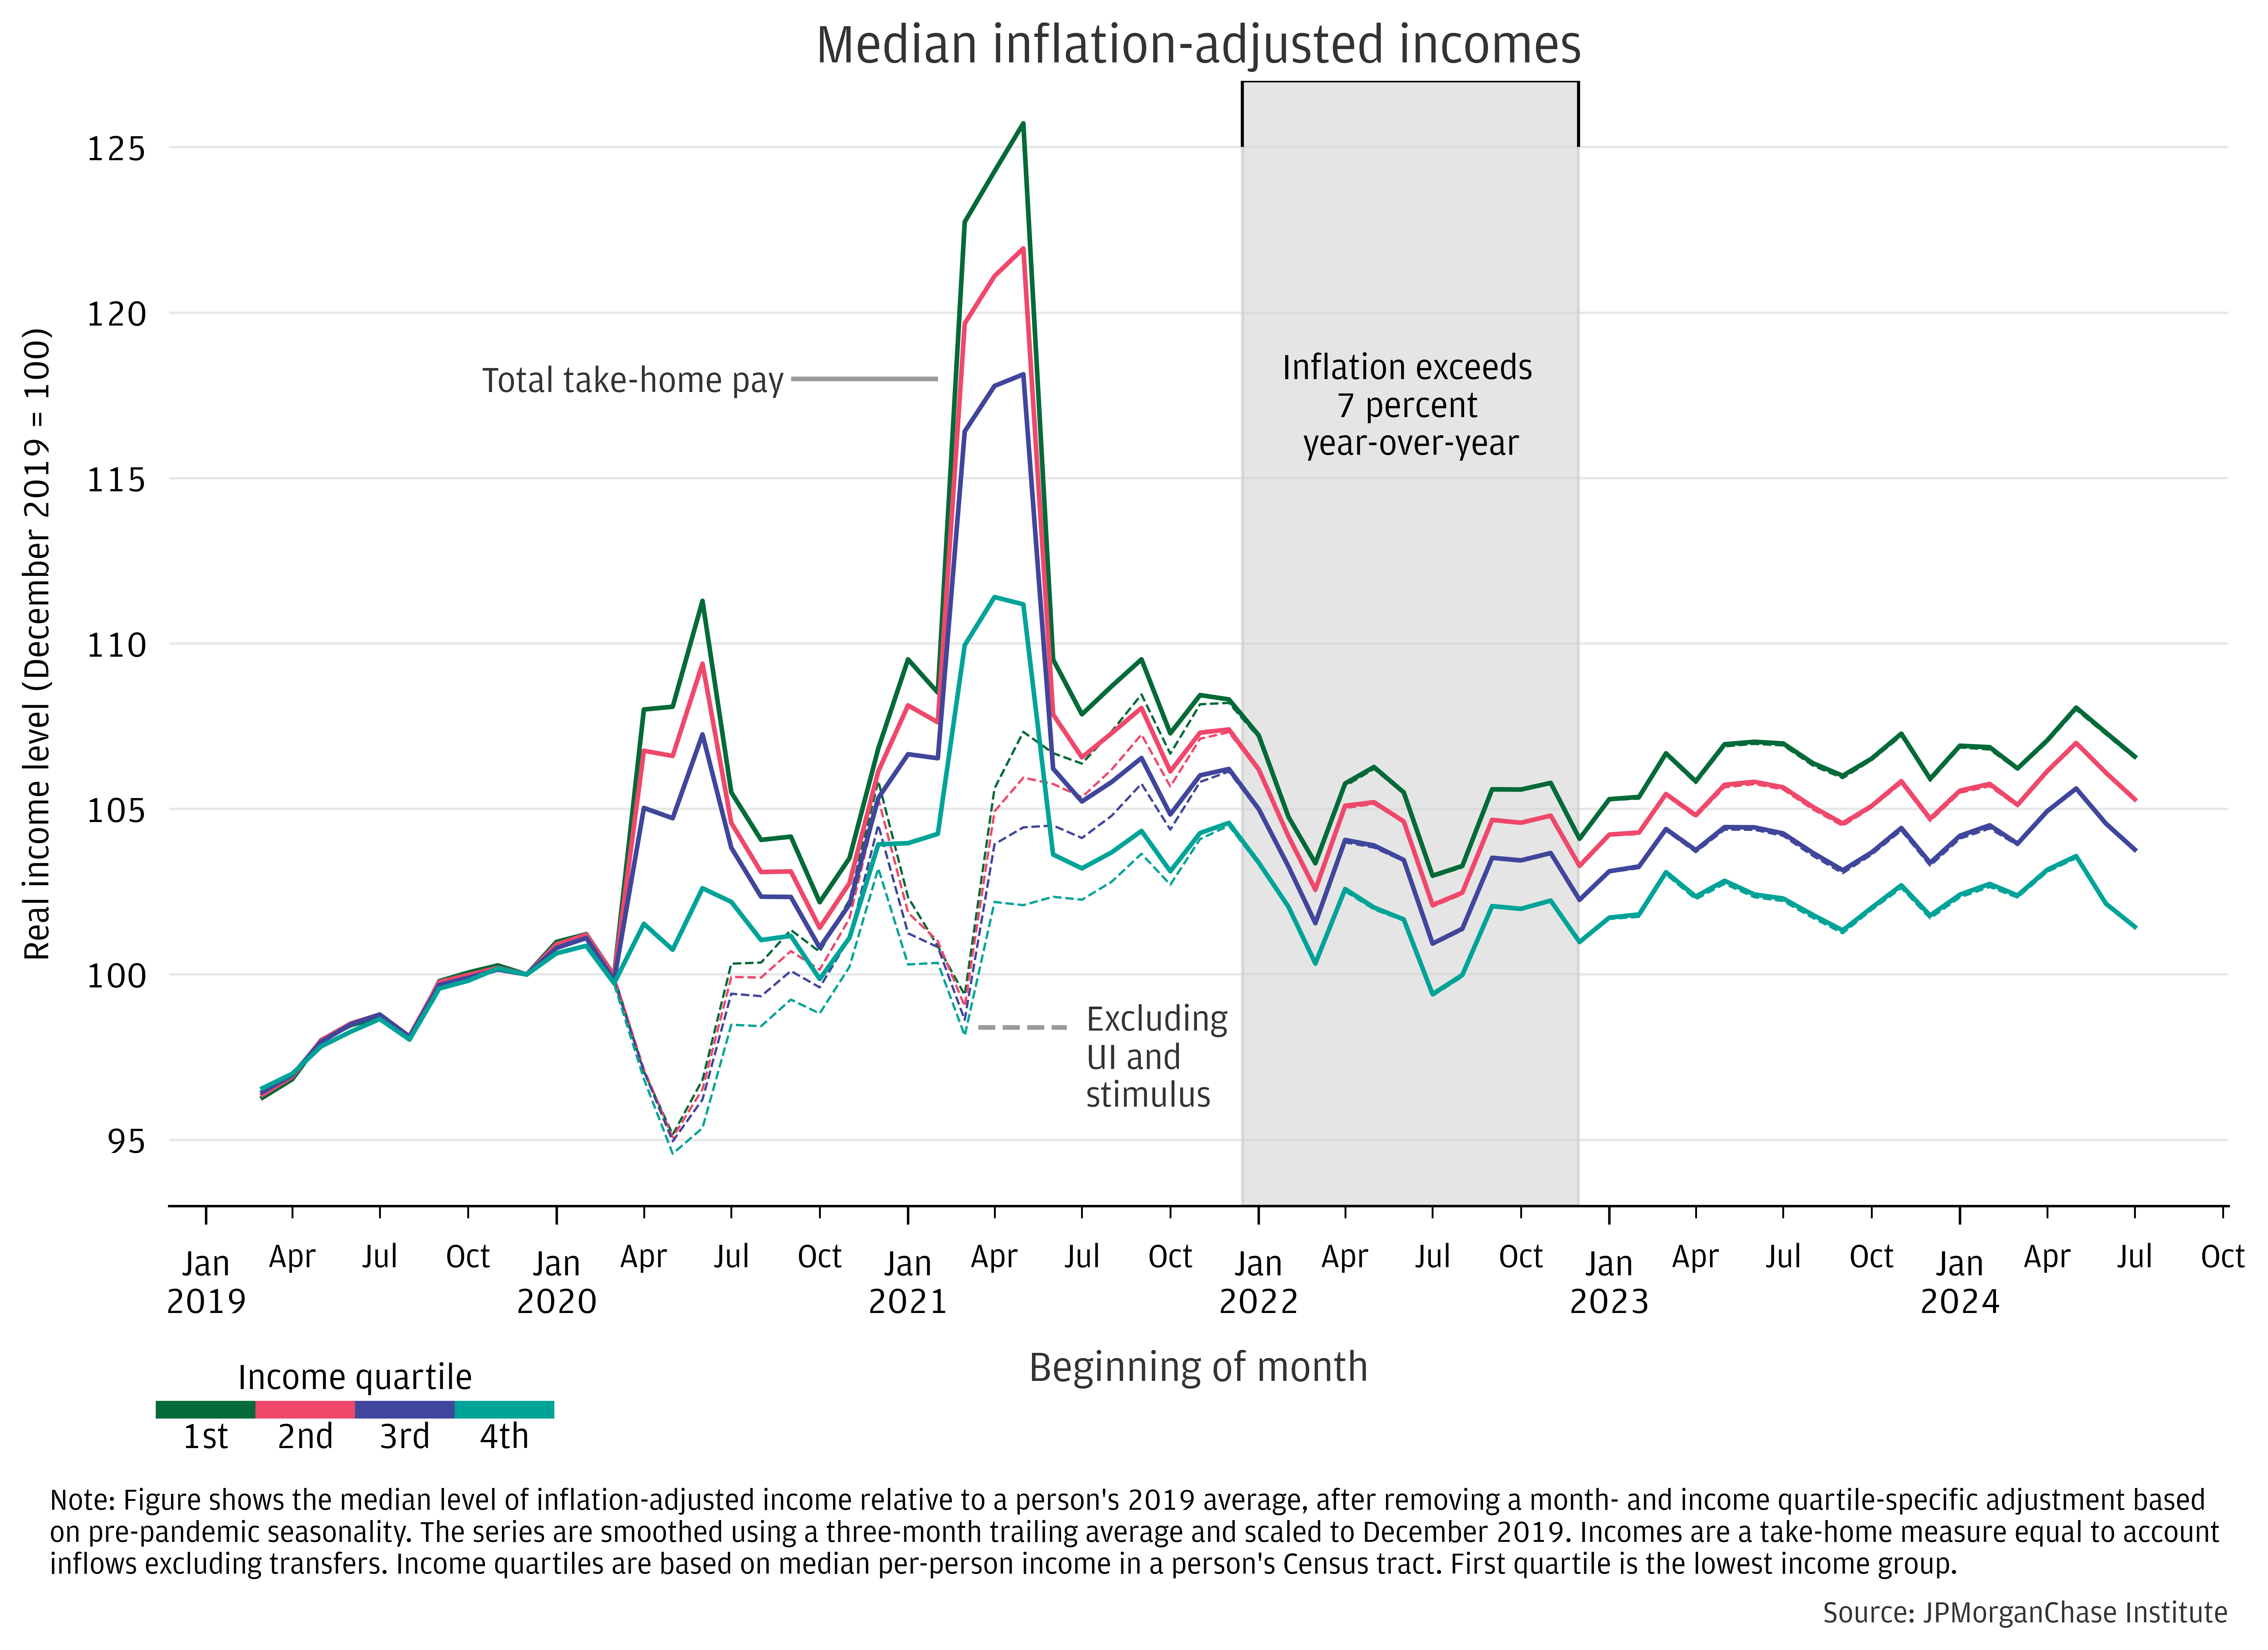
Figure 1: As of mid-2024 median changes in real incomes since 2019 remained modest, although lower-income individuals have fared somewhat better.4
Latest news

An Ohio-based company is protecting first responders around the world
With support from JPMorganChase, Fire-Dex is providing protective equipment to firefighters in 100 countries and all 50 states.
Learn moreLatest news

The consistency of health insurance coverage in small businesses: industry challenges and insights
Learn moreLatest news

Veteran’s Unconventional Path to Landing her Dream Job in Tech
U.S. Army Veteran Ashley Wigfall transitioned to a civilian role and charted her path to technologist through mentorship and skills training at the JPMorgan Chase tech hub in Plano, Texas.
Learn more
Research
September 12, 2024
During the past two years, consumer price inflation has come down while labor market conditions have remained relatively strong, albeit as the unemployment rate has risen almost one percentage point from its lows in early 2023.1 In this report, we measure whether these macroeconomic tailwinds are translating into income gains in excess of changes in consumer prices, and which population subgroups are experiencing the most benefit. Public data on income dynamics can vary significantly, due in part to pandemic-era volatility and changes in the composition of the working population.2 Our analysis uses de-identified data covering 8 million individuals and shows median outcomes of take-home income changes to help overcome these challenges and track a metric that follows a tangible element of people’s financial lives.
Figure 1 shows median purchasing power of incomes was modestly higher as of July 2024 relative to December 2019 for all income quartiles. We adjust for inflation using the Consumer Prices Index for All Items.3 The plot shades the period of particularly high year-over-year price increases, which coincided with real income volatility and was followed by a period of relative stagnation over much of 2023 and through mid-2024. The latest data points show a negative recent trend as of July, reversing modest gains earlier in earlier months.
Lower-income individuals slightly expanded their relative gains in purchasing power during the past few years. Since December 2019, our real income measure shows the lowest income quartile saw a 6 percent increase (under 2 percent annualized) compared to 1 percent for the top income quartile as of July 2024.
Figure 1: As of mid-2024 median changes in real incomes since 2019 remained modest, although lower-income individuals have fared somewhat better.4
Increases in purchasing power across quartiles are relatively small considering the effect of aging: the average individual in this sample was 42 as of 2019 and 47 in 2024. Academic research (Guvenen et. al. 2021) on incomes over the lifecycle indicates that 47-year-olds earn 7 percent more than 42-year-olds on average.5 Given this benchmark, which effectively assumes no underlying economic growth, our data suggest that rising output is not translating well into growth in take-home incomes. Performance in our data, therefore, is more consistent with publicly available indicators showing marginal real gains since 2019, as seen in Average Hourly Earnings and the Employment Cost Index (FRED link), relative to the more rosy picture seen in Gross Domestic Product per-person (FRED link).6 This result is confirmed in the companion analysis that directly studies differences by age groups and compares purchasing power advancement using pre-pandemic cohorts.
Data
Our analysis uses de-identified data covering income dynamics of more than 8 million individuals. The main sample spans December 2019−July 2024.7 The multi-year panel perspective centers the analysis on typical dynamics experienced by workers in their take-home pay. We adjust for changes in consumer prices using the Consumer Price Index, All Items (CPI).8 A comparable longer-running sample provides the basis for monthly seasonal adjustment, which we compute for each group using data 2012−2019. We also adjust for months with five Fridays, which tend to lead to higher bank-account-based income for a significant share of people receiving pay on Fridays. For each individual in each month, we divide checking account inflows less account transfers by the person’s 2019 average and by the seasonal adjustment factor for that person’s income quartile and month. The income indicator used in this report’s figures is the median of this metric, scaled to the value for December 2019, smoothed with a three-month trailing average.
Locale-based income grouping
We use individual-level panel data to compute income growth. However, for this analysis (as in prior Institute reports on income growth), we do not group individuals by their observed income. Instead, when grouping by income, we use the national rank of each individual’s Census tract in terms of median per-person income. In addition to reducing sample composition bias related to Chase’s customer base, this method reduces the potential for (non-economic) volatility in our data to bias growth rates by income tier. For example, if a typically high-income household experiences a temporary interruption in observed inflows—which could occur if an individual operates multiple checking accounts—we could erroneously categorize them as low-income and later over-estimate income growth.
In general, such distortions would tend to bias upward measured growth for those categorized as low-income and bias downward measured growth for high-income categories. Additionally, since younger individuals tend to have both lower incomes and higher income growth rates—a focus of the companion report—sorting on observed income would capture a large, unwanted, age effect. Using tract-level income effectively neutralizes age differences by income group in our sample and targets differences aligned with individuals’ total lifetime income or socio-economic strata.
While our methodology reduces the above sources of bias, grouping by average incomes in an individual’s tract may understate true differences across the population. That is, an individual’s tract of residence provides an indication of their income (and likely other socio-economic factors), but any geographic aggregate may smooth over potentially notable, within-locale heterogeneity, muting measured differences.
The figures in this report show our proxy for total income—checking account inflows, excluding transfers between a person’s accounts—alongside a measure that excludes Unemployment Insurance and Economic Impact Payments. Separating out these fiscal supports allows for a more comparable metric over time. The gap between these measures shows the considerable impact of direct government transfers during the pandemic’s height. The two income concepts converge during the second half of 2021 and early 2022 as stimulus programs phased out and extent of unemployment roughly aligned with its average over 2019.
Figure 2 shows the same real income metrics using our de-identified sample with race information, covering half a million individuals.9 10 Differences by race are directionally consistent with trends seen across income quartiles, considering differences in median income by race in the U.S. population.11 From December 2019−July 2024, the median gain in purchasing power was 6 percent for Black individuals in our sample, 5 percent for Hispanic, 3 percent for White, and approximately zero for Asian. Note, due to differences in our sample—e.g., in geography—with race information, results may not align with the larger sample used for Figure 1.
Figure 2: Black and Hispanic individuals have experienced gains in purchasing power above those of White and Asian individuals.

Median gains in CPI-adjusted incomes December 2019−July 2024 were relatively limited. Considering growth typically associated with career progression as individuals age, our data on take-home pay show gains falling short of expectations for a growing overall economy. High inflation starting in mid-2021 coincided with an extended period of weak performance.
However, modestly better outcomes for lower-income individuals are directionally consistent with a tight labor market supporting income redistribution (Okun, 1973), although such progress has been small looking back to mid-2022, when most of the pandemic volatility was subsiding. The unemployment rate has gradually risen from a low of 3.4 percent in early 2023 to 4.2 percent in August 2024, but it remains just below the Congressional Budget Office’s current estimate of full employment (custom FRED link). The precedent of the last time unemployment was below the full employment estimate—early 2017 to February 2020—suggests that slow progress in closing racial and overall income gaps should not be surprising. Amid those earlier favorable conditions, median growth in real income of the bottom income quartile was only about 1 percentage point (annualized) higher than the top income quartile (Greig et al., 2021). Abstracting from the pandemic volatility, that performance is in line with the trends from December 2019 through mid-2024. Cumulating relative growth trends since 2017 suggest a more significant total narrowing of income gaps.
Footnotes
Year-over-year increases in the Consumer Price Index (All Items) fell from 9.0 percent in June 2022 to 2.9 percent as of July 2024. Over the same period, the unemployment rate has risen from 3.6 to 4.3 percent, just below the Congressional Budget Office’s estimate of the full-employment level. FRED link.
As of early 2024, two indicators of wages, the Employment Cost Index and Average Hourly Earnings, were about 2 percentage points apart in their measurement of real wage gains since the start of the pandemic (Custom FRED link; see also discussion in this Institute Take from March 2024). Recent divergence between official statistics on the topic are also covered in East et al. (2023).
The median age of the labor force was 42 as of 2022, according to the Bureau of Labor Statistics (link).
This benchmark comes from data of Figure C36 in Guvenen et. al. (2021) “What Do Data on Millions of U.S. Workers Reveal about Life-Cycle Earnings Risk?” These underlying data are available at the lead author’s website here.
Real gross domestic product per-person rose by almost 8 percent between the end of 2019 and the second quarter of 2024. (FRED link).
We use a separate, earlier sample to compute monthly seasonality trends and to adjust the figures used in this report.
Specifically, we deflate take-home indexes using the All-Items CPI-U measure (FRED ticker: CPIAUSCL). In Wheat and Eckerd (2022), we deflated incomes using the PCE Index. While both inflation indicators have their strengths as estimates of price inflation, we use CPI in this report, as it maps to out-of-pocket expenses, which qualitatively aligns with our take-home-pay income construct. See Johnson (2017) for a discussion of the differences between the two measures.
Self-identified demographic data was obtained in 2021 from a third party for the JPMorganChase Institute to conduct economic research examining financial outcomes by race, ethnicity, and gender. We matched the demographic data to internal banking records using encrypted quasi-identifiers. This de-identified file contains banking records and demographics only available to the JPMorgan Chase Institute.
We apply an additional age filter to this sample, narrowing the band to 30−57 year-olds as of December 2019, to limit age differences across race groups and to keep the average age for each race group close to the labor force average reported by the BLS.
Averaging Census Bureau data 2013−2020, median incomes for Black, Hispanic, White, and Asian households were $42,210, $51,010, $71,100, and $87,550, respectively, in 2020 dollars. See Institute report: Racial Income Inequality Dynamics (May 2022).
East, Chloe N., Edelberg, Wendy, and Noadia Steinmetz-Silber. 2023. “Have workers gotten a raise?” The Hamilton Project, October 24, 2023. https://www.hamiltonproject.org/publication/post/have-workers-gotten-a-raise/
Guvenen, Fatih, Karahan, Fatih, Ozkan, Serda, and Jae Song. 2021. “What Do Data on Millions of U.S. Workers Reveal about Lifecycle Earnings Dynamics?” Econometrica 89(5): 2303-2339. https://doi.org/10.3982/ECTA14603
Okun, Arthur M. 1973. “Upward Mobility in a High-Pressure Economy”. Brookings Papers on Economic Activity 4(1): 207-262. https://www.brookings.edu/articles/upward-mobility-in-a-high-pressure-economy/
We thank our research team, especially Guillaume Kasten-Sportes, for their contributions to the analysis. We also thank Liz Ellis, Annabel Jouard, Oscar Cruz, and Alfonso Zenteno for their support. We are indebted to our internal partners and colleagues, who support delivery of our agenda in a myriad of ways and acknowledge their contributions to each and all releases.
We would like to acknowledge Jamie Dimon, CEO of JPMorganChase, for his vision and leadership in establishing the Institute and enabling the ongoing research agenda. We remain deeply grateful to Peter Scher, Vice Chairman, Tim Berry, Head of Corporate Responsibility, Heather Higginbottom, Head of Research & Policy, and others across the firm for the resources and support to pioneer a new approach contributing to global economic analysis and insight.
This material is a product of JPMorganChase Institute and is provided to you solely for general information purposes. Unless otherwise specifically stated, any views or opinions expressed herein are solely those of the authors listed and may differ from the views and opinions expressed by J.P. Morgan Securities LLC (JPMS) Research Department or other departments or divisions of JPMorgan Chase & Co. or its affiliates. This material is not a product of the Research Department of JPMS. Information has been obtained from sources believed to be reliable, but JPMorgan Chase & Co. or its affiliates and/or subsidiaries (collectively J.P. Morgan) do not warrant its completeness or accuracy. Opinions and estimates constitute our judgment as of the date of this material and are subject to change without notice. No representation or warranty should be made with regard to any computations, graphs, tables, diagrams or commentary in this material, which is provided for illustration/reference purposes only. The data relied on for this report are based on past transactions and may not be indicative of future results. J.P. Morgan assumes no duty to update any information in this material in the event that such information changes. The opinion herein should not be construed as an individual recommendation for any particular client and is not intended as advice or recommendations of particular securities, financial instruments, or strategies for a particular client. This material does not constitute a solicitation or offer in any jurisdiction where such a solicitation is unlawful.
Wheat, Chris, and George Eckerd. 2024. “The purchasing power of household incomes: Worker outcomes through July 2024 by income and race.” JPMorganChase Institute. https://www.jpmorganchase.com/institute/all-topics/financial-health-wealth-creation/the-purchasing-power-of-household-incomes-worker-outcomes-through-july-2024-by-income-and-race

Chris Wheat
President, JPMorganChase Institute

George Eckerd
Research Director for Wealth and Markets, JPMorganChase Institute