

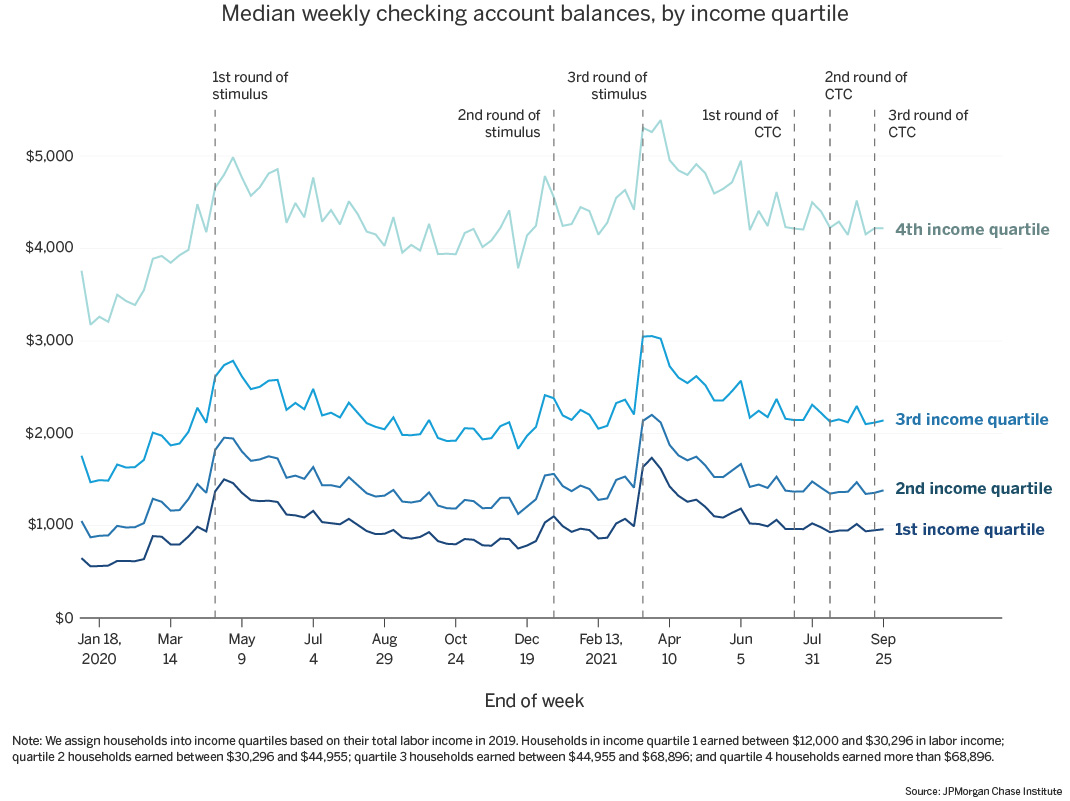
Figure 1: As of September 2021, cash balances remained boosted at all income levels but low-income families still had just roughly $1,000 in their checking accounts.
Source: JPMorgan Chase Institute
Latest news

An Ohio-based company is protecting first responders around the world
With support from JPMorganChase, Fire-Dex is providing protective equipment to firefighters in 100 countries and all 50 states.
Learn moreLatest news

Veteran’s Unconventional Path to Landing her Dream Job in Tech
U.S. Army Veteran Ashley Wigfall transitioned to a civilian role and charted her path to technologist through mentorship and skills training at the JPMorgan Chase tech hub in Plano, Texas.
Learn more
Findings
The COVID-19 pandemic resulted in an unprecedented recession that impacted families’ financial positions. Based on recent JPMorgan Chase Institute research, our Household Finances Pulse leverages de-identified administrative banking data to analyze changes in cash balances during the COVID-19 pandemic and ongoing recovery. This release examines the path of liquid balances as of the end of September 2021, giving us a first look at liquid asset trends after the nation-wide expiration of expanded Unemployment Insurance (UI) benefits on September 5, 2021, and the first three months of the advanced Child Tax Credit (CTC) payments. We compare cash balance trends across the income distribution and also between families with and without dependent children.
During the pandemic, the federal government provided cash assistance and relief to families through a range of interventions, including three rounds of stimulus payments, expanded unemployment insurance, mortgage and student loan debt forbearance, and most recently, the advanced CTC. The first round of stimulus, or economic impact payments (EIP), started April 15, 2020, and delivered up to $1,200 per adult and $500 per qualifying child under the age of 17. Throughout the pandemic, additional government supports, including further stimulus payments and expanded unemployment benefits,1 were disbursed to help families weather the storm. Stimulus payments provided progressively more per child in each round, providing up to $600 apiece with the second stimulus, and up to $1,400 apiece with the third.
Throughout this time, expanded unemployment insurance delivered payments to jobless workers, including gig workers and self-employed workers, with a weekly supplement of $600 between March and July 2020 and $300 during October 2020 and between January and September 2021. Twenty-five states had ended expanded UI benefits by the end of July 2021, with the remaining states ending benefits on September 5, 2021. At this time, roughly two-thirds of benefit recipients lost benefits entirely, while one-third lost just the weekly $300 supplement.
The American Rescue Plan increased the dollar amount of CTC payments and expanded the eligibility for families.2 On July 15, 2021, the first monthly advanced CTC payments were delivered, paying up to $300 per child under 6 years of age and up to $250 per child aged 6 to 17 years. A major policy question is whether and for how long advanced CTC should be extended beyond 2021.3
Additional open questions remain as to the role of liquidity in explaining labor market and spending trends. For example, recent evidence has pointed to tepid job growth despite the end of expanded UI benefits. Some have speculated whether liquid balance boosts could be a contributing factor to why people are not going back to work more quickly.
In this brief, we examine the path of liquid balances throughout the pandemic and as of September 25, 2021. We document these trends across the income distribution. For the first time, we also analyze trends by family structure, using first-round EIP amounts and CTC payments to infer the number of adults and dependent children (see box). This helps inform the impacts of pandemic financial supports on CTC-targeted families and also provides a window into the balance trends of households not receiving advanced CTC payments.
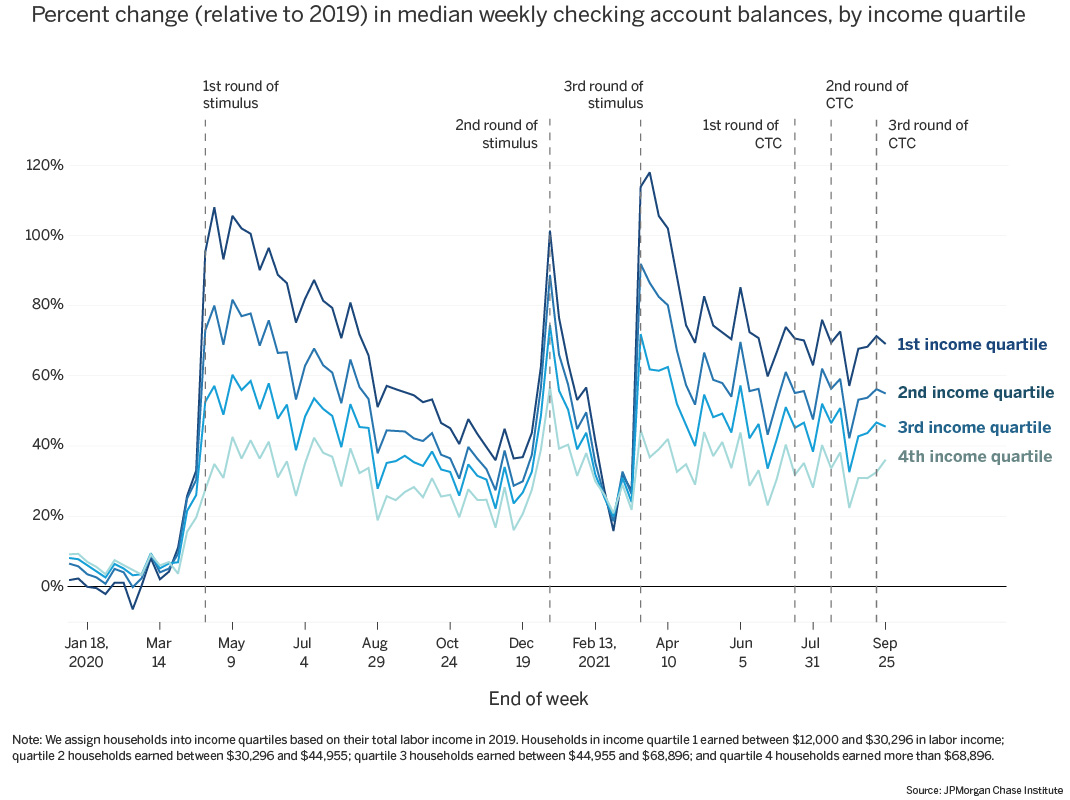
The typical low-income family still had 70 percent more cash on hand than two years prior (Figure 2), but that amounted to just $1,000 (Figure 1). Balances among high-income families were roughly 40 percent elevated. When we focus on families who are not receiving advanced CTC (Figures 3 and 4), balances remained roughly 50 percent elevated relative to two years prior, at roughly $1,600.
A reasonable question is whether a 70 percent increase or $1,000 represents a large cash buffer for low-income families. In prior work we documented that families experience a lot of income and spending volatility and need a cash buffer to weather these month-to-month fluctuations. We estimated that low-income families need roughly 7 weeks’ worth of take-home income to cover a simultaneous income dip and expense spike, which translates to needing a cash buffer of roughly $2,500. And yet, the typical low-income family had more like $600 prior to the pandemic.
Moreover, this buffer may be even more narrow for Black and Latinx families. Ganong et al (2020) showed that checking account balances represent a much higher proportion of total liquid assets for Black and Latinx families than White families. In other words, a balance of $1,000 is going to be closer to the full picture of financial assets that many low-income Black and Latinx families have to draw upon, while low-income White families typically have additional cash buffer in other liquid assets. This suggests that Black and Latinx families could face financial urgency sooner. Indeed, balance trends after the first round of stimulus suggest that Black and Latinx families, and Black and Latinx women in particular, depleted their boosts from the first round of EIP more quickly (Greig and Deadman, 2021).
In other words, a cash buffer of $1,000 is a substantial increase but by no means a thick security blanket for low-income families. That said, in addition to CTC payments, wage growth among the employed, student loan and mortgage forbearance, rent relief, and spending cuts among jobless workers who have lost UI benefits may all be continuing to sustain cash balances.
Figure 1: As of September 2021, cash balances remained boosted at all income levels but low-income families still had just roughly $1,000 in their checking accounts.
Source: JPMorgan Chase Institute
Figure 2: With each round of stimulus, low-income families saw the greatest percent gains in cash balances, but depleted those gains faster than high-income families.
Source: JPMorgan Chase Institute
Our Household Finances Pulse data asset covers 1.6 million families who were active checking account users between December 2018 and September 2021 and had at least $12,000 in total labor income in 2018 and 2019. To get at questions of how balances differ by presence of dependent children, we used two different methods for categorizing family structure:
CTC receipt: The start of advanced CTC payments in July 2021 allows us to see which families claim dependent children. We classify families as CTC-targeted or not, based on receiving a payment during the first disbursal of advanced CTC payments on July 15, 2021.
EIP amount: The first economic impact payment (EIP) in April 2020 distributed up to $1,200 per adult and $500 per child. Those payment amounts were phased out for families with high adjusted gross income. For families with income below that threshold, we can infer the number of adults and children in the family from the amount of stimulus received.
Both methods come with caveats. When assessing CTC, families that opt out of advance payments are in the non-targeted group, as are families with dependent children and income over the policy threshold of $440K for joint filers and $240K for individual filers. So the non-targeted group are not necessarily all child-free families.
When assessing stimulus payments, we exclude families with adjusted gross income greater than the cap for receiving the full stimulus amount—$150K for joint filers or $75K for individual filers—for a reduced sample of 980,000 families. For these remaining families, we use the total amount of the first stimulus payment received across the families’ checking accounts to classify family structure. While this sample excludes the highest earning families, we are able to confidently classify those who are included.
Cross-referencing the CTC recipient cut with the set of families for whom we can classify family structure by amount of stimulus payment, we see broad agreement: 94 percent of CTC recipients also received stimulus payments for dependent children, whereas a small minority (13 percent) of non-recipients did (Table 1). Likewise, within our stimulus sample, most of the families that we identified as having kids according to their EIP receipt amount also received advanced CTC payments, and only 3 to 4 percent of families tagged as child-free subsequently received advanced CTC payments (Table 2).
Several explanations could account for the fact that one sample identifies dependent children whereas the other does not. For example, families who have dependent children could have opted out of advanced CTC payments. In addition, a child might have been born or, alternatively, aged out of eligibility between the first round of stimulus in 2020 and CTC receipt in 2021.
Disagreement in inferred family structure between the two samples could also reflect measurement error. This could arise if families elected to deposit their CTC payments outside their Chase checking account despite receiving their stimulus payments to that account, or if we misclassified a family’s structure based on a tax refund received at the time and in the same amount of EIP disbursements.4
Group |
Sample |
Percent of Sample |
Percent with children |
|---|---|---|---|
CTC-targeted families |
414,960 |
26% |
94% |
Non-targeted families |
1,182,514 |
74% |
13% |
Total |
1,597,474 |
100% |
- |
*Based on the reduced sample of EIP recipients
Family Structure |
Sample Size |
Percent of Tagged Sample |
Percent receiving advanced |
|---|---|---|---|
2 adults, with kids |
231,557 |
24% |
79% |
2 adults, no kids |
167,443 |
17% |
4% |
1 adult, with kids |
149,091 |
15% |
74% |
1 adult, no kids |
433,649 |
44% |
3% |
Total |
981,740 |
100% |
- |
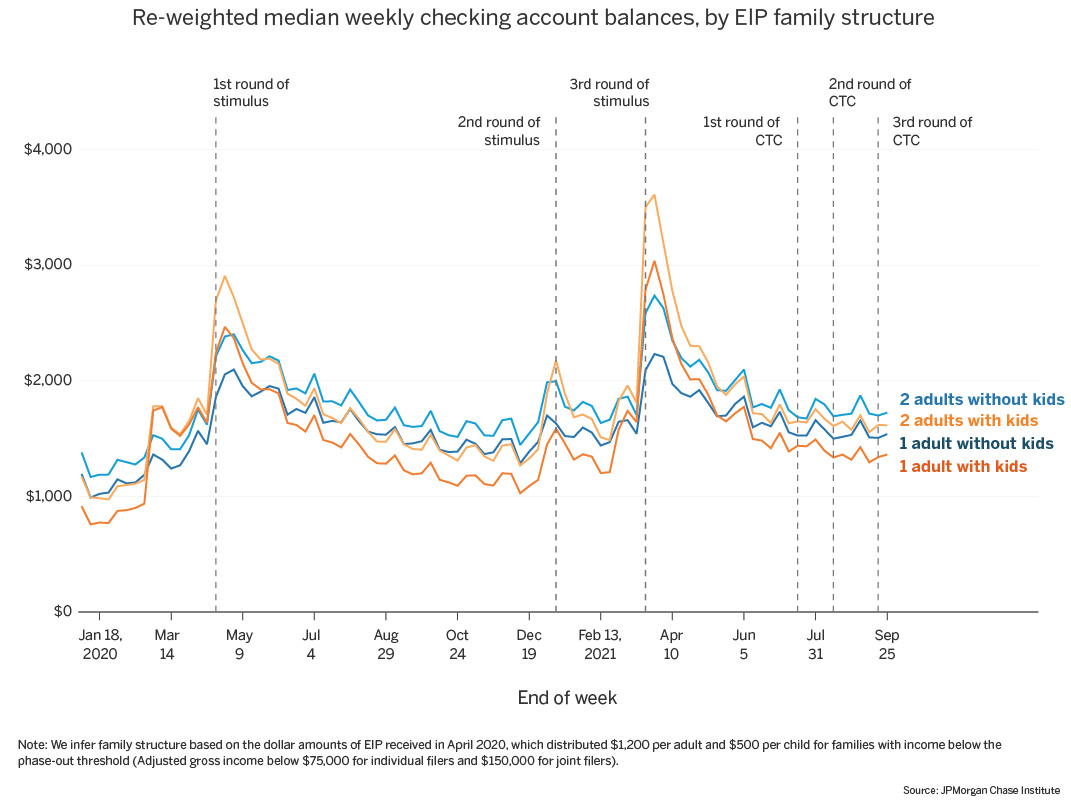
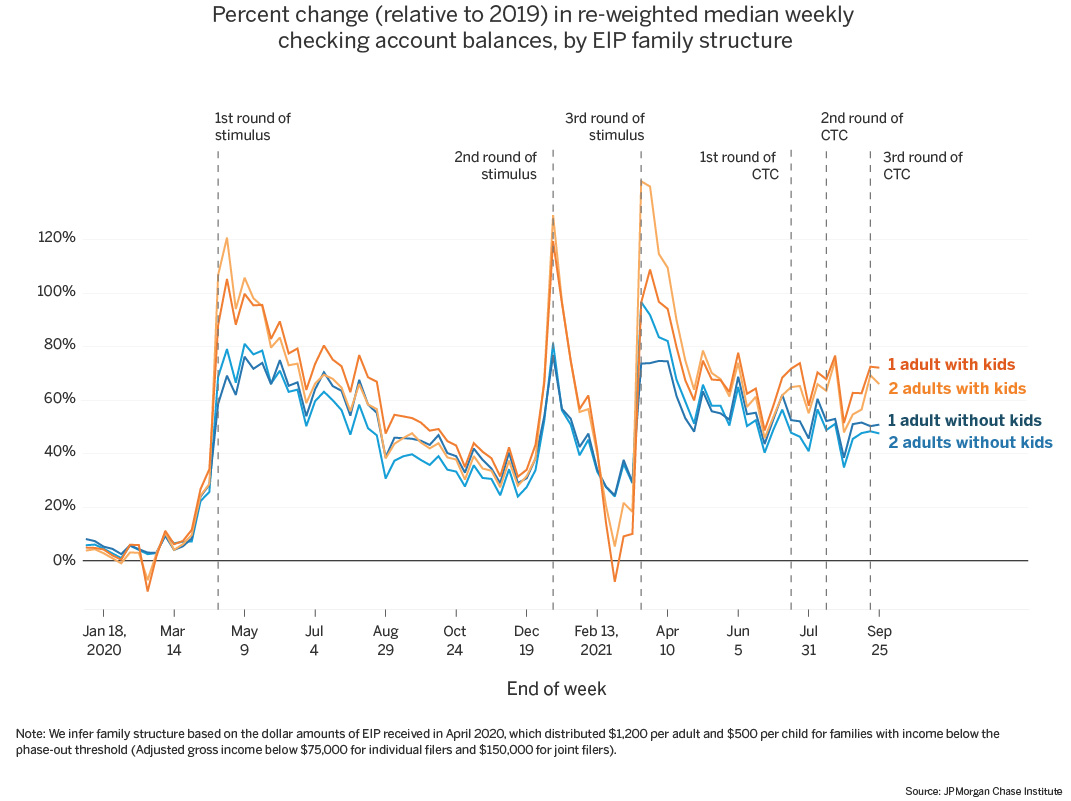
Finally, we note that comparisons between adults with and without dependent children are difficult, as families with children have different income and age profiles than those without. In particular, adults with children tend to have higher incomes and over-represent middle-aged adults (35-44 years) relative to adults with no children. To adjust for this, we re-weight our sample median calculations to account for differences in the joint age-income distributions across family structure groups. We provide unadjusted median balance series in the main body of this release, as they reflect aggregate trends. We present re-weighted median balance series in the Appendix. While re-weighting the medians impacts some of the balance level comparisons between families with and without children (Figures A1 and A3), differences in percent changes in balances (Figures A2 and A4) are largely similar to the unadjusted series, giving us confidence that our findings continue to hold after accounting for age and income differences.
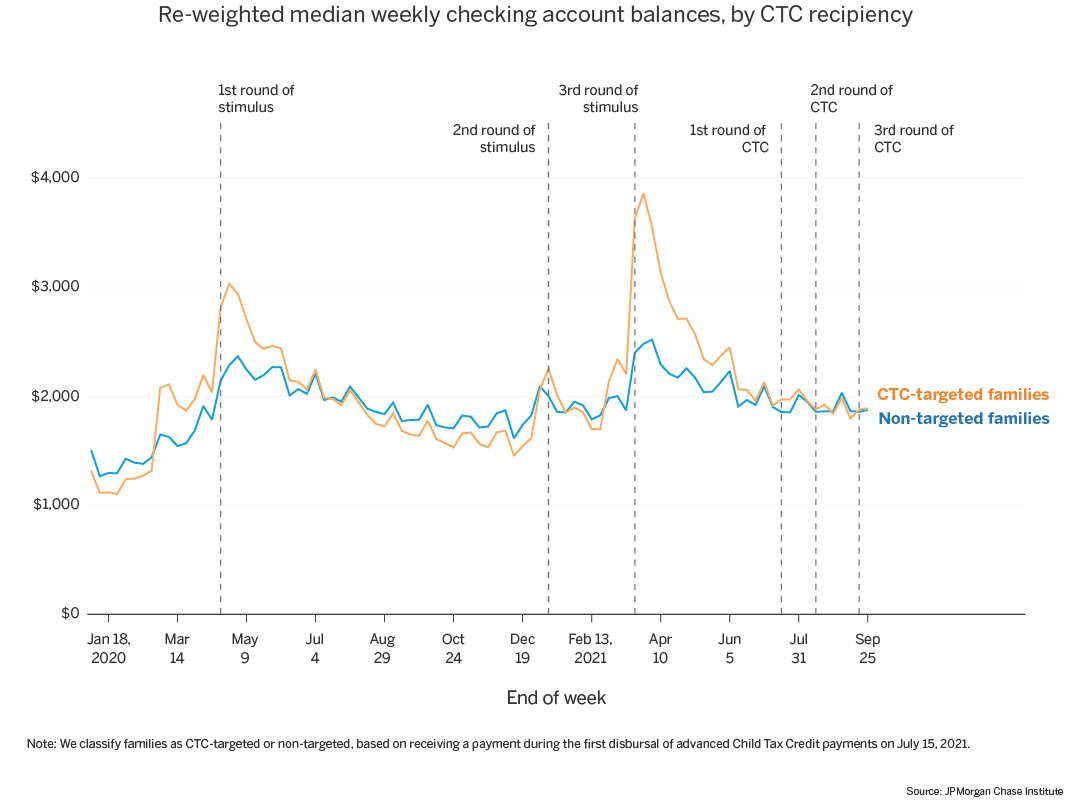
Relative to other families, those that have dependent children—as measured via both receipt of advanced Child Tax Credits (Figures 3 and 4) or stimulus payment amounts (Figures 5 and 6)—experienced larger bumps in checking account balances during each round of stimulus and also spent down their increased balances faster. Notably, in February 2021, single parents had fully depleted their balance boost from the second round of stimulus, a trend not seen in any other group analyzed to date (Figure 6). This may point to the importance of targeting government financial support towards families with kids during the pandemic and the greater financial vulnerability of single parents, in particular.
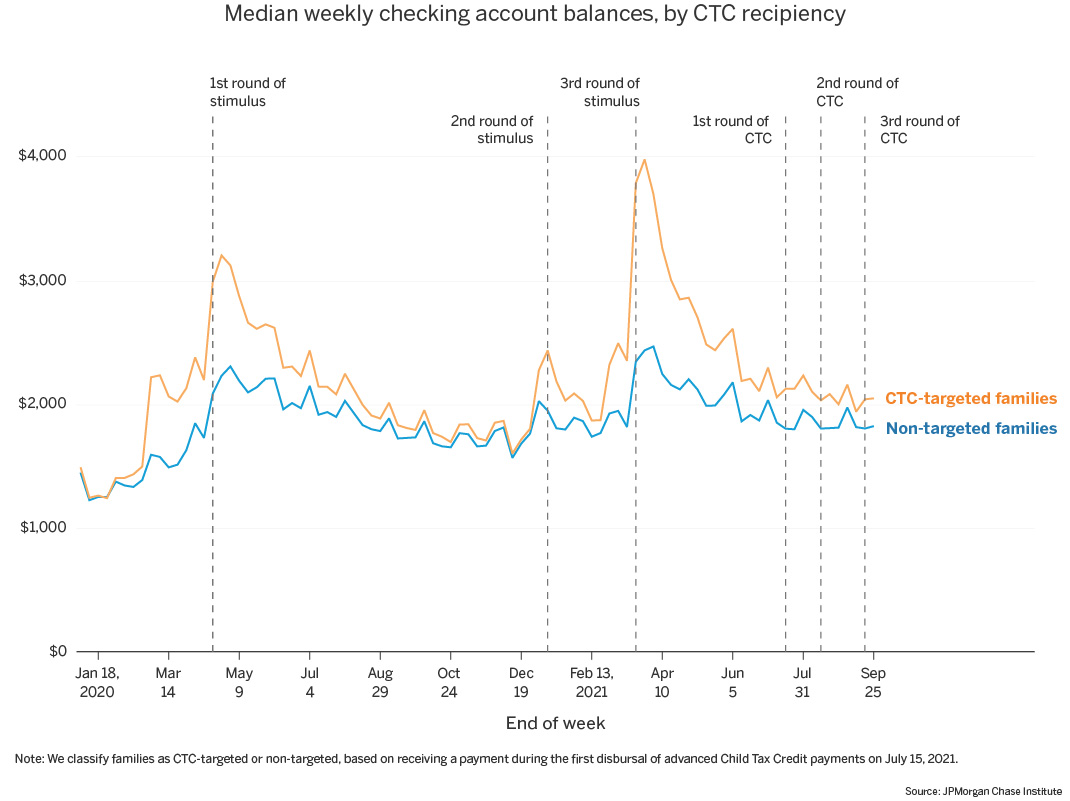
Figure 3: CTC-targeted families—those that later received CTC payments in July 2021—saw larger increases in cash balances with each round of stimulus, compared to non-targeted families.
Source: JPMorgan Chase Institute
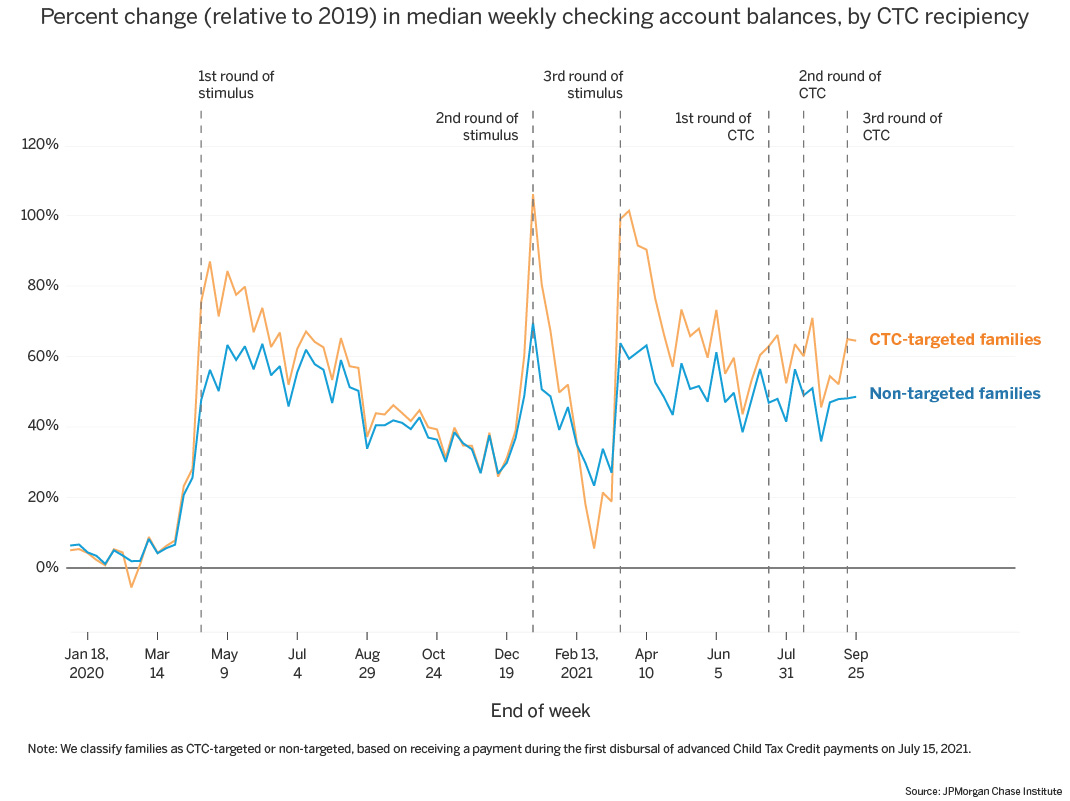
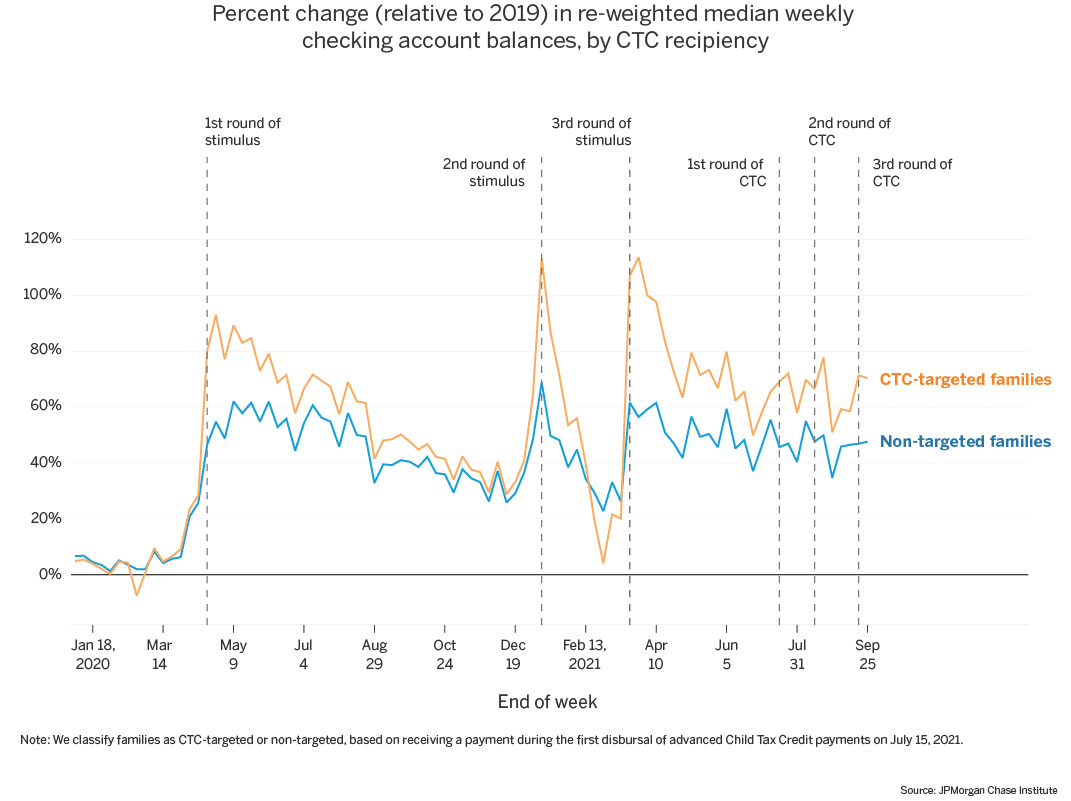
Figure 4: CTC-targeted families—those that later received CTC payments in July 2021—saw larger percent increases in balances with each round of stimulus, and spent down their increased balances faster than non-targeted families.
Source: JPMorgan Chase Institute.
In absolute dollar terms, given its smaller size and reach compared to stimulus payments, the advanced Child Tax Credits do not result in cash boosts as large as those seen with each round of stimulus. The magnitude of the payment per family is smaller for the advanced CTC than for any of the three rounds of stimulus. A family with two adults and two children under the age of 6 would receive up to $3,400 from the first round of stimulus (phased out for families with higher incomes); up to $2,400 from the second round; and up to $5,600 from the third round. In contrast, that same family would receive a maximum of $600 from each advanced CTC payment. Even when focusing on CTC-targeted families, we do not see a noticeable increase in median cash balances during the weeks of CTC payments on par with what we previously saw during the weeks of stimulus payments.
As noted above, following each round of stimulus, the percent-change boost in balances decreased faster for CTC-targeted families (those that later received CTC payments in July 2021) compared to non-targeted families. While that same pattern held in the weeks following the third stimulus payment in March 2021, data from July onward shows a slowing of that depletion for the targeted group, maintaining their absolute balance gains in parallel with non-targeted families (Figures 3 and 5).
Indeed, as of the end of September 2021, families with kids show a larger percent increase in balances than those without kids (Figures 4 and 6). Families who received advanced CTC in 2021 had balances in September that were 70 percent higher than two years prior, while families without kids had balances that were 50 percent higher (Figure 4). This divergence in balance trends between adults with and without kids becomes slightly more pronounced after we reweight the samples to account for age and income differences between the samples (Figures A2 and A4). In this sense, advanced CTC payments may be helping families with kids maintain elevated cash balances.
Figure 5: Families with kids—both single-adult and dual-adult families—had lower steady-state median checking account balances and experienced larger boosts in balances during each round of stimulus, and faster spend-down of those boosts, compared to families without kids.
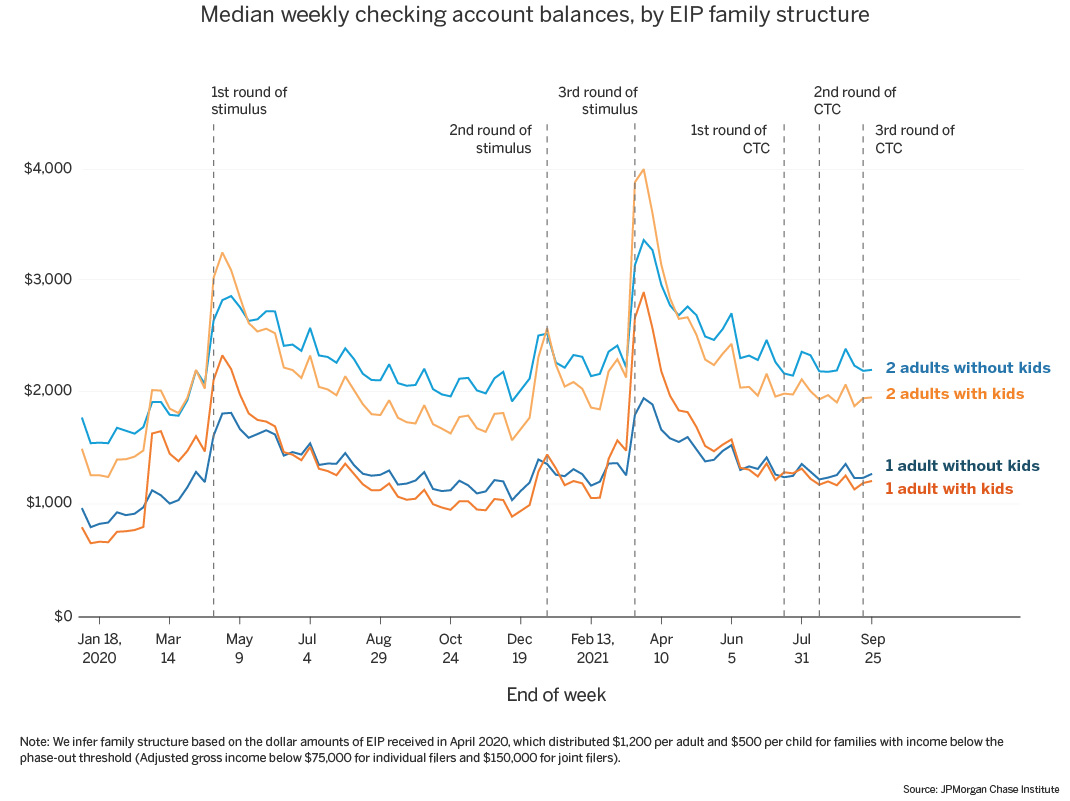
Source: JPMorgan Chase Institute
Figure 6: Families with kids experienced larger percent change increases following each round of stimulus payments, and spent down their increased balances from government support faster than families without kids.
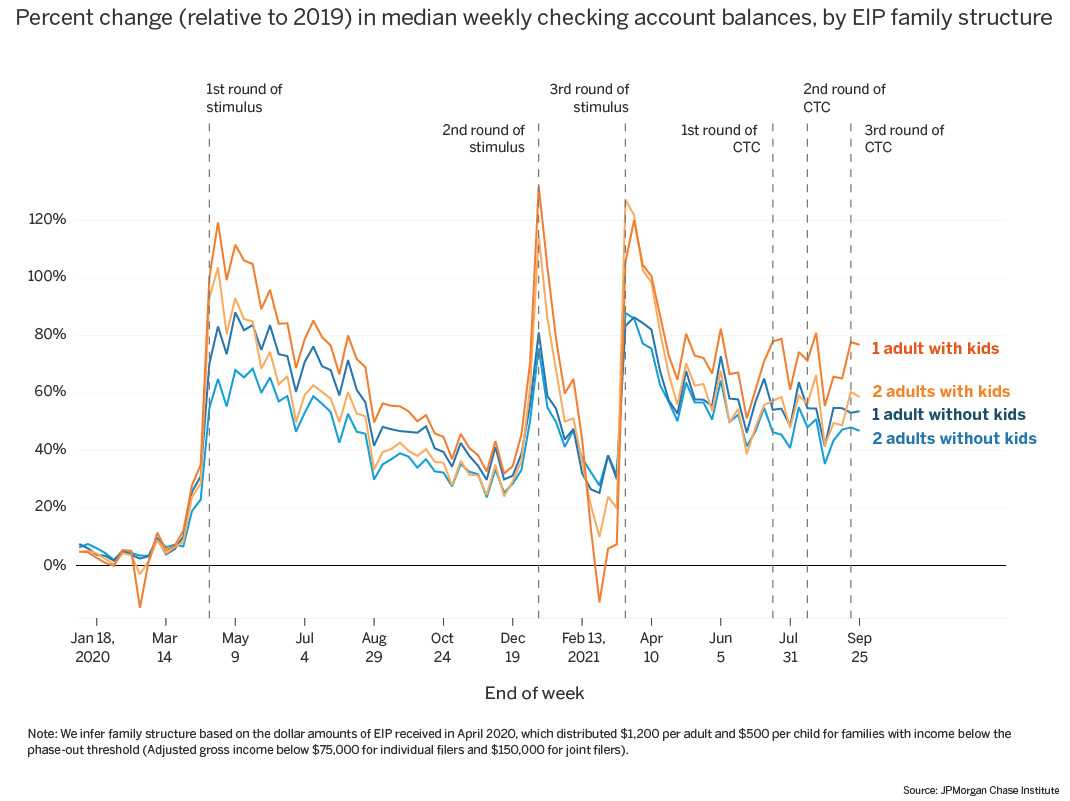
Source: JPMorgan Chase Institute
Figure A1
Source: JPMorgan Chase Institute
Figure A2
Source: JPMorgan Chase Institute
Figure A3
Source: JPMorgan Chase Institute
Figure A4
Source: JPMorgan Chase Institute
A second round of EIP was distributed in January 2021, providing up to $600 per eligible adult or child. The third round of stimulus was paid out beginning March 17, 2021, providing $1,400 per eligible adult or child.
https://www.whitehouse.gov/child-tax-credit/
https://www.forbes.com/sites/taxnotes/2021/07/26/extending-the-advance-child-tax-credit/?sh=4d6fd0635e29
The proportion due to measurement error should be relatively small. We filter our data to ensure regular, frequent use of the Chase checking accounts for each family in our sample.
Bureau of Labor Statistics. 2021. “Employment Situation Summary - 2021 M10 Results.” https://www.bls.gov/news.release/empsit.nr0.htm
Coombs, Kyle, Arindrajit Dube, Calvin Jahnke, Raymond Kluender, Suresh Naidu and Michael Stepner. 2021. “Early Withdrawal of Pandemic Unemployment Insurance: Effects on Earnings, Employment and Consumption of Low-Income Workers.” https://files.michaelstepner.com/pandemicUIexpiration-paper.pdf
Farrell, Diana, Fiona Greig, and Chenxi Yu. 2019. “Weathering Volatility 2.0: A Monthly Stress Test to Guide Savings.” JPMorgan Chase Institute.
Ganong, Peter, Damon Jones, Pascal Noel, Diana Farrell, Fiona Greig, and Chris Wheat, 2020. “Wealth, Race, and Consumption Smoothing of Typical Income Shocks.” University of Chicago, National Bureau of Economic Research, and JPMorgan Chase Institute. http://nber.org/system/files/working_papers/w27552/w27552.pdf
Greig, Fiona, and Erica Deadman. 2021. “Financial outcomes by race during COVID-19.” JPMorgan Chase Institute.
Greig, Fiona, Erica Deadman and Pascal Noel. 2021. “Family Cash Balances, Income, and Expenditures Trends Through 2021: A Distributional Perspective.” JPMorgan Chase Institute.
Leonhardt, David. “Where Are the Workers? How can so many Americans afford not to work? And will it last?” New York Times, October 20, 2021.
We thank our research team, specifically Francesca Guiso, for her hard work and contribution to this research. Additionally, we thank Sarah Kuehl, Stephen Harrington, Anthony Rivera, Emily Rapp, and Robert Caldwell for their support. We are indebted to our internal partners and colleagues, who support delivery of our agenda in a myriad of ways, and acknowledge their contributions to each and all releases.
We are also grateful for the invaluable constructive feedback we received from external experts and partners. We are deeply grateful for their generosity of time, insight, and support.
We would like to acknowledge Jamie Dimon, CEO of JPMorgan Chase & Co., for his vision and leadership in establishing the Institute and enabling the ongoing research agenda. We remain deeply grateful to Peter Scher, Vice Chairman, Demetrios Marantis, Head of Corporate Responsibility, Heather Higginbottom, Head of Research & Policy, and others across the firm for the resources and support to pioneer a new approach to contribute to global economic analysis and insight.
This material is a product of JPMorgan Chase Institute and is provided to you solely for general information purposes. Unless otherwise specifically stated, any views or opinions expressed herein are solely those of the authors listed and may differ from the views and opinions expressed by J.P. Morgan Securities LLC (JPMS) Research Department or other departments or divisions of JPMorgan Chase & Co. or its affiliates. This material is not a product of the Research Department of JPMS. Information has been obtained from sources believed to be reliable, but JPMorgan Chase & Co. or its affiliates and/or subsidiaries (collectively J.P. Morgan) do not warrant its completeness or accuracy. Opinions and estimates constitute our judgment as of the date of this material and are subject to change without notice. The data relied on for this report are based on past transactions and may not be indicative of future results. The opinion herein should not be construed as an individual recommendation for any particular client and is not intended as recommendations of particular securities, financial instruments, or strategies for a particular client. This material does not constitute a solicitation or offer in any jurisdiction where such a solicitation is unlawful.
Greig, Fiona, Erica Deadman, and Tanya Sonthalia. 2021. “Household Cash Balance Pulse: Family Edition.” JPMorgan Chase Institute.
Authors

Fiona Greig
Former Co-President

Erica Deadman
Consumer Research Lead, JPMorganChase Institute

Tanya Sonthalia
Research Associate