The rise in inflation since mid-2021 to multi-decade highs presents a worrying trend for households’ financial health, particularly if nominal incomes, or non-inflation adjusted income, of financially vulnerable families lag behind prices. Policymakers have noted that lower income households are more vulnerable to increases in consumer prices given their higher share of spending on necessities.1 While elevated cash balances during COVID have provided a cushion for spending, savings stockpiles have declined from their peaks, implying sustained consumption at recent levels will soon require higher real incomes or further liquidity drawdowns.2 This raises important questions as to how households have been coping. Have nominal incomes kept pace with inflation to allow households to maintain their purchasing power? What types of households are doing better or worse?

We use de-identified data covering 10 million households’ account inflows to answer these questions—tracing the trajectory of income growth, adjusting for changes in the price level, over the period since the pandemic began. We build on prior Institute reports that looked at income growth over the business cycle and during COVID, highlighting differences across the income spectrum and racial groups.3 We also track incomes both including and excluding Unemployment Insurance (UI) and Economic Impact Payments (EIP) to highlight the role of government programs in supporting incomes during the pandemic.

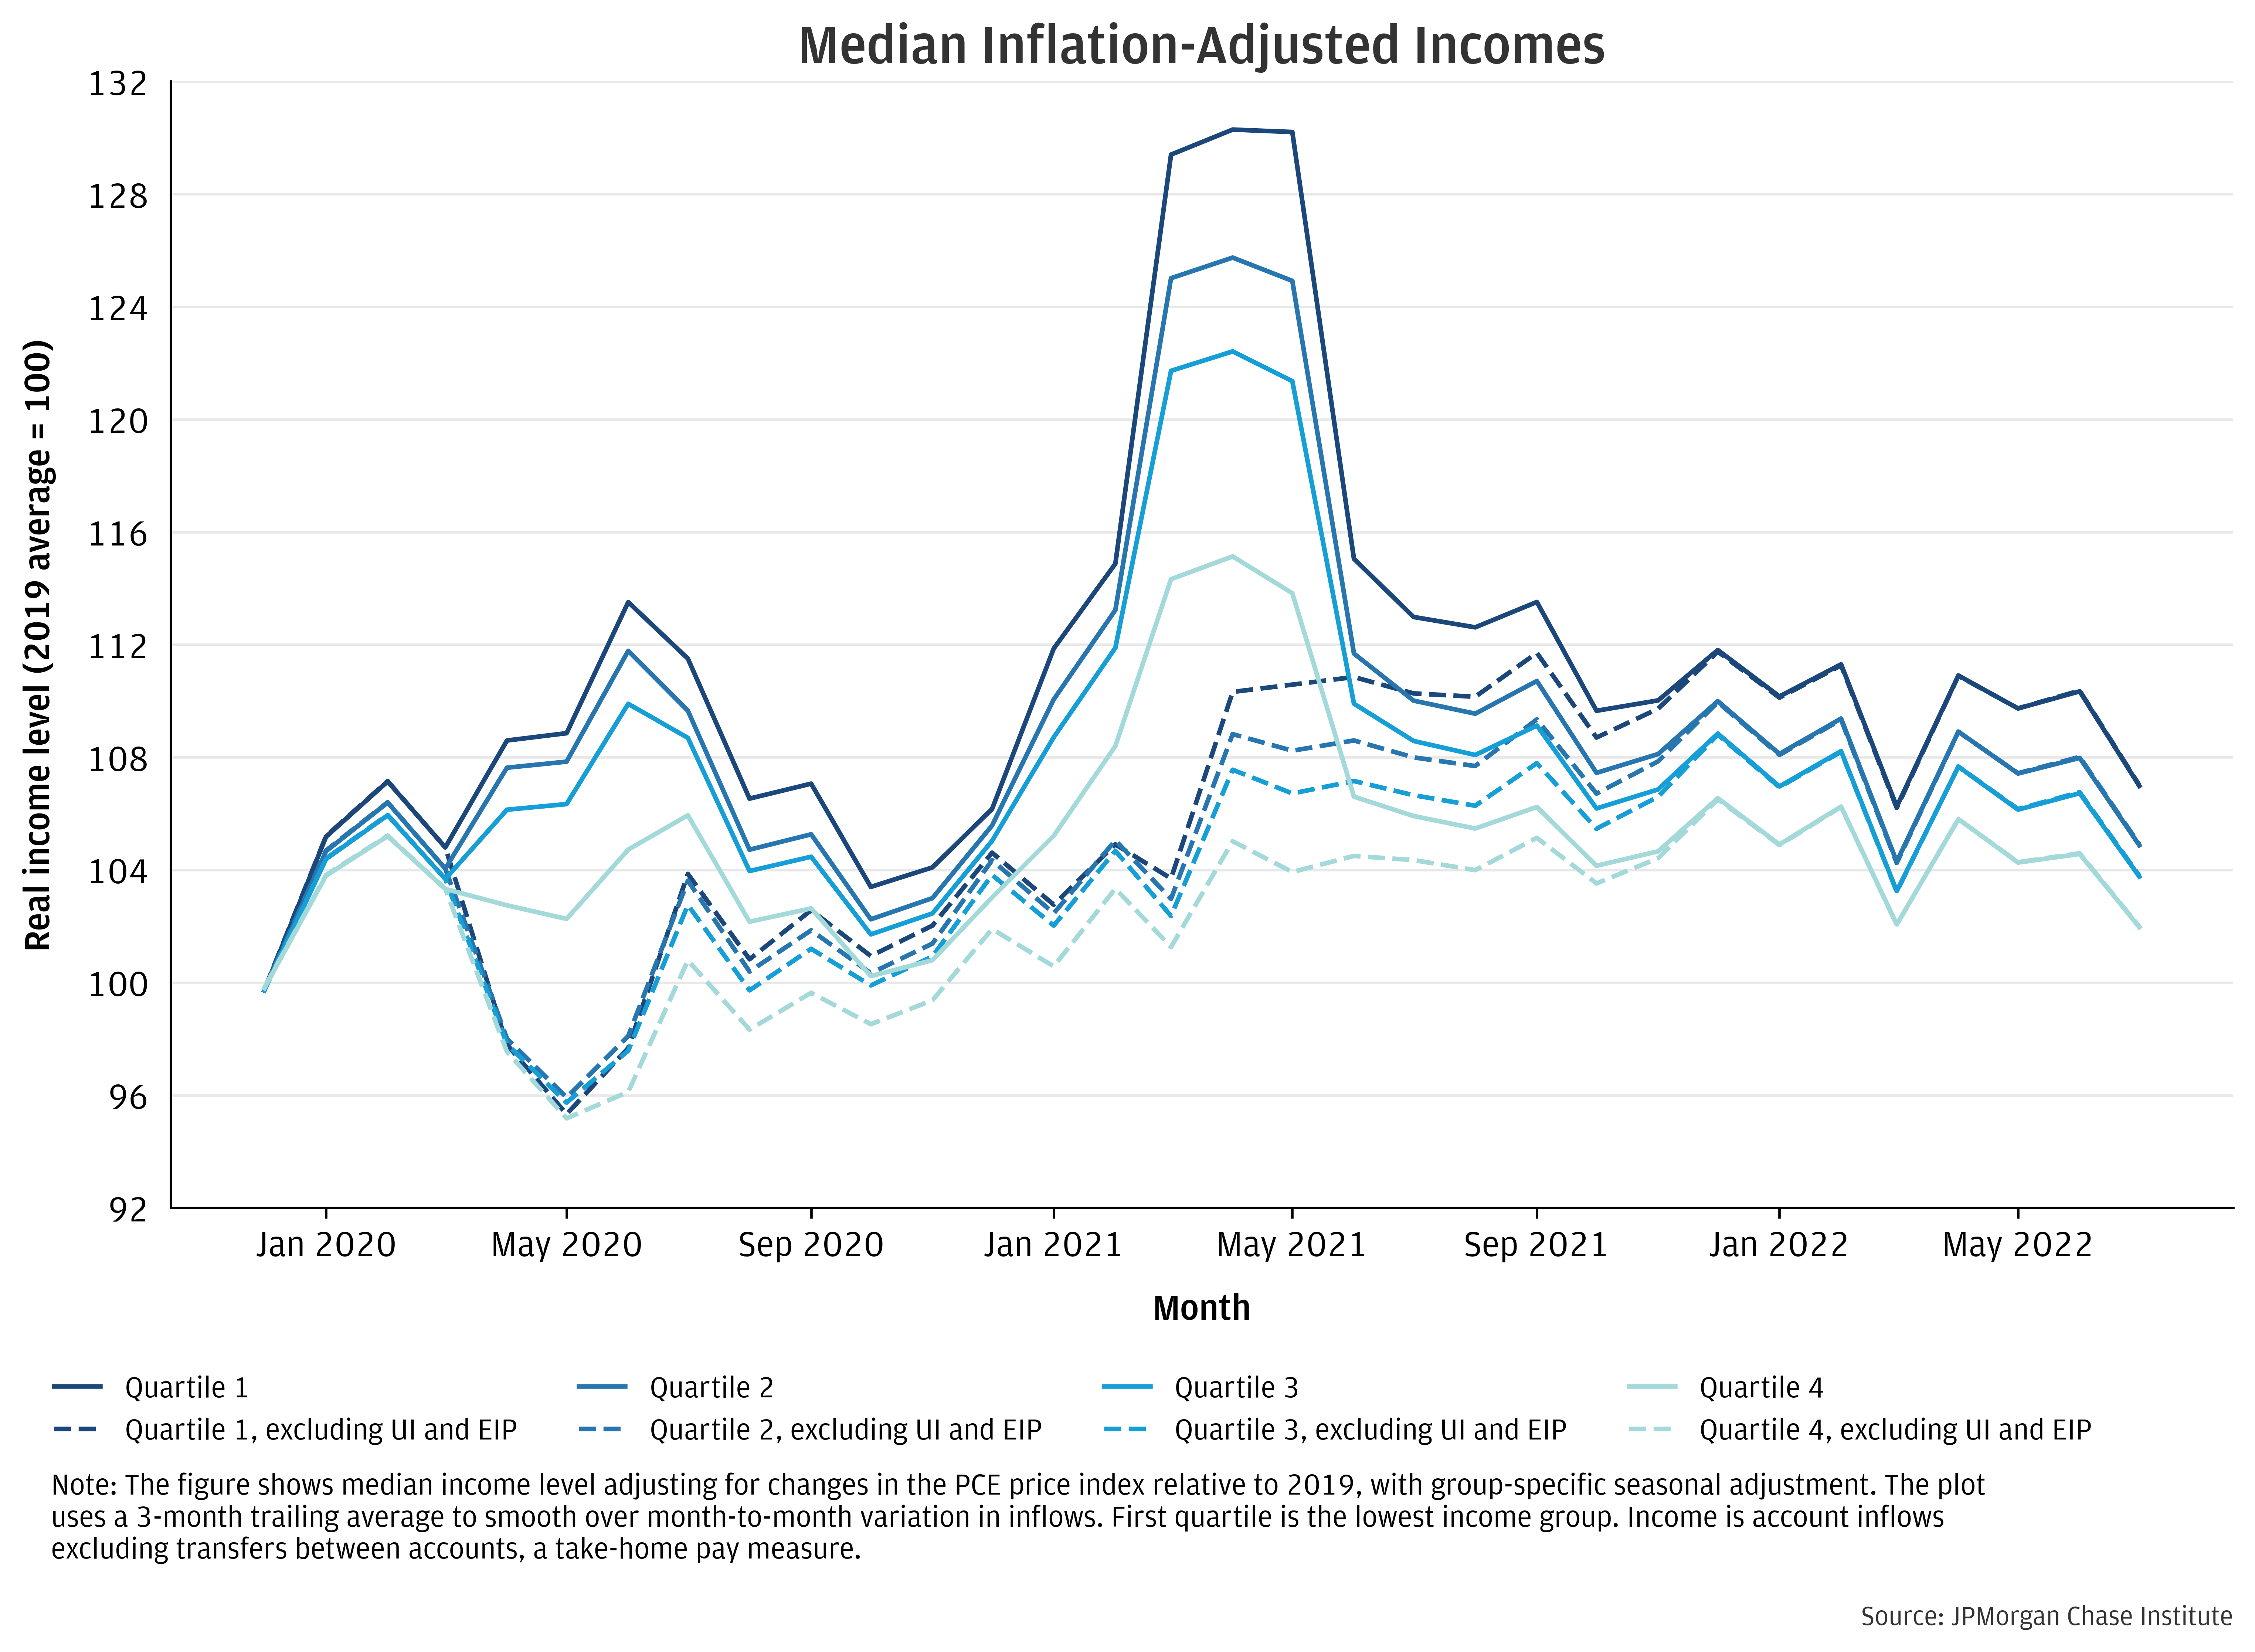
Figure 1 below shows how median real incomes have evolved across income groups from January 2020 through July 2022, measuring each person’s inflation-adjusted income relative to their 2019 average.4 We normalize the data by removing a group- and month-specific effect, using seasonality observed in 2018 and 2019. All income quartiles have higher real incomes in 2022 than in 2019. Individuals in the lowest income quartile—based on average incomes in their ZIP code5—have experienced the largest relative gains, comparing 2022 earnings to 2019. However, the trend in real incomes since 2021 have been modestly downward across income groups, as elevated inflation reduced purchasing power. Moreover, growth in earnings implied here is biased upward relative to economy-wide aggregates, because of individuals’ aging over the sample window (see Box for details).

Figure 1: The majority of households’ real incomes were higher as of mid-2022 than in 2019—with lower-income households experiencing larger gains—but purchasing power of incomes stagnated last year and was deteriorating as of mid-2022 for all income quartiles.

The majority of households’ real incomes were higher as of mid-2022 than in 2019—with lower-income households experiencing larger gains—but purchasing power of incomes stagnated last year and was deteriorating as of mid-2022 for all income quartiles.

Source: JPMorgan Chase Institute

A time series of median real income levels from 2020 through July 2022, measured relative to their 2019 average. The figure shows income paths broken down by income quartile and shows separate time series for total take-home income (Solid Series) and take-home income after excluding Unemployment Insurance and Economic Impact Payments (Dotted Series). Income paths as shown in the Solid Series were initially aligned with the Dotted Series, with the lowest income quartile increasing from 100 to about 107 and the highest quartile rising from 100 to 105 as of February 2020. Subsequently the Dotted Series fell to about 95 while the Solid Series moved higher and showed differentiation by income group, with the lowest income group rising to almost 115 and the higher remaining around 103 as of mid-2020. The Dotted Series then steadily rose until about May 2021, when real income growth stagnated. The Solid Time series was more volatile rising sharply to almost 130 for the lowest income quartile and 115 for the highest quartile as of April 2021. The Solid Series then fell and approximately realigned with the Dotted Series, as the temporary boosts to incomes through UI and EIP payments stopped. The trend in both series was slightly negative from late 2021 to July 2022, and there was a dip in both in February 2022 on the order of about 4 percentage points, which was approximately recovered in March. 

Considering the effect of aging in our balanced sample, the improvement in real earnings as of mid-2022 relative to the year prior to the pandemic is consistent with a tepid economic growth rate.6 For the first income quartile, the median level of real earnings was 7 percent higher in the 3 months ending with July 2022 compared with 2019, seasonally adjusted, a three-year interval. Assuming a 2 percent per year lifecycle effect, this figure is roughly in-line with an annual economic growth rate of under 1 percent.7 The highest income quartile has experienced real income growth consistent with an economic contraction.

Comparing Individual-Based Growth Data to National Aggregates

Publicly available data, like national accounts data, often measure aggregate incomes. But national totals may not accurately track the experience of typical households (as they overweight high earners) and do not provide demographic breakdowns. Additionally, the high degree of labor market volatility since 2020—including shifts between employment and unemployment (or leaving the labor force entirely) as well as across jobs—have made it even more difficult to track people’s lived experience using aggregate or industry-specific data. The sample used for this analysis allows us to follow a proxy for earnings at the person-level, albeit with noise inherent in administrative data even with a sample of millions of individuals.

Since this analysis tracks individuals over time, the aging of households over the period of analysis biases upward the trajectory of real earnings shown in Figure 1 relative to personal income aggregates in government statistics. Historically, people’s incomes tend to rise as they get older—irrespective of economy-wide economic growth. Academic research (see footnote 7) using decades of data from the Social Security Administration put this life cycle earnings effect at approximately 2 percentage points per year for 40-year-olds (close to the average age in our sample).

Income growth for households in the first quartile experienced the sharpest swings over our sample window. The bulk of the divergence between income groups coincided with the onset of UI supplements and EIP payments, which had their largest impact on incomes from March 2020 to April 2021. The third and last EIP disbursal was in April 2021, and bolstered UI coverage largely expired by September 2021, shortly after which the unemployment rate closed in on pre-pandemic levels. Child Tax Credit payments, disbursed between July and December 2021, also provided temporary support to income, with a greater percentage impact on lower income families. These relative trends paralleled movements in cash balances, as described in the Institute’s latest Household Pulse report. Cash balances rose most—and are still highest relative to 2019 levels, in percentage terms—for those with lower incomes. However, cash balances trends are reverting to more normal levels, alongside the flattening in real inflows for all groups.8

Income growth outcomes by race, shown in Figure 2, have ordinally tracked those seen in income level quartiles. In relative terms, real incomes for Black and Hispanic households grew more from 2019 to mid-2022 than the real incomes of White and Asian families. However—mirroring trends seen in Figure 1—all racial groups were seeing modest losses in purchasing power as of July 2022.

Figure 2: Black and Hispanic individuals experienced the greatest real gains compared to 2019, but relative gains have not progressed over the past year.

Figure 2: Black and Hispanic individuals experienced the greatest real gains compared to 2019, but relative gains have not progressed over the past year.

Source: JPMorgan Chase Institute

A time series of median real income levels from 2020 through July 2022, measured relative to their 2019 average. The figure shows income paths broken down by races—Asian, Black, Hispanic, and White—and shows separate time series for total take-home income (Solid Series) and take-home income after excluding Unemployment Insurance and Economic Impact Payments (Dotted Series). Income paths as shown in the Solid Series were initially aligned with the Dotted Series, with Black individuals increasing from 100 to about 106, Hispanic to 105, White to 104, and Asian to 103 as of February 2020. Subsequently the Dotted Series fell to about 95 while the Solid Series moved higher and showed differentiation by race. Black individuals’ Solid Series rose the highest, to almost 115. The Dotted Series then steadily rose until about May 2021, for all groups when real income growth stagnated. The Solid Time series was more volatile, rising sharply to almost 125 for Black Individuals down to 110 for Asian individuals as of April 2021. The Solid Series then fell and approximately realigned with the Dotted Series, as the temporary boosts to incomes through UI and EIP payments stopped. The trend in both series was slightly negative from late 2021 to July 2022, and there was a dip in both in February 2022 on the order of about 4 percentage points, which was approximately recovered in March. Income trends for all race/ethnicity groups were approximately parallel for both series since late 20221. 

Conclusion

Through the lens of take-home earnings, U.S. households experienced a modest rise in purchasing power as of mid-2022 relative to 2019, despite the high rate of inflation. Households with lower incomes and Black and Hispanic individuals have experienced the highest growth as of 2022 relative to the year preceding the pandemic. However, over the 12 months ending July 2022, all income and racial groups were experiencing approximately the same weak growth. This more recent performance represents a neutralization of the positive trends seen over 2016 to 2019—the late stages of the long pre-COVID economic expansion—when low unemployment and stable prices supported (modest) income convergence across income groups and racial lines. The U.S. labor market remains extremely tight but distributional outcomes have not sustained progress. Moreover, the return of liquid balances towards their historic averages suggests that the improvement seen in financial health may be unwinding amid the sharp rise in consumer prices.

References

1.

See, for example, Federal Reserve Board Governor Lael Brainard’s September 2022 speech “Bringing Inflation Down."

2.

Institute research shows that cash balances peaked in April 2021 after the last round of Economic Impact Payments and were either flat or declining as of mid-2022, even in nominal terms. Consistent with this trend, the aggregate personal savings rate (FRED ticker: PSAVERT) had declined to 3.5 percent as of August 2022, well below 2019 level of about 9 percent. 

3.

Self-identified demographic data was obtained in 2021 from a third party for the JPMorgan Chase Institute to conduct economic research examining financial outcomes by race, ethnicity, and gender. The demographic data was matched to internal banking records using encrypted quasi-identifiers. This de-identified file that contains banking records and demographics is only available to the JPMorgan Chase Institute. Race information was available for approximately 1.4 million individuals out of the 10 million that make up the overall sample for this report. 

4.

We use the price index for personal consumption expenditures (FRED ticker: PCEPI) to deflate earnings. 

5.

We group households by ZIP Code average per-person income, computed from IRS Statistics of Income, instead of using household-level income observed in our data. This grouping method reduces the potential for noise or volatility in our data to introduce bias in growth rates by income tier; for example, if a typically high-income household experiences a temporary interruption in observed inflows (which can occur if an individual operates multiple checking accounts), we could erroneously categorize them as low-income and later over-estimate income growth.

6.

The range of estimates for the longer-run level of potential GDP growth among Federal Reserve policymakers as of the September FOMC ranged from 1.6 to 2.2 percent. (Link

7.

This lifecycle growth estimate is based on data underlying Figure C36 Lifecycle Profile of Average Log Earnings from Guvenen, Karahan, Ozkan, and Song (2021) for a 40-year old.

8.

Standard economic consumption theory would predict a gradual decline in ‘excess’ savings stockpiles, given a return of income to a steady trend. Similarly—assuming no change in liquidity preferences or perceptions of risk—theory of households’ wealth management suggests that cash balances (particularly measured relative to spending needs) should return to more normal levels, either through higher spending or transfers to higher expected return investments.

Acknowledgements

We thank our research team, especially Melissa O’Brien, Edward Biggs, Karmen Hutchinson, Guillaume Kasten-Sportes, and Khushboo Chougule, for their contributions to the analysis. We also thank Annabel Jouard, Robert Caldwell, and Preeti Vaidya for their support. We are indebted to our internal partners and colleagues, who support delivery of our agenda in a myriad of ways and acknowledge their contributions to each and all releases.

We would like to acknowledge Jamie Dimon, CEO of JPMorgan Chase & Co., for his vision and leadership in establishing the Institute and enabling the ongoing research agenda. We remain deeply grateful to Peter Scher, Vice Chairman, Demetrios Marantis, Head of Corporate Responsibility, Heather Higginbottom, Head of Research & Policy, and others across the firm for the resources and support to pioneer a new approach to contribute to global economic analysis and insight.

Disclaimer

This material is a product of JPMorgan Chase Institute and is provided to you solely for general information purposes. Unless otherwise specifically stated, any views or opinions expressed herein are solely those of the authors listed and may differ from the views and opinions expressed by J.P. Morgan Securities LLC (JPMS) Research Department or other departments or divisions of JPMorgan Chase & Co. or its affiliates. This material is not a product of the Research Department of JPMS. Information has been obtained from sources believed to be reliable, but JPMorgan Chase & Co. or its affiliates and/or subsidiaries (collectively J.P. Morgan) do not warrant its completeness or accuracy. Opinions and estimates constitute our judgment as of the date of this material and are subject to change without notice. No representation or warranty should be made with regard to any computations, graphs, tables, diagrams or commentary in this material, which is provided for illustration/reference purposes only. The data relied on for this report are based on past transactions and may not be indicative of future results. J.P. Morgan assumes no duty to update any information in this material in the event that such information changes. The opinion herein should not be construed as an individual recommendation for any particular client and is not intended as advice or recommendations of particular securities, financial instruments, or strategies for a particular client. This material does not constitute a solicitation or offer in any jurisdiction where such a solicitation is unlawful.

Suggested Citation

Wheat, Chris, and George Eckerd. 2022. “The Purchasing Power of Household Incomes from 2019 to 2022.” JPMorgan Chase Institute. https://www.jpmorganchase.com/insights/all-topics/financial-health-wealth-creation/household-purchasing-power-2019-to-2022

Authors

Chris Wheat

President, JPMorganChase Institute

George Eckerd

Financial Markets Research Lead