Racial, ethnic, and foreign-born composition
To understand the differences in small business outcomes between communities with different racial and ethnic compositions, we first looked at the share of firms across eight industries in majority White, Black, Hispanic, and “all other” communities as estimated in the 2011 5-year ACS.4 As previously discussed, 31 percent of the Miami metro area communities were majority White, 30 percent were majority Hispanic, and 9 percent were majority Black. The remaining 28 percent of communities did not have a single racial or ethnic group that accounted for a majority of their populations. Additionally, in nearly 20 percent of communities, the majority of the population was foreign-born. Communities are identified as “majority foreign-born” and by race or ethnicity. All but five “majority foreign-born” communities are also majority Hispanic.
Table 3: Small business industry shares by resident race, ethnicity, or foreign-born status
| |
High-tech services |
Health care services |
Other professional services |
Real estate |
Construction |
Repair & maintenance |
Restaurants |
Retail |
| Majority White |
3.7% |
8.4% |
20.7% |
15.1% |
14.3% |
10.1% |
3.4% |
9.8% |
| Majority Black |
1.6% |
5.7% |
13.8% |
8.1% |
20.1% |
16.4% |
4.6% |
14.4% |
| Majority Hispanic |
2.7% |
8.8% |
17.3% |
11.0% |
17.8% |
11.9% |
3.7% |
10.5% |
| All other communities |
3.1% |
6.9% |
17.9% |
13.4% |
16.7% |
12.5% |
4.1% |
10.5% |
| Majority foreign-born |
2.5% |
9.3% |
17.3% |
11.8% |
17.2% |
10.9% |
4.0% |
10.7% |
| Metro Miami |
3.0% |
7.9% |
18.1% |
12.5% |
16.8% |
11.9% |
3.8% |
10.6% |
Cells marked indicate that the share of small businesses in an industry for the community type is higher than the share of small businesses in an industry in the Miami metro area.
Source: JPMorgan Chase Institute
In Table 3, we classify communities as majority White, Black, Hispanic, or “all other.” These racial or ethnic groupings are mutually exclusive. We then identify communities where a majority of its residents are foreign born. A community is categorized by racial/ethnic group and by the share of residents who are foreign born. Thirty-five communities in Miami had a majority foreign-born population, of which thirty were majority Hispanic, two were majority Black communities, and three were categorized as "all other communities."
In general, most communities in Miami had a very low share of restaurants and high-tech services firms and a high share of either professional services or construction firms. Although more than one-in-seven firms in majority Black communities were professional service businesses, majority Black communities had the lowest share of these firms. Similarly, majority White communities had the smallest share of construction firms, but more than one-in-seven firms in these communities were construction businesses.
Cells with blue diamonds in Table 3 indicate that the share of firms in an industry for a given community type was above the Miami metro share of firms in that industry. Industries that were more prevalent in majority White communities (high-tech services, other professional services, and real estate) were less prevalent in non-White communities. Communities with a majority maintenance industries. Firms in each of these industries were among the most overrepresented in majority Black communities when compared to the metro-wide share. For example, the share of construction and repair & maintenance firms in majority Black communities were 3.3 and 4.5 percentage points higher than the metro share, respectively.
Majority foreign-born and majority Hispanic communities are very similar. Of the thirty-five majority foreign-born communities, thirty were also categorized as majority Hispanic. Since, for this analysis, we do not treat the demographics of a community as a continuous variable it could be expected that majority Hispanic and majority foreign-born communities contained similar industries in metro Miami. This might suggest that the slight differences in industry between these communities (e.g. health care services and repair & maintenance) are related to community demographics. Further research could provide information on the types of firms likely to operate in immigrant communities compared to majority native-born communities.
Small business outcomes by racial, ethnic, and foreign-born composition
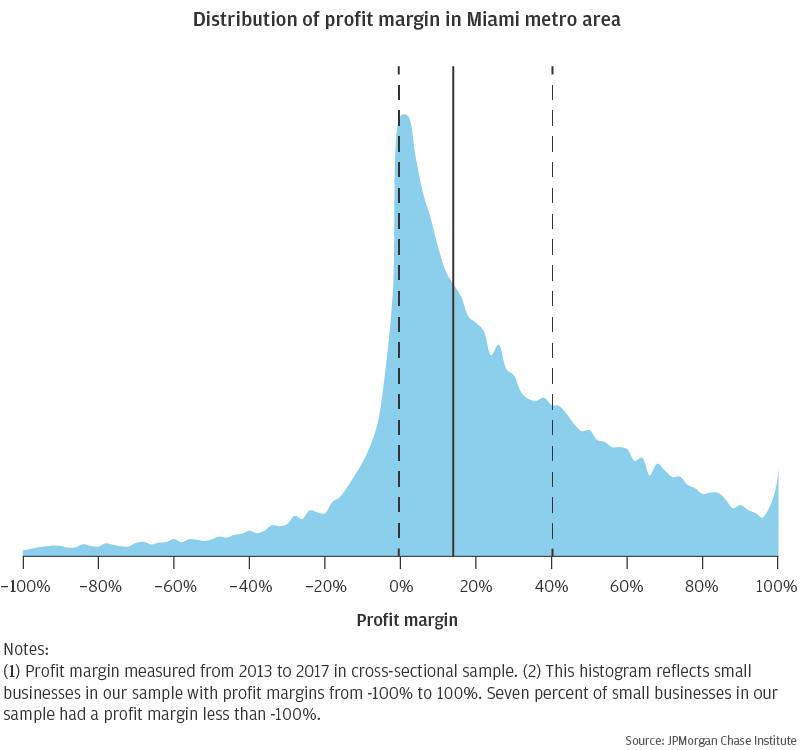
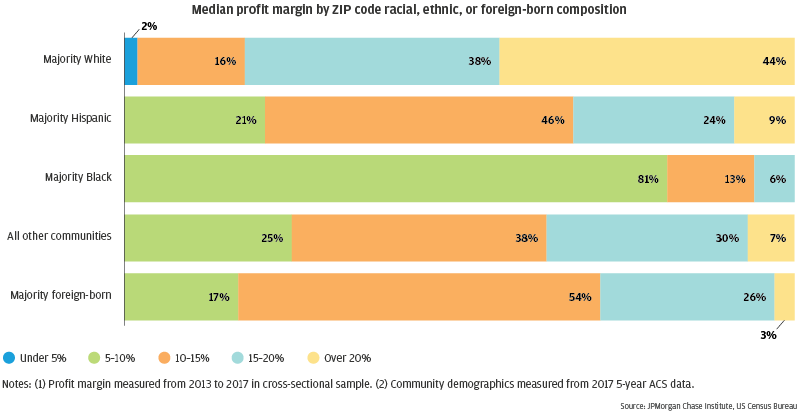
Figure 9 shows median small business profit margins for communities grouped by racial, ethnic, and foreign-born composition. Notably, 44 percent of majority White communities had median small business profit margins greater than 20 percent, while no more than 9 percent of any other community racial, ethnic, and foreign-born demographic group had median profits at that high of a level. Most majority foreign-born communities also had a population that was mostly Hispanic, which may help explain the similar profitability outcomes for these two types of communities—about one-in-three of each of these types of communities had a median profit margin over 15 percent. In contrast, only about one-in-twenty majority Black communities in Miami had a median profit margin over 15 percent, and the median profit margin in four-in-five such communities was 10 percent or less.
