

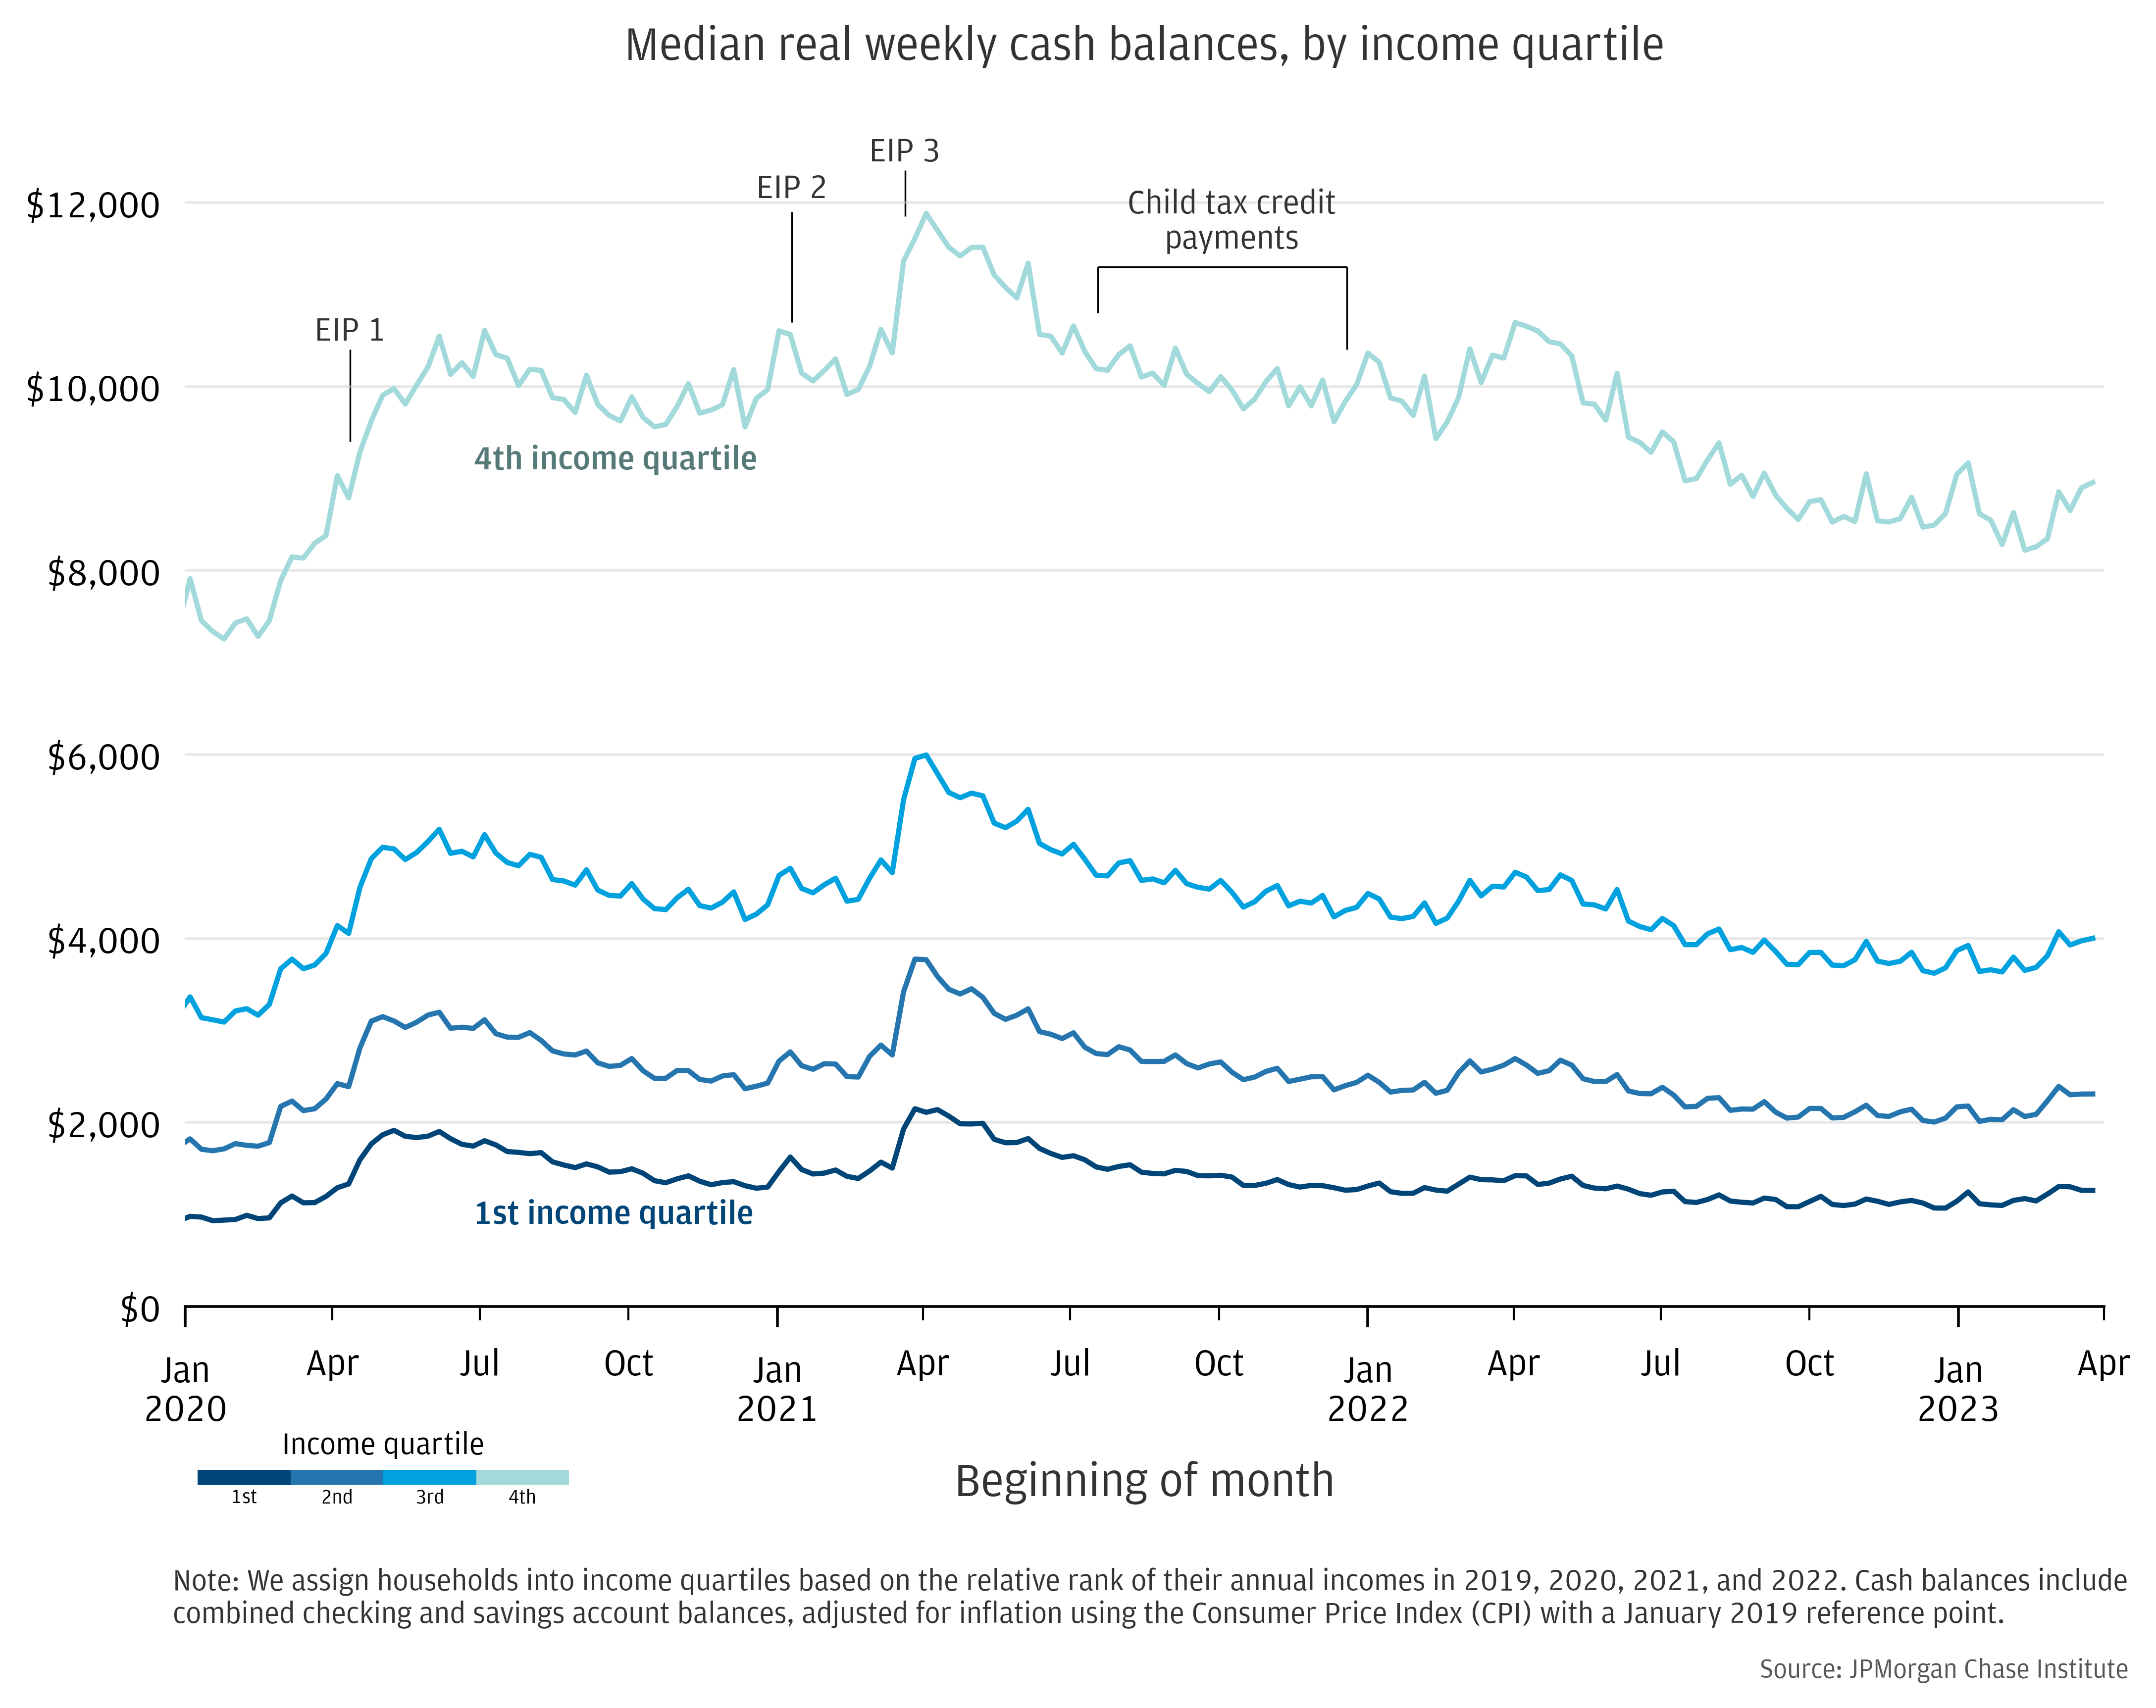
Figure 1: Across the income distribution, median cash balances declined steadily during the second half of 2022, with slight increases in March 2023 during tax season.
Source: JPMorgan Chase Institute
Latest news

An Ohio-based company is protecting first responders around the world
With support from JPMorganChase, Fire-Dex is providing protective equipment to firefighters in 100 countries and all 50 states.
Learn moreLatest news

Veteran’s Unconventional Path to Landing her Dream Job in Tech
U.S. Army Veteran Ashley Wigfall transitioned to a civilian role and charted her path to technologist through mentorship and skills training at the JPMorgan Chase tech hub in Plano, Texas.
Learn more
Findings
Following the unprecedented economic impact and significant fiscal policy response prompted by the COVID-19 pandemic, soaring inflation continues to impact consumer finances.1 This release of the Household Pulse leverages de-identified administrative banking data to examine the path of household cash balances from January 2020 through March 2023 for roughly 9 million Chase customers.2 In addition to comparing cash balance trends across the income distribution, we also show balances by race and ethnicity for the first time in this series. Moreover, we attempt to further quantify and address three key considerations outlined in previous Pulse reports to put our measures of cash balances into perspective with other household finance metrics.
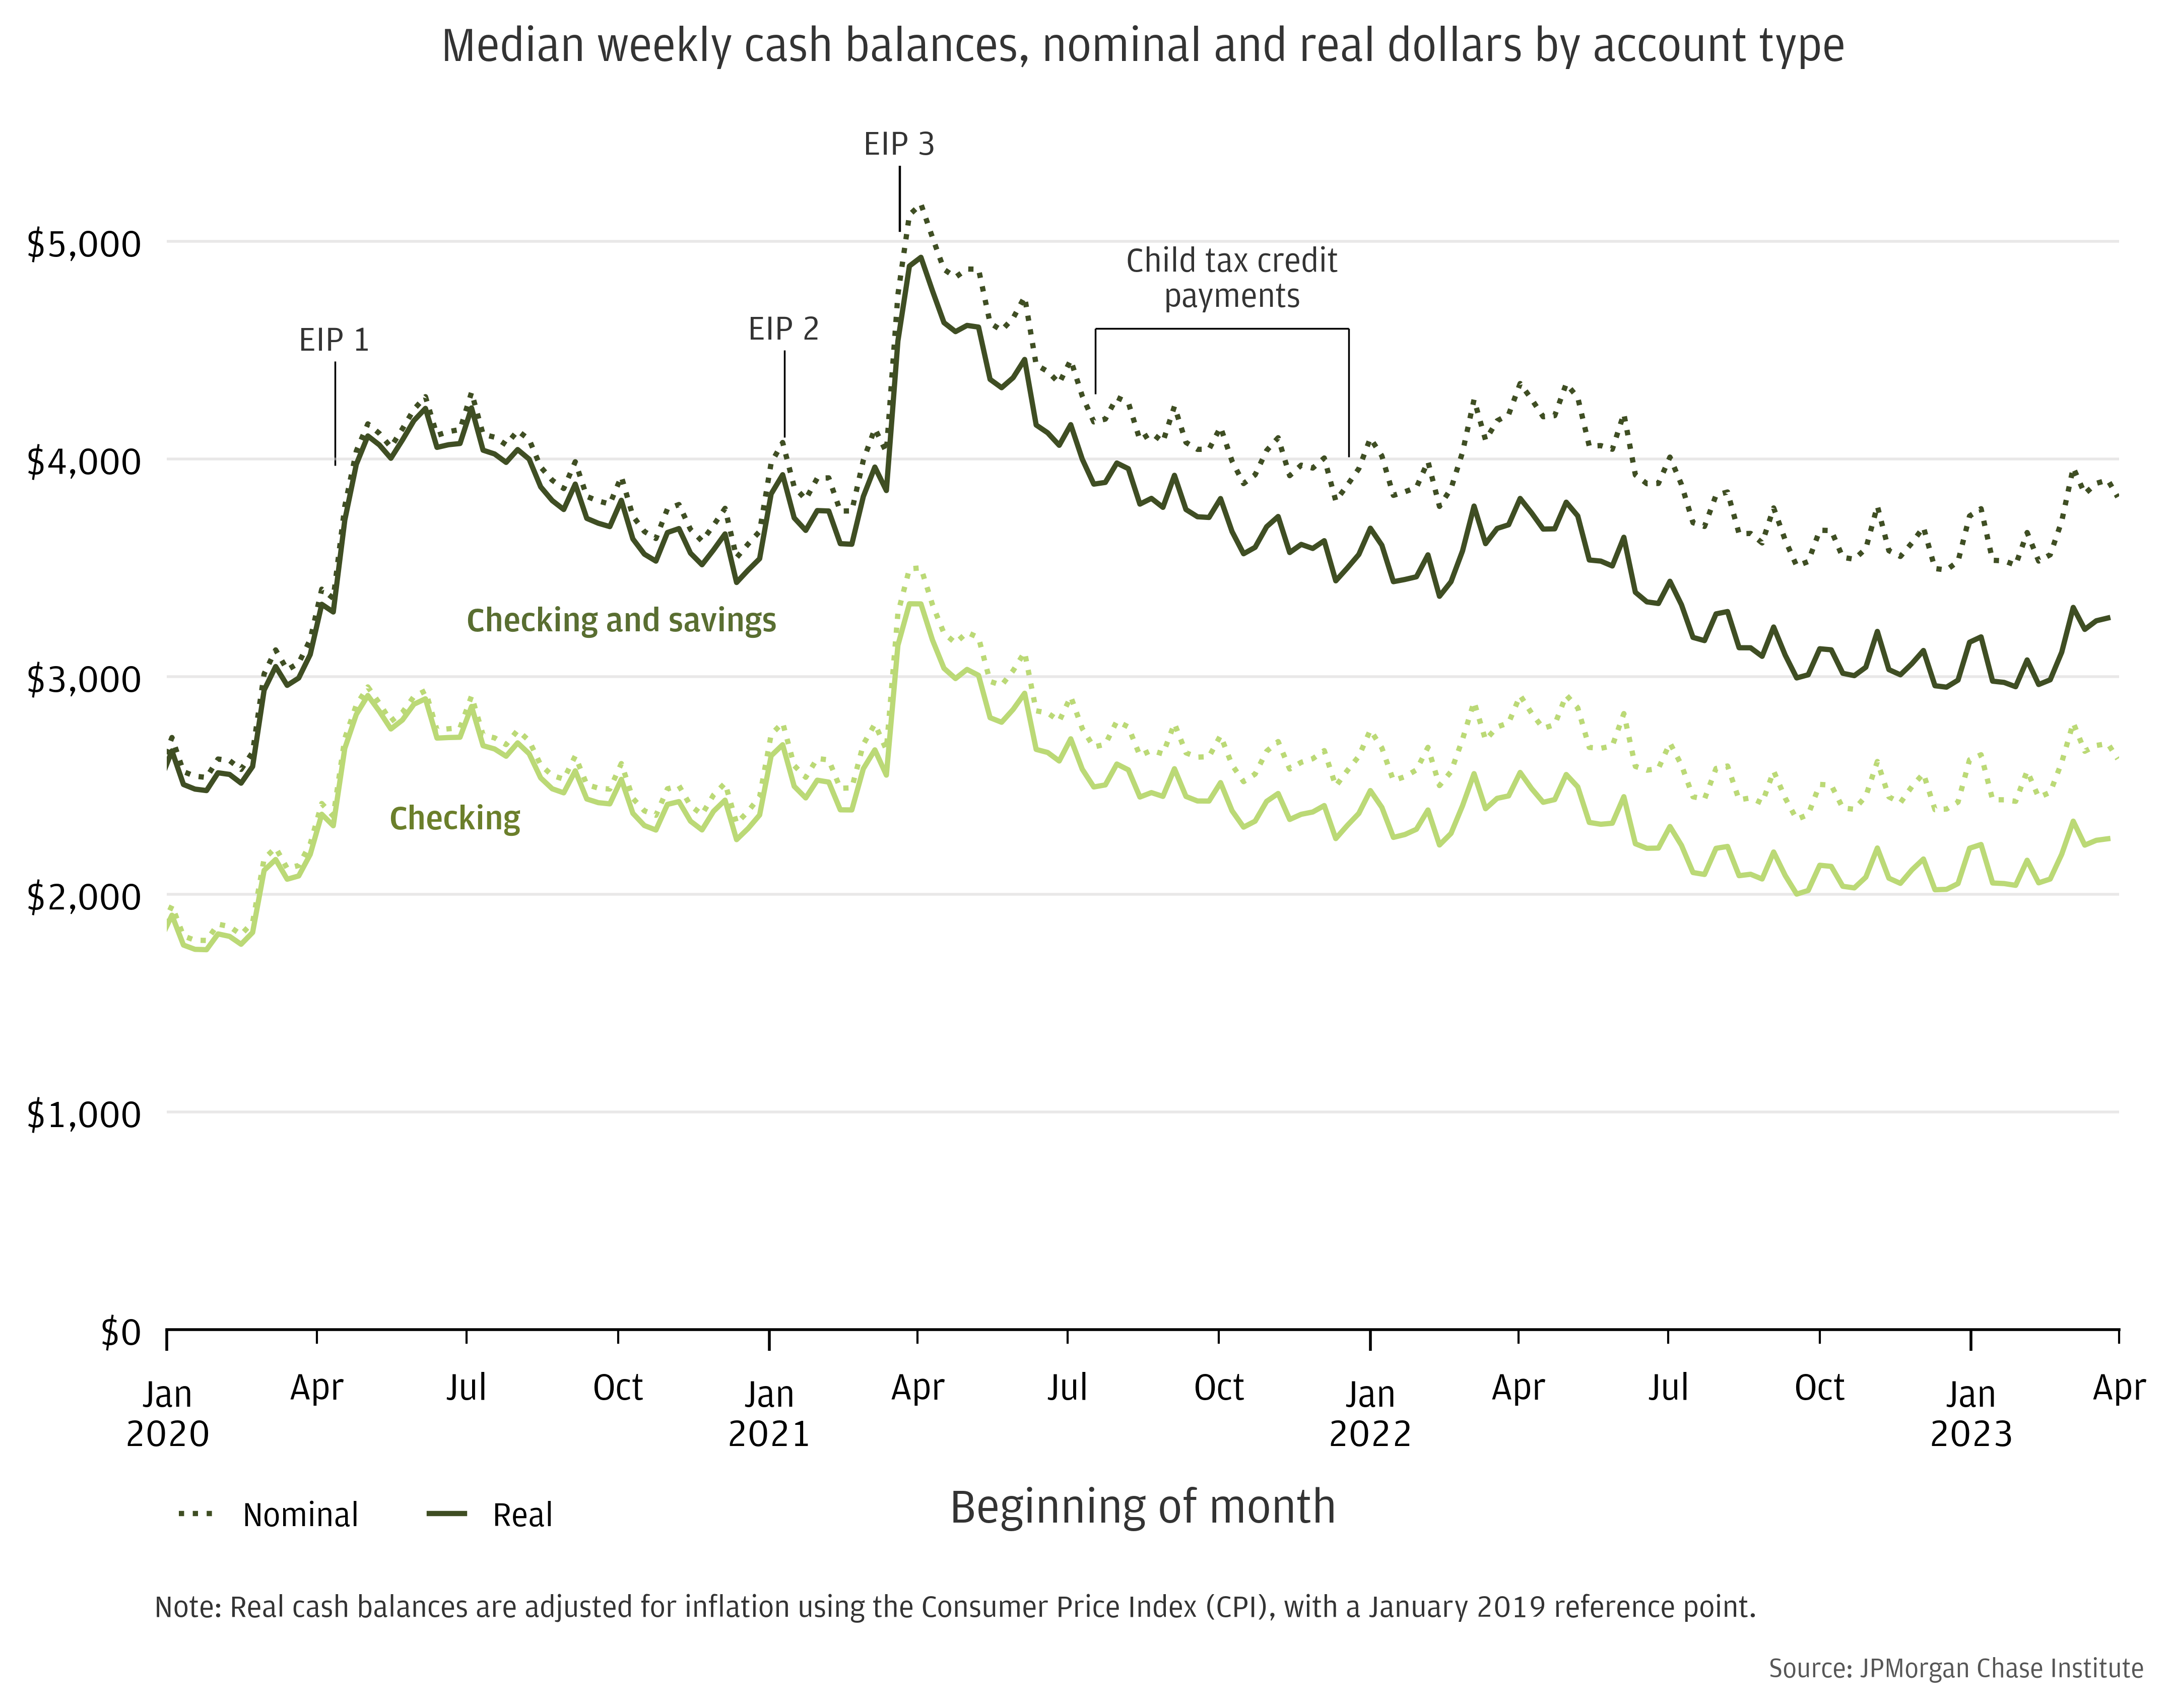
First, our previous cash balance metric only included checking account balances. We now incorporate both checking and savings accounts. Second, we previously calculated balance growth rates based on nominal dollars, a fact that became particularly noteworthy given recent high rates of inflation. In this release we deflate nominal values using Consumer Price Index (CPI) data to report real cash balances. See “Data Box: Our updated cash balance metric” for further discussion on these two considerations.
Finally, previous Pulse reports did not explicitly account for expected upward trends of liquid balances over time. Historically, we observe a year-over-year increasing trend in cash balances.3 Quantifying the typical magnitude of such trends can put post-pandemic balance elevations into context. To better understand how recent balance changes compare to pre-pandemic periods, we now reference several comparative samples in our analysis to examine balance growth during earlier periods.
For this release, we update our cash balance metric to include total balances across a household’s full set of JPMorgan Chase checking and savings accounts. Asset allocations for different groups of households exhibit significant heterogeneity.4 Households that hold a larger share of their financial wealth in checking accounts—primarily lower-income households—may have maintained a larger proportion of their balance increases from government intervention in their checking accounts, and the share of those increases held in checking accounts may vary over time. In contrast, households that distribute their liquid assets across a broader range of accounts may not keep much excess cash in their checking accounts. Thus, casting a broader net with our cash balance metric may allow us to see a larger proportion of such households’ liquid assets.5
We also compute real cash balances in this release by deflating nominal cash balances by the Consumer Price Index (CPI), with January 2019 as our reference point.6 We interpolate the monthly inflation values to produce a week-specific deflator, which we apply to report adjusted weekly medians in January 2019 dollars. These real balances can allow for greater comparability of balances over time, by providing a measure of the purchasing power of a specific dollar balance after accounting for the CPI at that point in time. That said, it is important to note that this methodology does not account for behavioral changes that households may make in response to high inflation, such as reductions in spending. The cash buffer metric used in Household Cash Buffer Management from the Great Recession through COVID-19 does account for reductions in spending, and accordingly provides a complementary view on the recent evolution of household liquidity.
Refer to Appendix Figures A1 and A2 for comparisons of the above cash balance metrics.
Across all income quartiles, households saw their combined real checking and savings balances decrease during the second half of 2022, rising slightly in March 2023 as tax returns began arriving (Figure 1).7 At the end of March 2023, households in the highest income quartile had median balances around $9,000, while balances for the lowest income quartile were around $1,300.8 This represents sizeable decreases from peaks in April 2022 after tax return distributions, when balances were around $10,700 and $1,400, respectively.
Figure 1: Across the income distribution, median cash balances declined steadily during the second half of 2022, with slight increases in March 2023 during tax season.
Source: JPMorgan Chase Institute
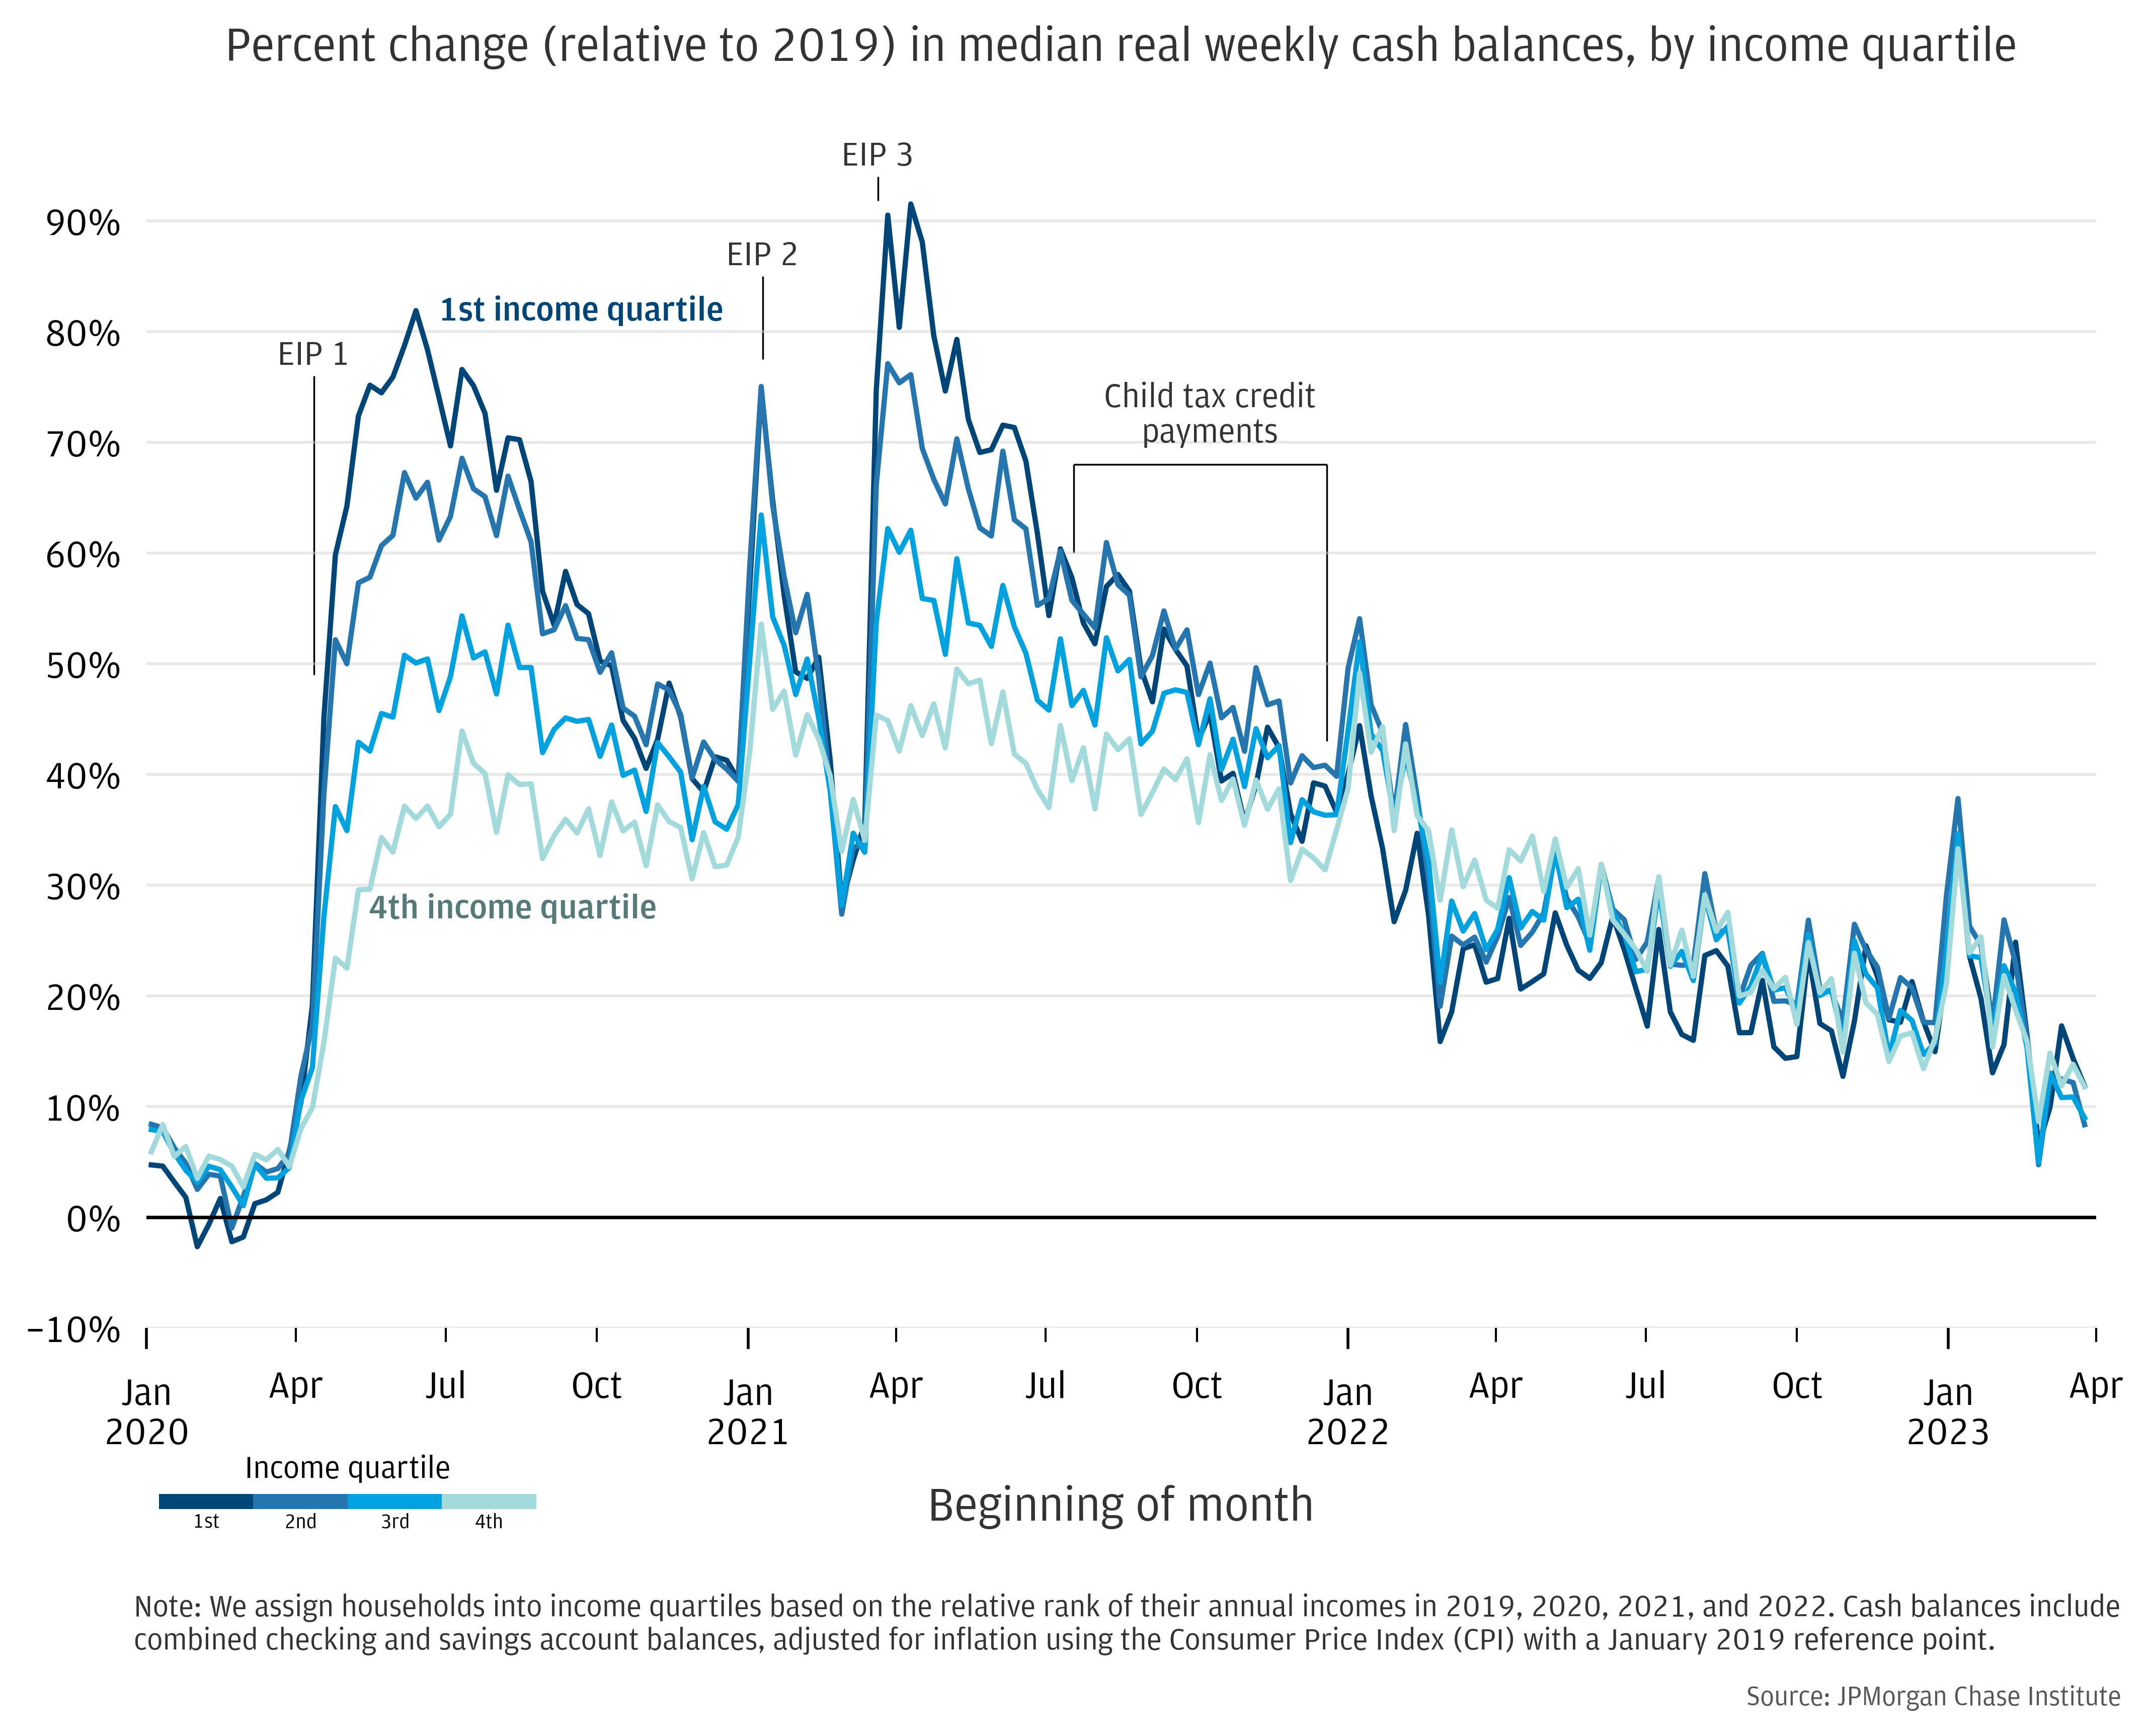
Figure 2 shows the change in median weekly real checking and savings account balances compared to the same weeks in 2019. As shown in the previous Pulse release, the distribution of relative balances flattened in early 2022, with relative balances converging to similar levels across all income quartiles.
Throughout the first half of 2022, median balances remained around 20 to 30 percent elevated relative to 2019; values were consistent across all income quartiles, with relative differences for each quartile within 10 percentage points. Balance elevation decreased in the second half of 2022 and into the first quarter of 2023, with differences between income quartiles remaining less than 5 percentage points. Across all income groups, median real balances at the end of the first quarter of 2023 were roughly 10 to 15 percent elevated, the lowest observed since April 2020.
To put this into perspective, we also examined real balance changes for comparable samples from pre-pandemic years. Specifically, we used the same identification and filtering rules as our Household Pulse sample to construct two pre-pandemic comparison samples that capture outcomes from 2013-2016 and 2016-2019.9 At the end of three years, balances in the comparison samples were elevated between 10 and 15 percent.
Figure 2: In March 2023, median cash balances were roughly 10 to 15 percent elevated for every income quartile, with very little difference across income quartiles.
Source: JPMorgan Chase Institute
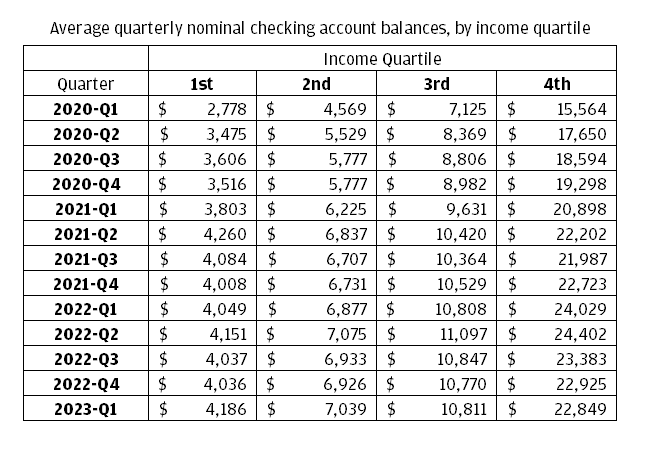
To enable comparisons to other sources that report on checking-account-only cash balances, we also include quarterly mean checking account balances by income quartile in the Appendix (Figure A3).10
To estimate median cash balances by race, we randomly assign each household to a race group based on the racial distribution of their residence’s Census tract.11 Similar geocoding approaches have been used in academic and policy research to estimate race. Throughout this report, we use the word “race” as shorthand to describe households’ modeled race and ethnicity (Hispanic origin).12
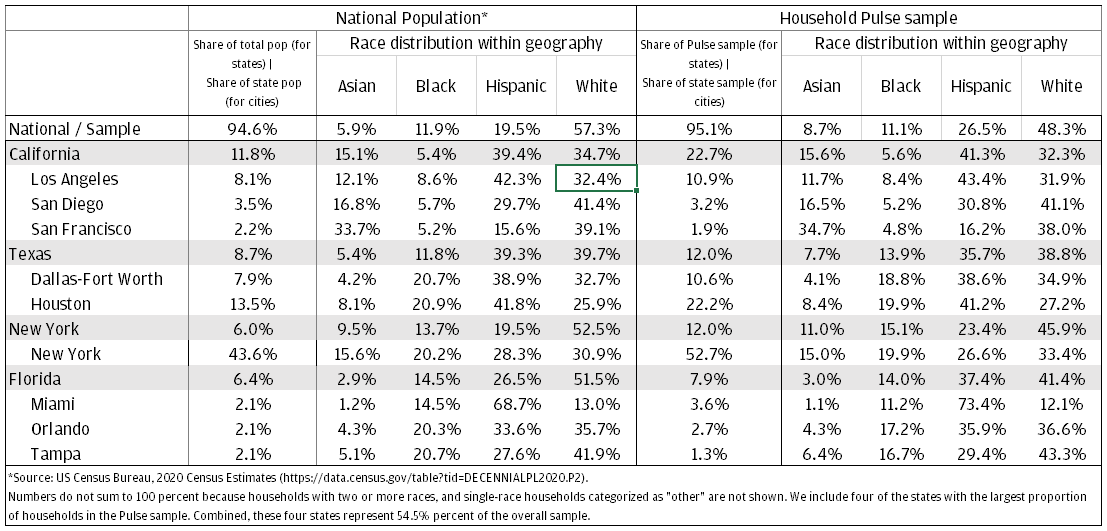
The race distribution we observe in the Pulse sample reflects differences between the Chase customer base and the US population. Our sample overrepresents Hispanic households and underrepresents White households relative to the national population. These differences are due in part to a disproportionate concentration of our sample in urban areas, like New York City, as well as in states like California, Florida, and Texas, which have higher proportions of Hispanic residents. (See Appendix Figure A4 for distribution details).
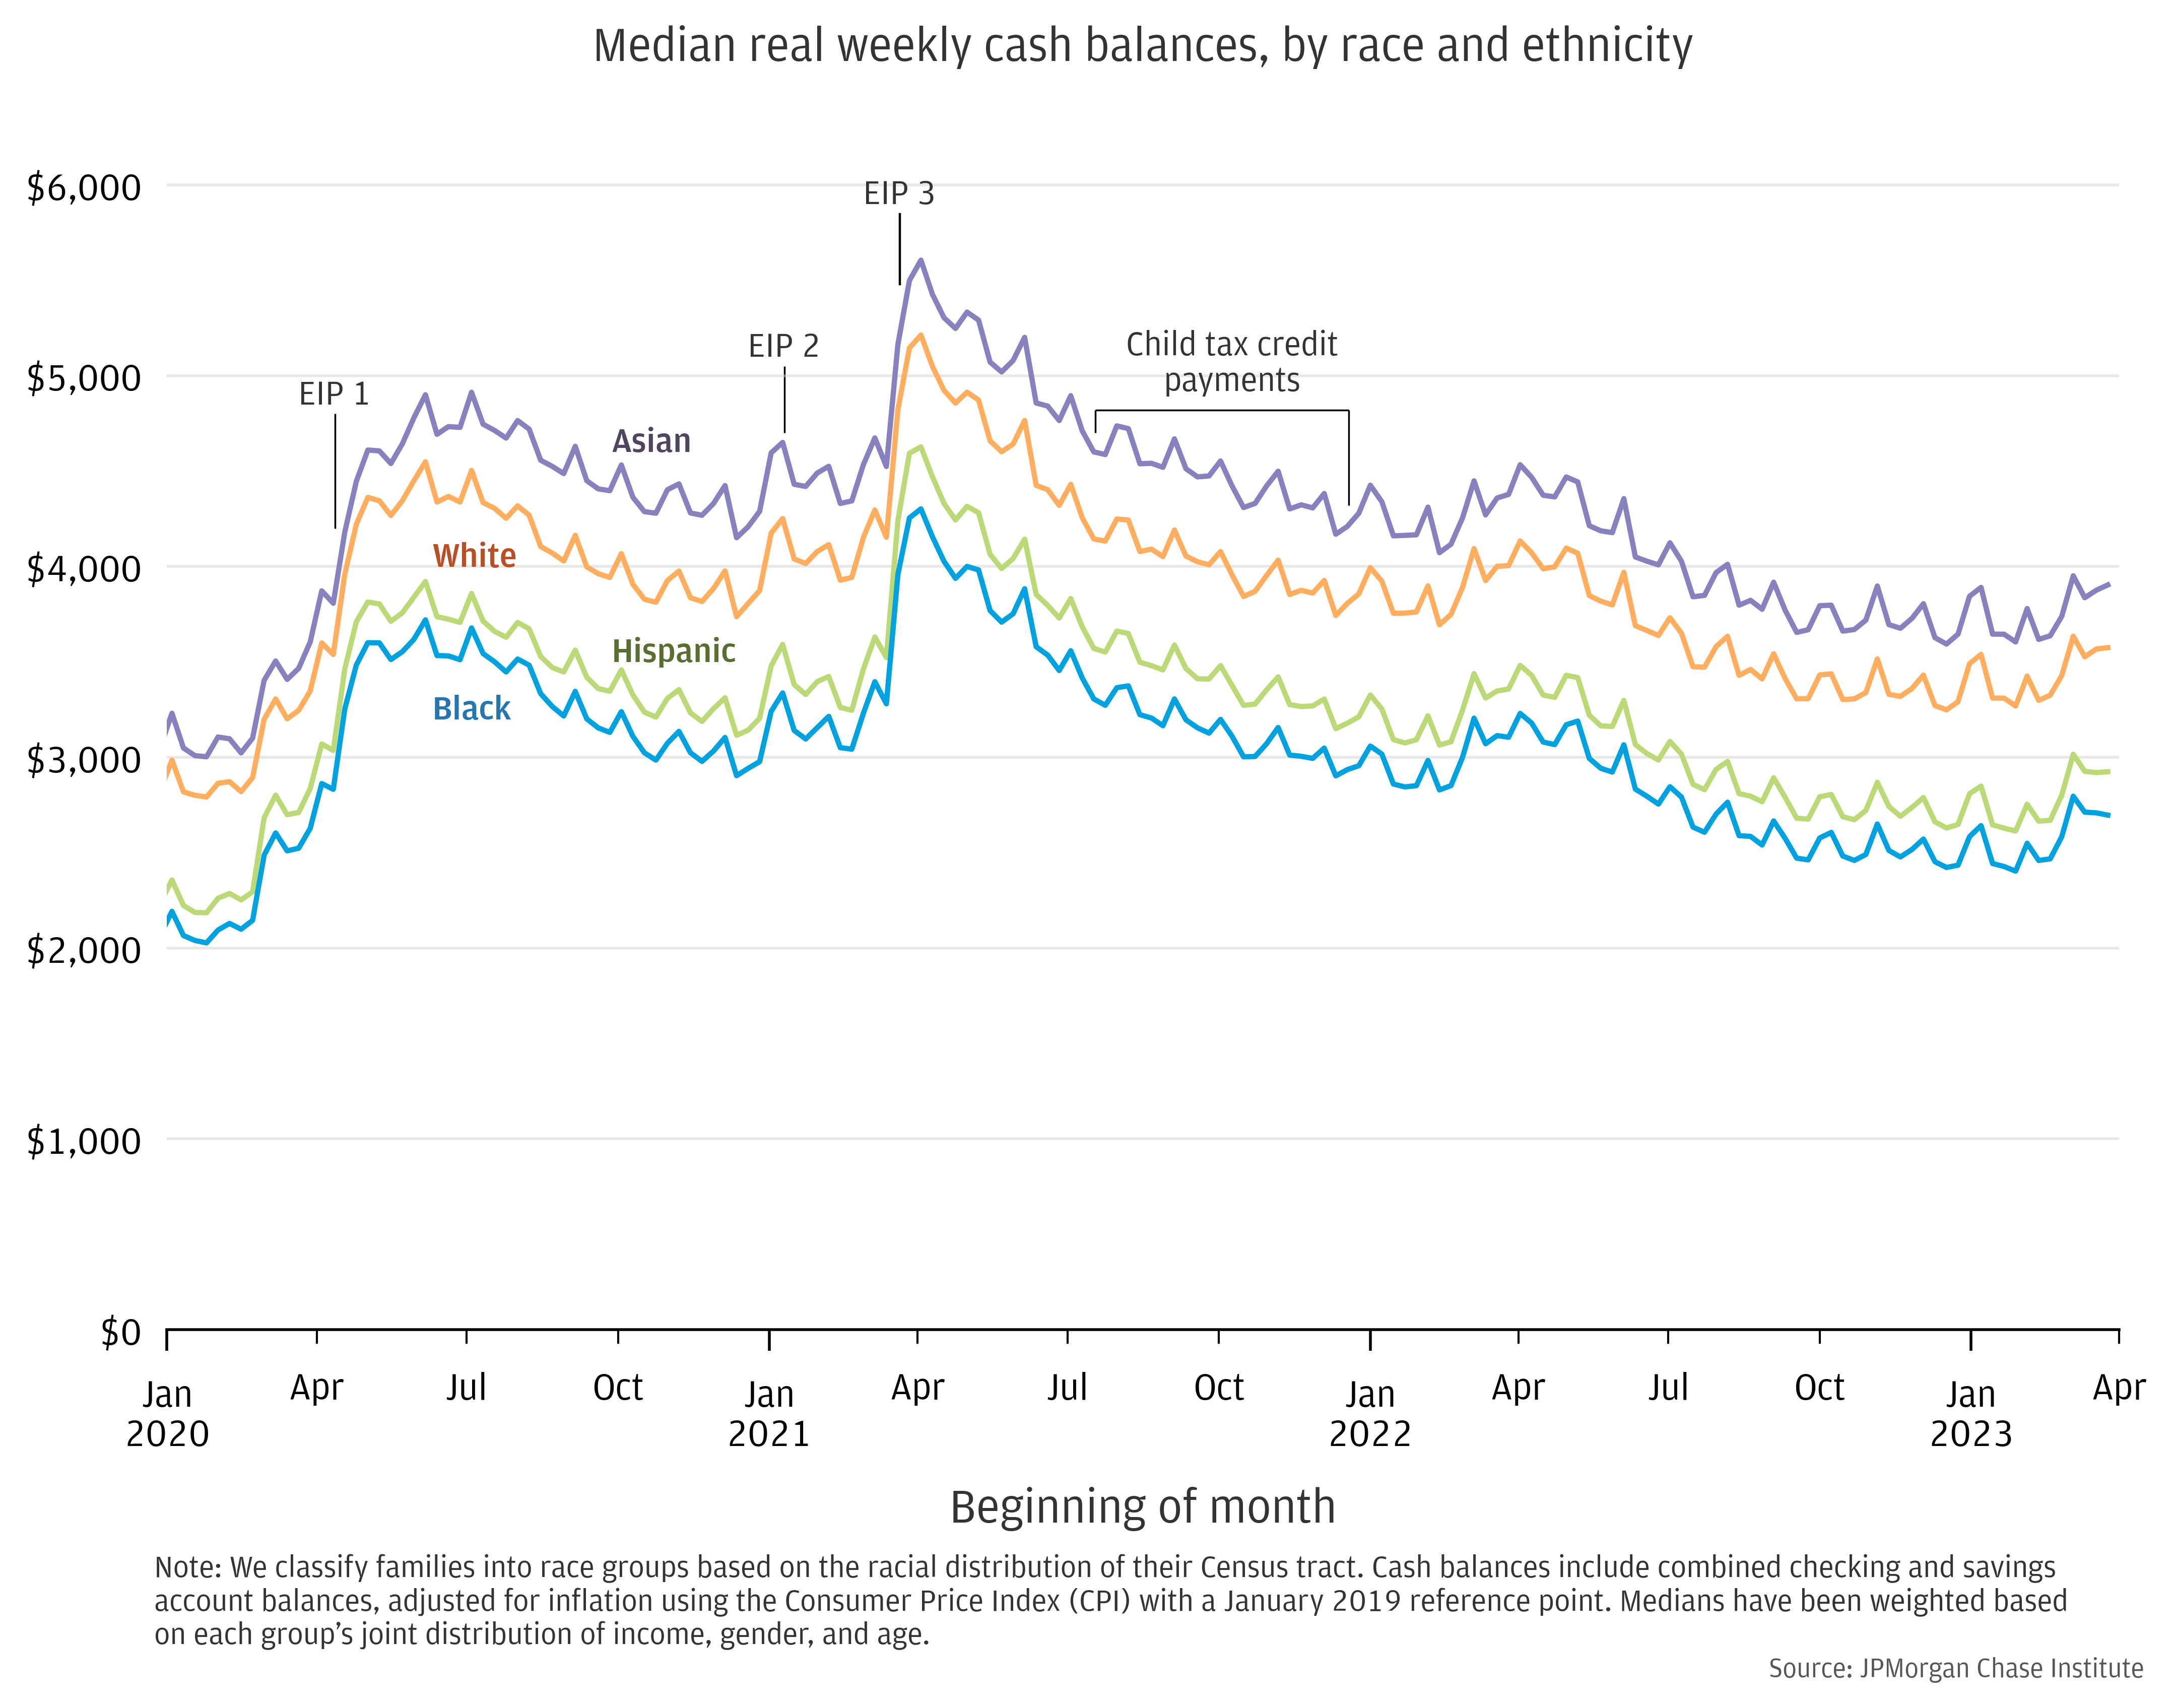
Figure 3 shows median weekly real checking and savings account balance levels by race between January 2020 and March 2023. Medians are weighted to account for characteristics that are correlated with balances and have known differences across race groups, such as income. Income disparities by race are large and persistent in the U.S., where Asian and White households have notably higher incomes than Hispanic and Black households.13 To facilitate comparison between groups, the medians we report have been weighted based on each group’s joint distribution of income, gender, and age. Households in all race groups experienced elevated balances during the COVID-19 pandemic, with peaks in April 2021 following the third round of Economic Impact Payments (EIP). Black households had the lowest median cash balance levels over the three years we observe, followed by Hispanic households. White and Asian households had the highest cash balances.14
The path of balances in 2022 and the first quarter of 2023 followed the same trajectory across race groups: notwithstanding slight gains between March and April—a seasonal pattern typical around tax time15—real balances continued to trend downward. Peak balances for Black and Hispanic families in April 2021 were $4,300 and $4,600, respectively. Balances decreased throughout 2021, with seasonal tax peak around $3,200 for Black families and $3,500 for Hispanic families in April 2022. By the end of March 2023, balances for both groups were below $3,000, approaching their respective pre-pandemic levels.
Figure 3: Median cash balances were higher for Asian and White households than for Hispanic and Black households throughout our analysis window. For all race groups, median cash balances declined steadily during the second half of 2022, with slight increases in March 2023 during tax season.
Source: JPMorgan Chase Institute
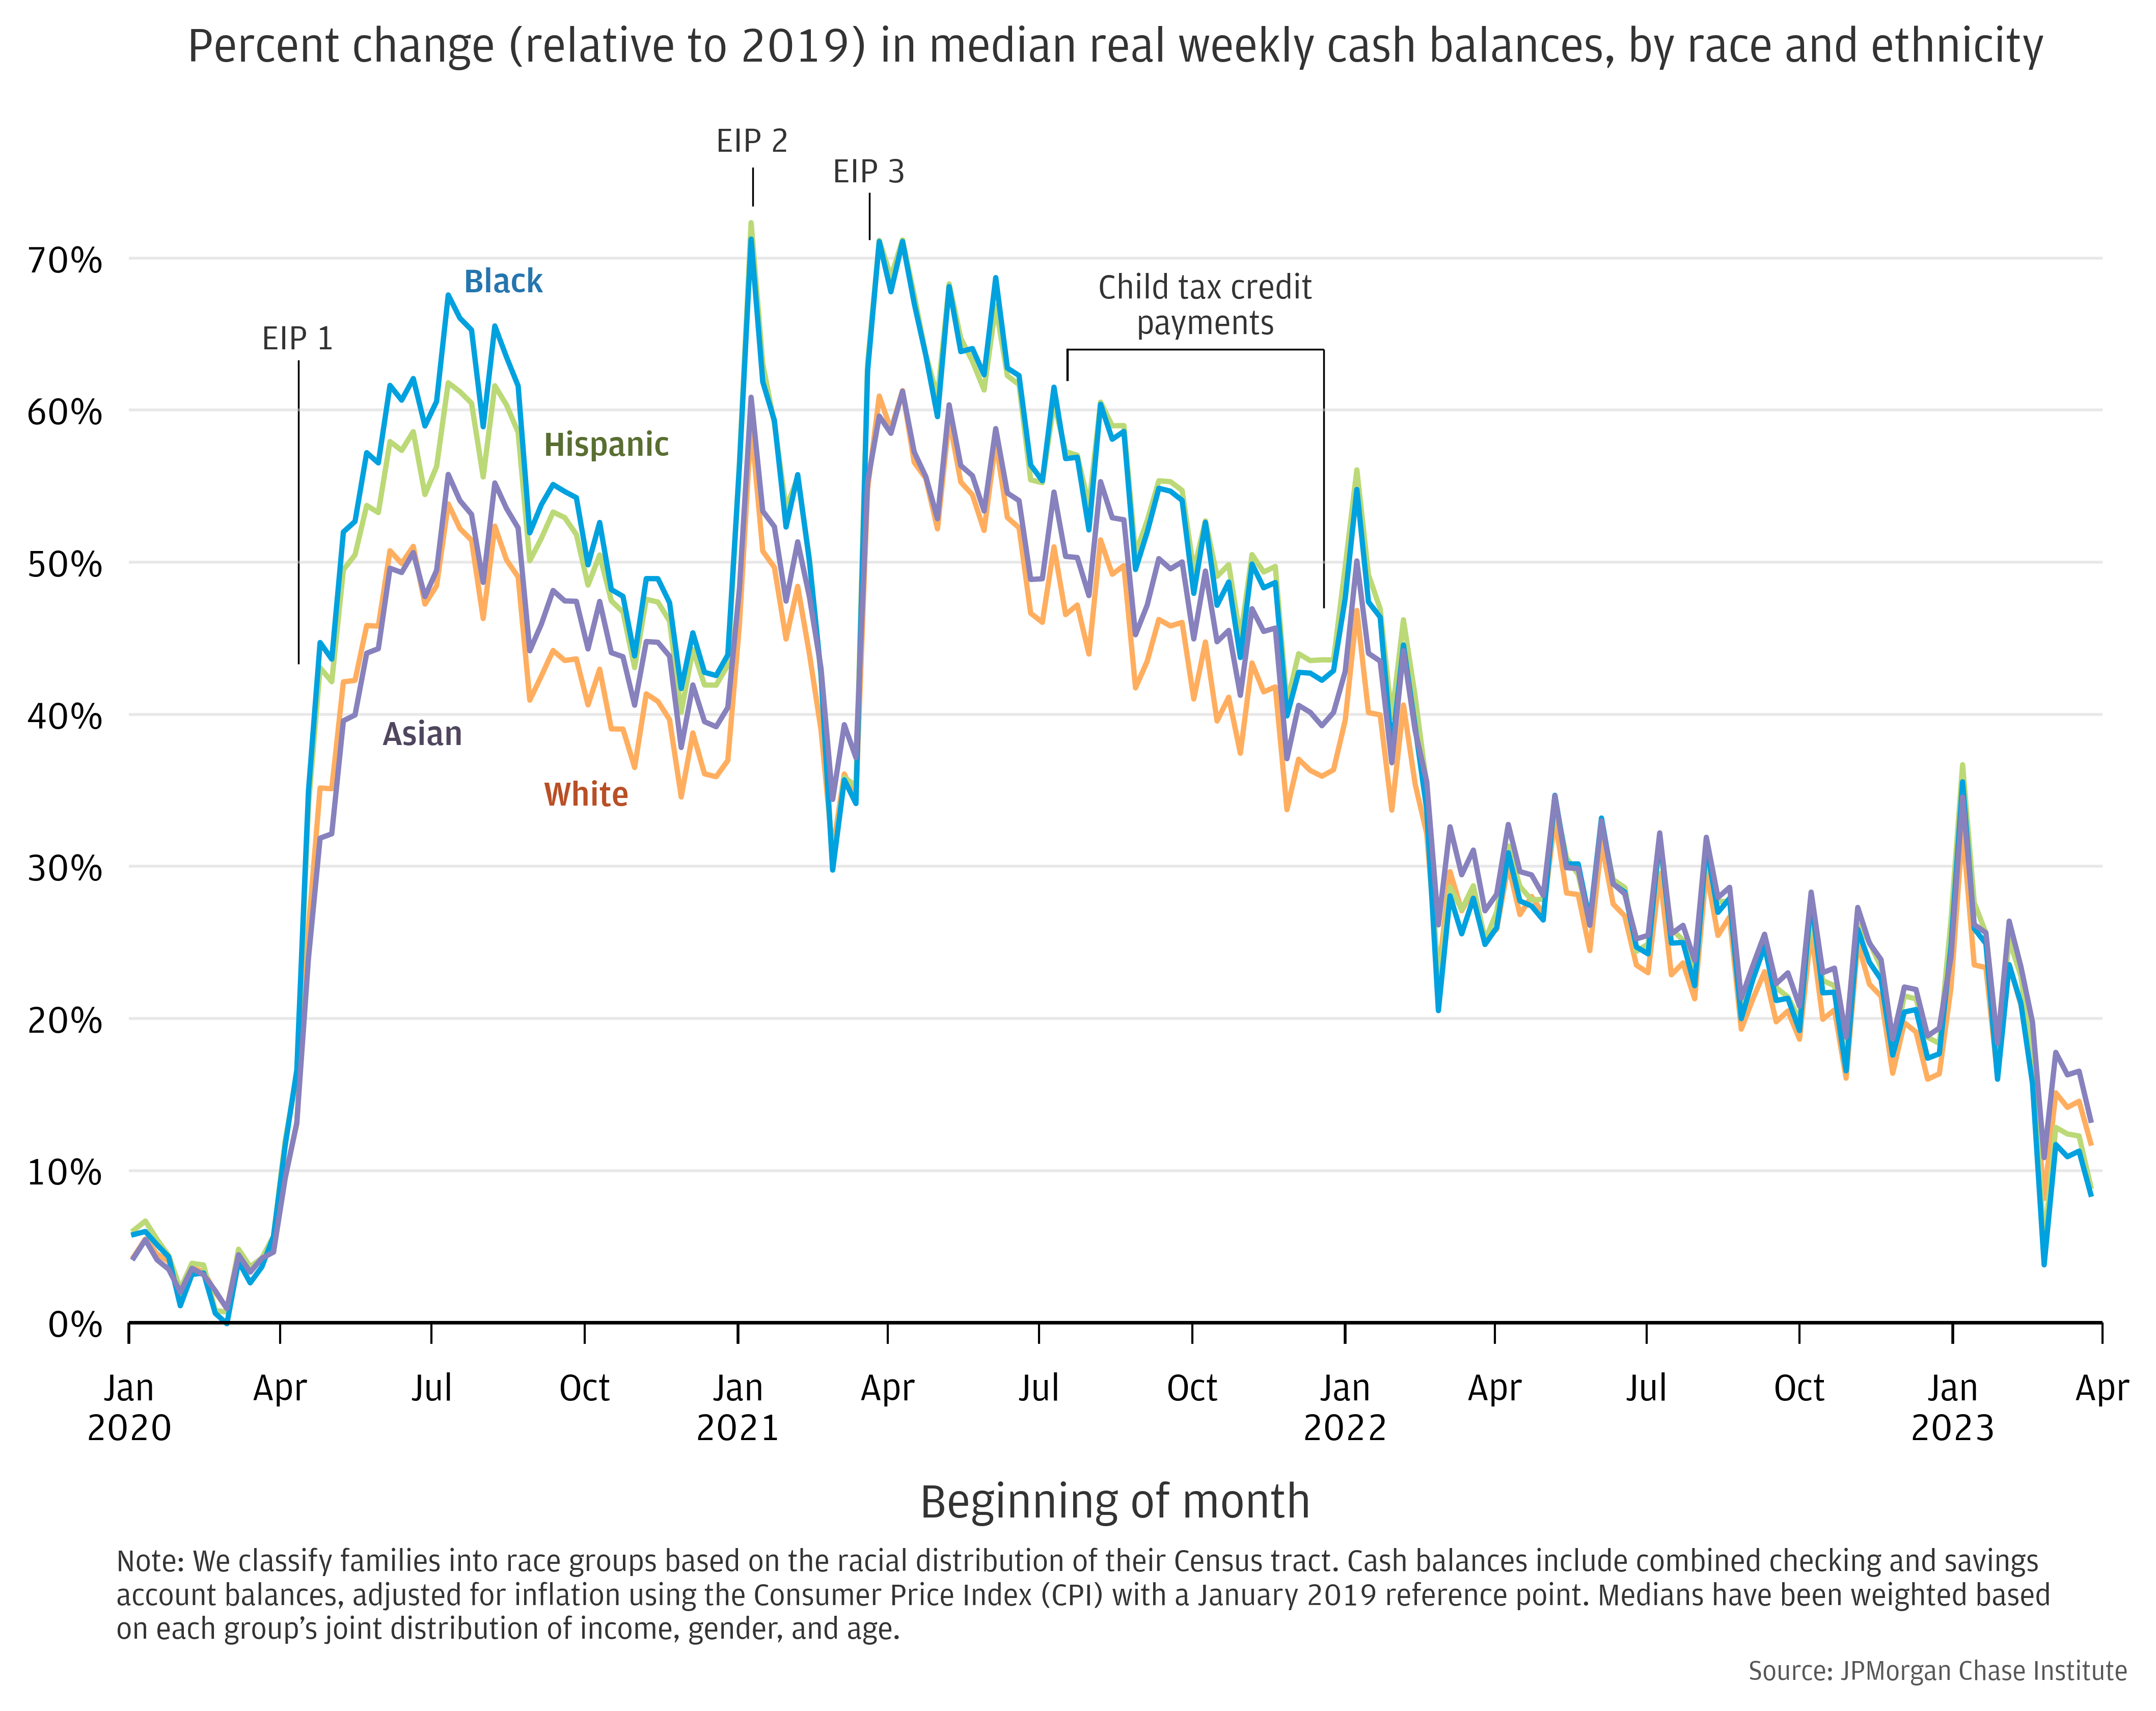
Relative to 2019, Black and Hispanic households saw the greatest balance gains on a percent basis during periods of government intervention, which included multiple rounds of EIP and expanded Unemployment Insurance (Figure 4). Greater percent gains are consistent with lower pre-pandemic balances for these households.
In the second half of 2021, balance gains for Black and Hispanic households depleted more quickly than for Asian and White households, narrowing the gap in balance gains across race groups. By the second quarter of 2022, relative balance elevation levels had converged, resulting in less than 3 percentage points difference in relative balances across race groups throughout the year. Balance gains continued to deplete for all race groups from mid-2022 onward, ending the first quarter of 2023 between 8 and 13 percent elevated. To put this into context, real balances in pre-pandemic comparison samples were similarly elevated at the end of their 3-year analysis windows (see Finding One for further discussion).
Figure 4: Black and Hispanic households saw greater percent change gains in balances than White and Asian households during periods of government intervention, though these gains have since converged.
Source: JPMorgan Chase Institute
Figure A1: Median weekly overall balances in 2022 are roughly $1,300 higher when incorporating both checking and savings accounts, compared to checking-account-only balances. Real balances diverge from nominal balances in mid-2021, declining more rapidly.
Source: JPMorgan Chase Institute
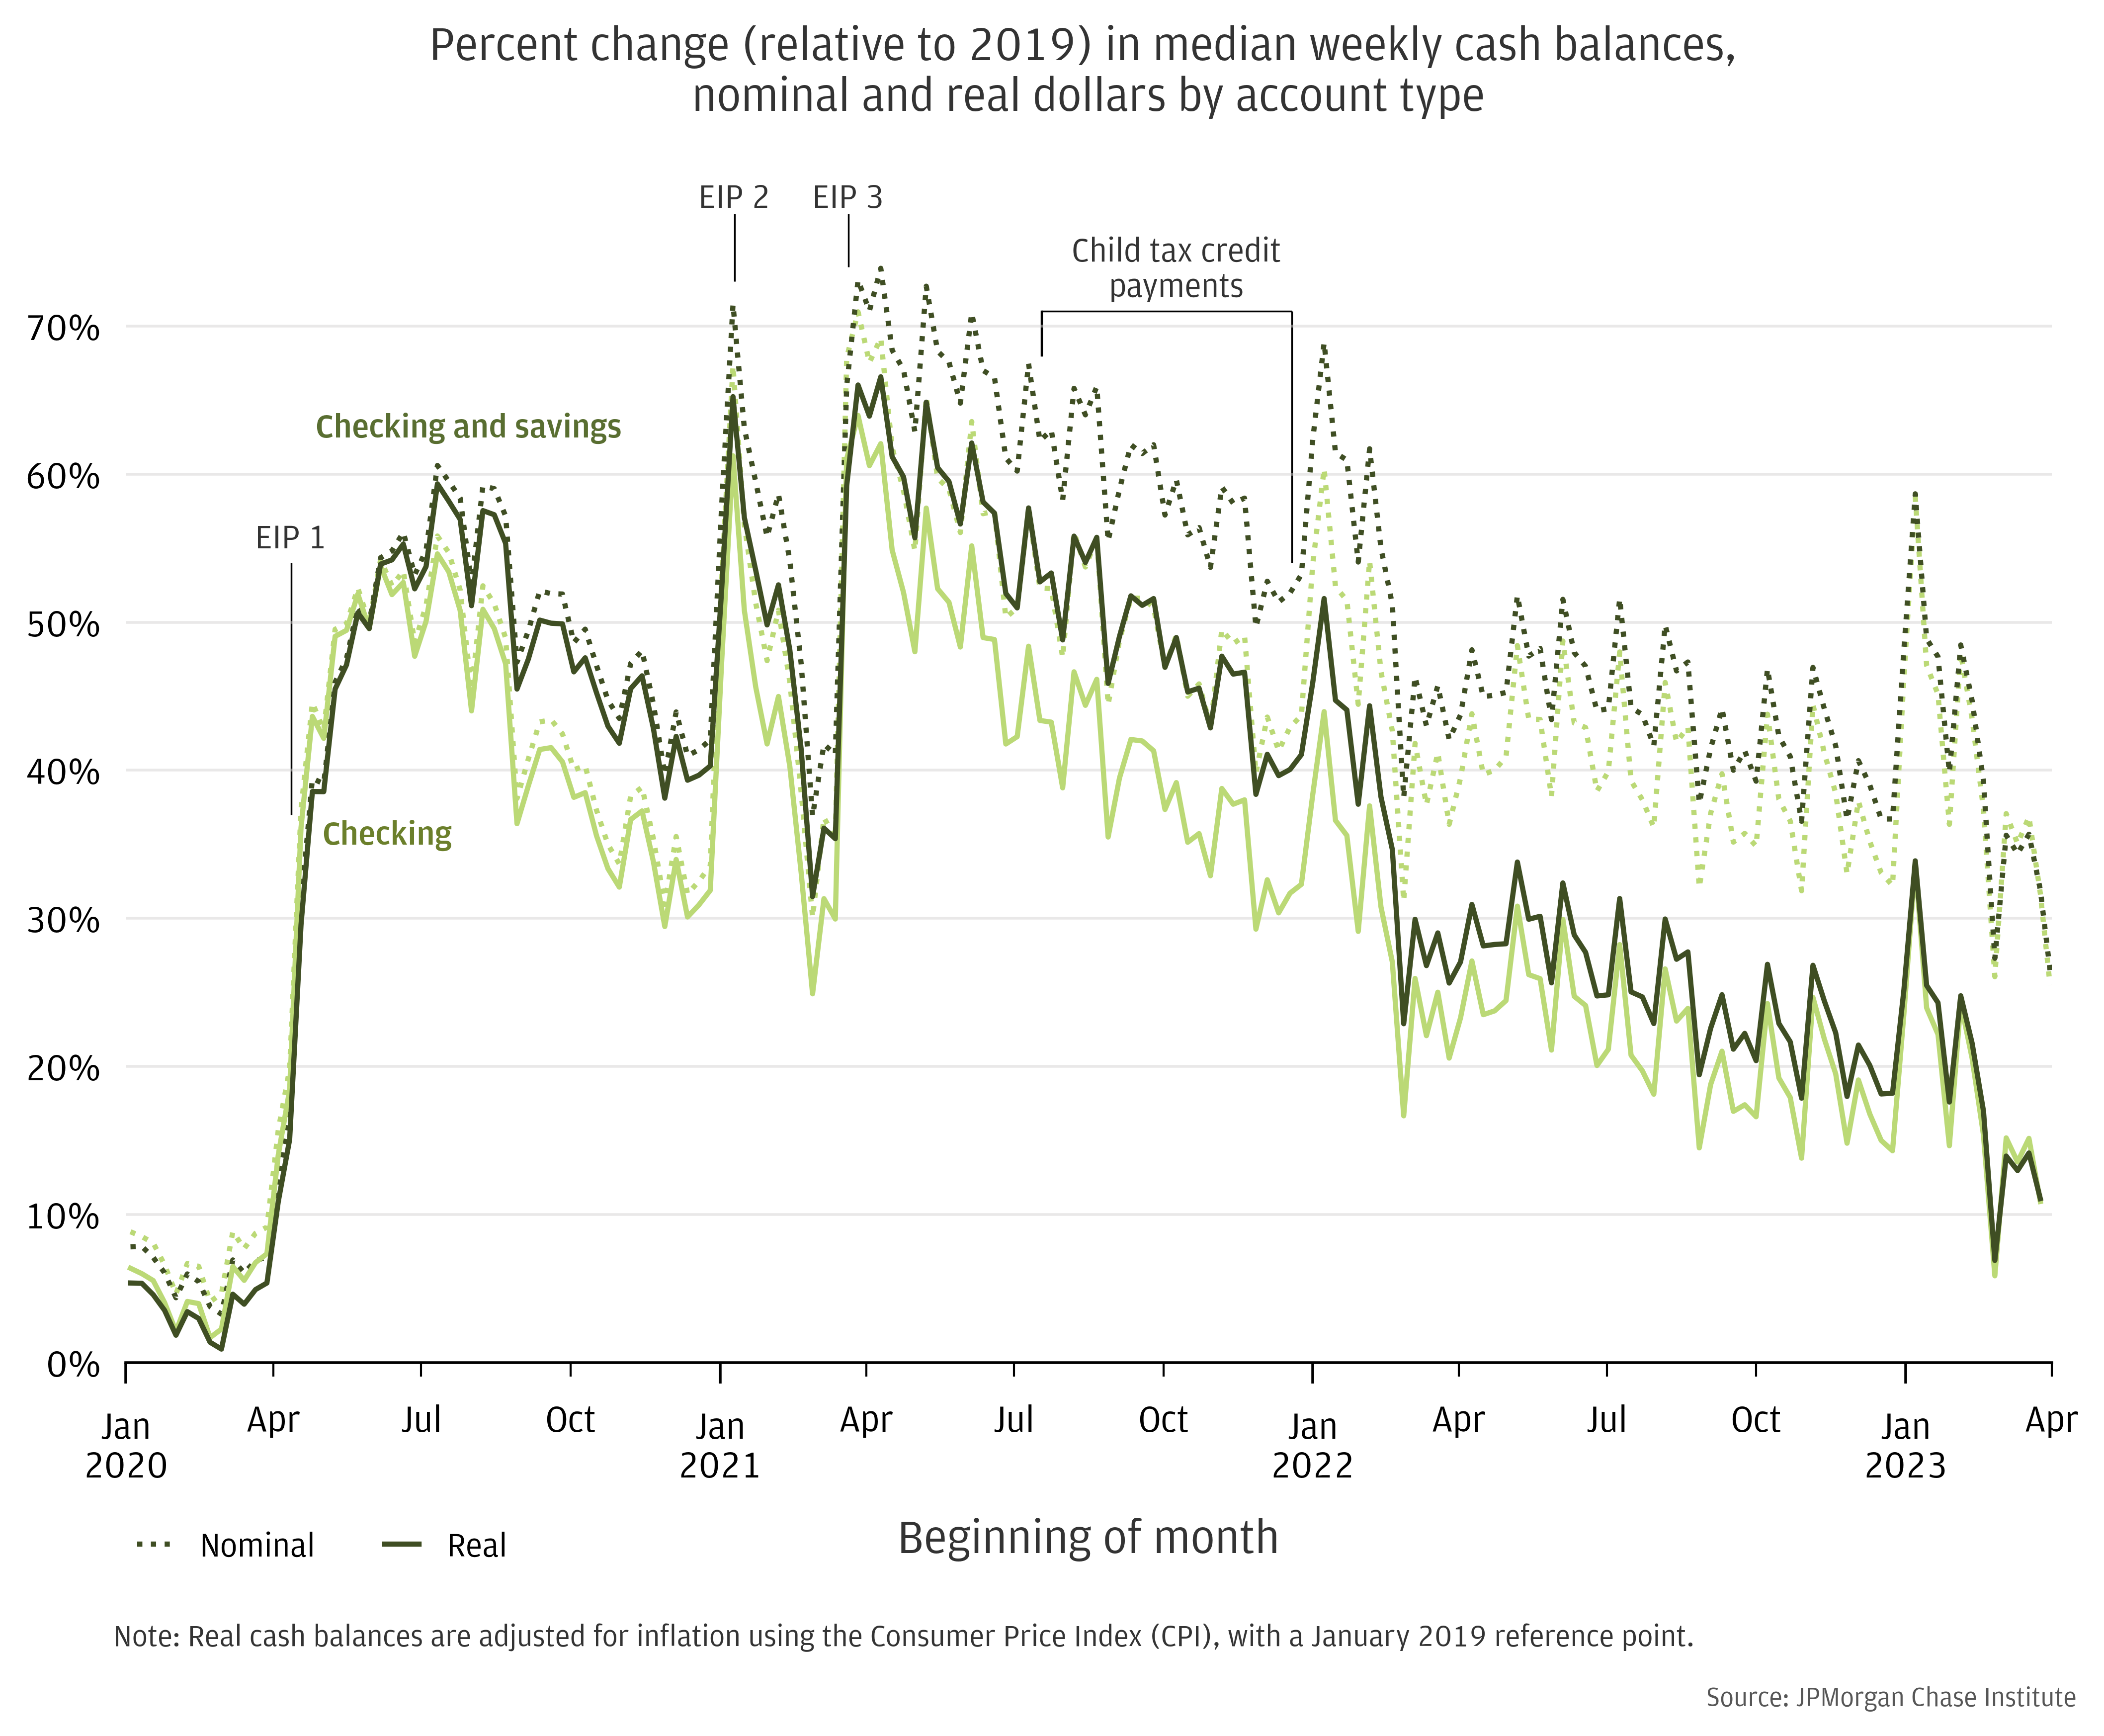
Figure A2: On a relative basis, incorporating savings account balance increases our reported metrics by around 5 percentage points during 2022. Median real balances diverge from nominal balances in the spring of 2021, widening the gap through 2022 and into 2023.
Source: JPMorgan Chase Institute
Figure A3: Mean balances are notably higher than medians within each income quartile, and tend to continuously increase quarter over quarter.
Source: JPMorgan Chase Institute
Figure A4: Relative to Census Bureau data, our sample overrepresents Hispanic households and underrepresents White households.
Distribution of population and Chase Household Pulse sample by select state, city, and race (subset of states)
Source: JPMorgan Chase Institute
This timeframe includes pandemic-associated government financial supports in 2020 and early 2021, and advanced Child Tax Credit (CTC) payments in the second half of 2021. During the pandemic, the federal government provided cash assistance and relief to households through a range of fiscal interventions. Three rounds of stimulus, or Economic Impact Payments (EIP) provided cash benefits to households earning below specified income thresholds, with the dollar amount of the benefit determined by the size of the household, and progressively more paid per child in each round. Stimulus payments landed in April 2020, January 2021, and March 2021. Throughout this time, expanded unemployment insurance delivered payments to jobless workers, including gig workers and self-employed workers, with weekly supplements to typical benefits which were phased out in 2021. Finally, the American Rescue Plan increased the dollar amount of CTC payments and expanded eligibility for households in the 2021 fiscal year. Monthly advanced CTC payments were disbursed from July through December 2021, covering half of the total tax credit, with the remainder arriving when households filed tax returns for the 2021 fiscal year.
https://home.treasury.gov/policy-issues/coronavirus/assistance-for-american-families-and-workers/economic-impact-payments
https://tcf.org/content/report/7-5-million-workers-face-devastating-unemployment-benefits-cliff-labor-day/
Our Household Pulse data asset covers 9.3 million families who were active checking account users between January 2019 and December 2022 and had at least $12,000 in annual adjusted income—non-transfer inflows into the checking accounts, minus Economic Impact Payments (EIP) and Unemployment Insurance (UI)—deposited to their Chase checking accounts every year in 2019, 2020 and 2021.
See Figure 29, which shows an upward trend of 11 percent per year for liquid assets—the deposits and cash equivalents in checking, savings, and Certificate of Deposit (CD) accounts—between January 2013 and December 2015.
https://www.jpmorganchase.com/content/dam/jpmc/jpmorgan-chase-and-co/institute/pdf/institute-coping-with-costs-report.pdf
For instance, the 2019 Survey of Consumer Finances shows that lower-income households hold a larger share of their financial wealth in checking accounts.
https://www.federalreserve.gov/econres/scfindex.htm
As our data includes only JPMorgan Chase accounts, we are unlikely to capture the full breadth of liquid assets for households with broad distributions across many financial vehicles. Nevertheless, the addition of savings accounts to our cash balance metric allows us to capture more than previously, and enables better comparisons with other data sources that also combine checking and savings accounts.
We assign households to income quartiles using the methodology introduced in the previous Pulse release (see “Box: Our updated income metrics”). This method uses our adjusted income metric—non-transfer inflows into the checking accounts, minus Economic Impact Payments (EIP) and Unemployment Insurance (UI)—and calculates each household’s relative rank across income for each year in our sample, averaging ranks to determine final quartile.
While the Treasury disburses tax refund payments as early as January for a given tax year, refund payment volume is largest in March and April. In 2019 through 2021, for example, 23 to 35 percent of the year’s tax refund dollars were distributed between weeks 9 and 12 (late February to late March).
https://fiscaldata.treasury.gov/datasets/daily-treasury-statement/operating-cash-balance
Sample filters are applied to ensure the households in our sample use their Chase accounts as primary vehicles for managing their finances. See details in End Note 2. Our Pulse sample is constructed from households that were active Chase accountholders between January 2019 and December 2022, using 2019 as a reference year for analyses on 2020 through 2022. We apply the same identification and filtering rules to construct comparison samples to analyze data for 2014 through 2016 (reference year 2013) and 2017 through 2019 (reference year 2016).
See our previous Pulse release for discussion of how median balance trajectories differ from mean balance trajectories.
While other JPMorgan Chase Institute reports have used self-reported race—from voter registration data or other third-party data—using these sources would exclude over two-thirds of the nearly 7 million households in our Pulse sample. We employ a modeled race methodology in this report to maintain the widest coverage possible.
Although federal standards specify race and ethnicity as separate and distinct concepts, we use mutually exclusive racial and ethnic categories when assigning race to individuals in our sample. Our categories are similar to those in the Census Bureau’s diversity calculations from the 2020 Census, including: Hispanic or Latino, Non-Hispanic: White alone (one race), Non-Hispanic: Black or African American alone (one race), Non-Hispanic: Asian alone (one race), Non-Hispanic: Other alone (one race), and Non-Hispanic: Two or more races.
This ordinal ranking of balances by race is consistent with prior Institute research examining balances (e.g. Financial Outcomes by race during COVID-19).
We thank our research team, specifically Edward Biggs and Carolyn Gorman, for their hard work and contribution to this research. Additionally, we thank Robert Caldwell and Alfonso Zenteno for their support. We are indebted to our internal partners and colleagues, who support delivery of our agenda in a myriad of ways, and acknowledge their contributions to each and all releases.
We are also grateful for the invaluable constructive feedback we received from external experts and partners. We are deeply grateful for their generosity of time, insight, and support.
We would like to acknowledge Jamie Dimon, CEO of JPMorgan Chase & Co., for his vision and leadership in establishing the Institute and enabling the ongoing research agenda. We remain deeply grateful to Peter Scher, Vice Chairman, Tim Berry, Head of Corporate Responsibility, Heather Higginbottom, Head of Research & Policy, and others across the firm for the resources and support to pioneer a new approach to contribute to global economic analysis and insight.
This material is a product of JPMorgan Chase Institute and is provided to you solely for general information purposes. Unless otherwise specifically stated, any views or opinions expressed herein are solely those of the authors listed and may differ from the views and opinions expressed by J.P. Morgan Securities LLC (JPMS) Research Department or other departments or divisions of JPMorgan Chase & Co. or its affiliates. This material is not a product of the Research Department of JPMS. Information has been obtained from sources believed to be reliable, but JPMorgan Chase & Co. or its affiliates and/or subsidiaries (collectively J.P. Morgan) do not warrant its completeness or accuracy. Opinions and estimates constitute our judgment as of the date of this material and are subject to change without notice. No representation or warranty should be made with regard to any computations, graphs, tables, diagrams or commentary in this material, which is provided for illustration/reference purposes only. The data relied on for this report are based on past transactions and may not be indicative of future results. J.P. Morgan assumes no duty to update any information in this material in the event that such information changes. The opinion herein should not be construed as an individual recommendation for any particular client and is not intended as advice or recommendations of particular securities, financial instruments, or strategies for a particular client. This material does not constitute a solicitation or offer in any jurisdiction where such a solicitation is unlawful.
Wheat, Chris, Erica Deadman. 2023. “Household Pulse: Balances through March 2023.” JPMorgan Chase Institute. https://www.jpmorganchase.com/insights/all-topics/financial-health-wealth-creation/household-pulse-cash-balances-through-March-2023
Authors

Chris Wheat
President, JPMorganChase Institute

Erica Deadman
Consumer Research Lead, JPMorganChase Institute