

Figure 1
Latest news

An Ohio-based company is protecting first responders around the world
With support from JPMorganChase, Fire-Dex is providing protective equipment to firefighters in 100 countries and all 50 states.
Learn moreLatest news

Veteran’s Unconventional Path to Landing her Dream Job in Tech
U.S. Army Veteran Ashley Wigfall transitioned to a civilian role and charted her path to technologist through mentorship and skills training at the JPMorgan Chase tech hub in Plano, Texas.
Learn more
Following the period of elevated liquid assets driven by the fiscal policy response and changes in household spending and saving during the COVID-19 pandemic, publicly available metrics still show $500 billion in excess savings in March 2023 relative to the level observed pre-pandemic (Abdelrahman and Oliveira 2023).1 This release of the Household Finances Pulse aims not only to characterize the distribution of cash balances across different kinds of households, but also to provide additional context to describe the state of available cash liquidity for American households more accurately. We leverage de-identified administrative banking data to examine the path of household cash balances from January 2020 through October 2023 for 8.6 million Chase customers.2
To put balances into perspective, we first show that real cash balances—which better capture household purchasing power—are much closer to 2019 levels than nominal balances. Next, we show that balances relative to 2019 have begun to level off for low-income households and for all race groups but continue to decline for high-income households. Finally, we show that balances and cash buffers—balances scaled to spending—have been in-line with or below historical expectations since the second quarter of 2023.
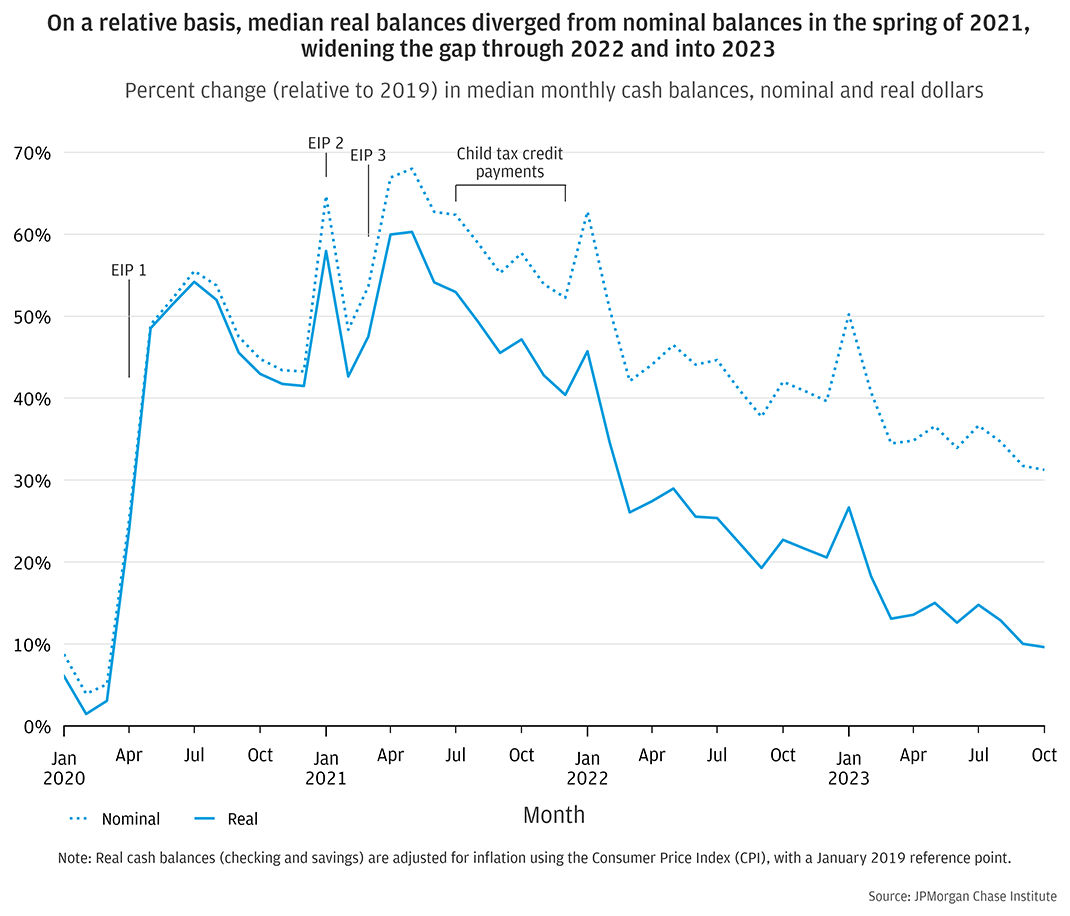
The growth of household balances since 2019 appears much rosier when not adjusted for the 40-year record-high inflation in 2021 and 2022.3 To address inflation and an associated decrease in the purchasing power of households’ cash reserve, we began reporting on real cash balances rather than nominal cash balances in the last release of the Pulse. We compute real cash balances by deflating nominal cash balances by the Consumer Price Index (CPI), with January 2019 as our reference point.4 Reporting real balances allows for greater comparability of the purchasing power of balances over time.5
Looking at relative balances—percent change in monthly median balance relative to the same month in each sample’s reference year—Figure 1 shows that real balances diverged from nominal balances in the spring of 2021, and that the gap widened more rapidly through 2022 and into 2023. By the time relative balances levelled off in the second quarter of 2023, growth in real balances relative to 2019 was around 20 percentage points lower than nominal balances. Accounting for recent changes in the purchasing power of each dollar shows recent cash reserves are much closer to pre-pandemic reserves than nominal bank balances would suggest. This is in line with consumer sentiment, which indicates recent anxiety related to personal finances coming back into alignment with pre-pandemic sentiments after a period of higher confidence in recent years, even though the median nominal balance is still up 35 percent.6
Figure 1
Cash balances relative to 2019 began to level off for low-income households and for all race groups but continue to decline for high-income households.
In the second and third quarters of 2023, monthly balances continued to decline for high-income households, but leveled off for low-income households (Figure 2).7 In October 2023, households in the highest income quartile had median balances around $7,700, down from $8,900 in January. In contrast, balances have been relatively steady for households in the lowest income quartile: around $1,100 in both October and January 2023.
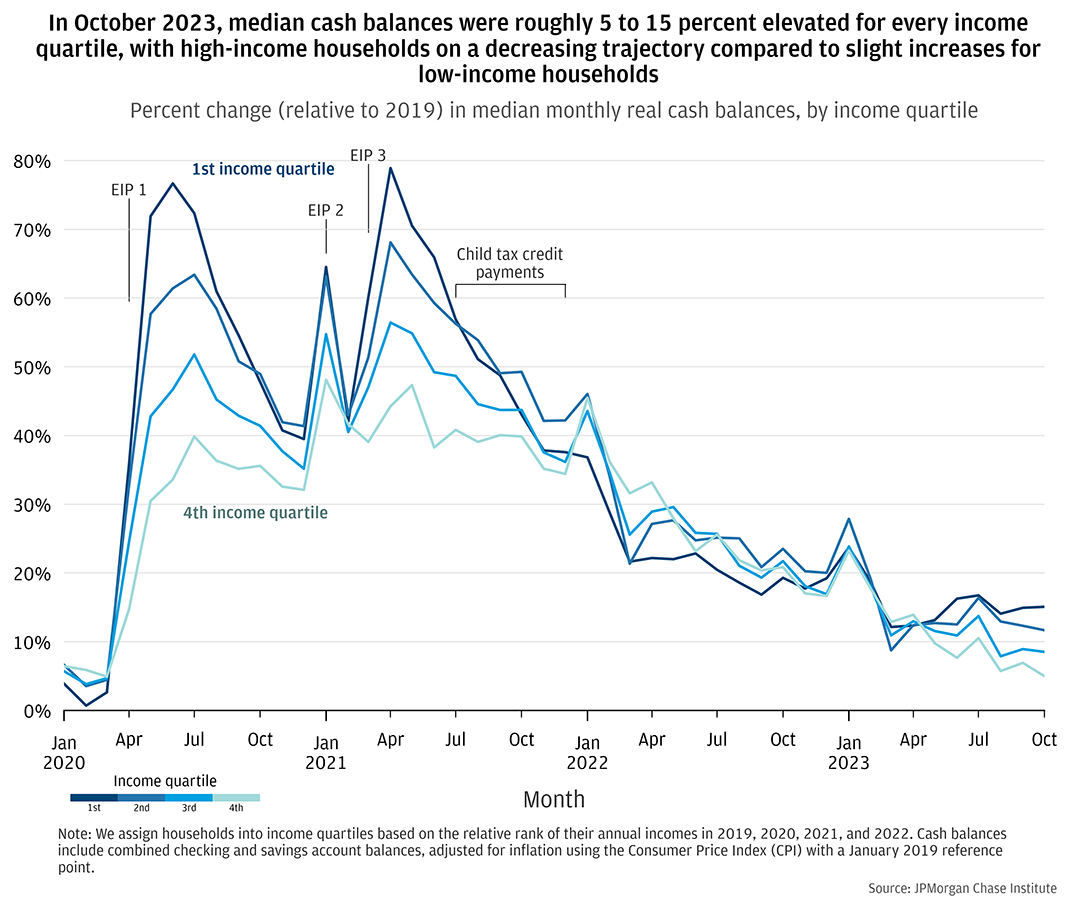
Figure 3 shows the change in median monthly balances compared to the same months in 2019. In the previous Pulse release with data through the end of March 2023, the distribution of relative balances had converged to similar levels across all income quartiles. With additional data from April through October, a new pattern emerged: relative balances continued to decline for high-income households but leveled off or slightly increased for low-income households, with October 2023 balances elevated between 5 and 15 percent relative to 2019.
The decline in balances for high-income households could reflect the lower share of liquid wealth they hold in checking and savings accounts. Higher rates on interest-bearing accounts and assets could lead to elevated transfers out of the household checking and savings accounts for more financially savvy households. Post-pandemic market trends have shown dramatic increases in the levels of assets maintained in money market funds (MMFs), sharply increasing in the first half of 2020 and again in the first half of 2023.8 Given that higher-income households hold a smaller share of their financial wealth in checking accounts than other types of accounts, recent increases in MMF assets may indicate that high-income households are allocating even greater proportions of their liquid balances to these higher-earning accounts, contributing to continued declines in their checking and savings account balances.9
Figure 2
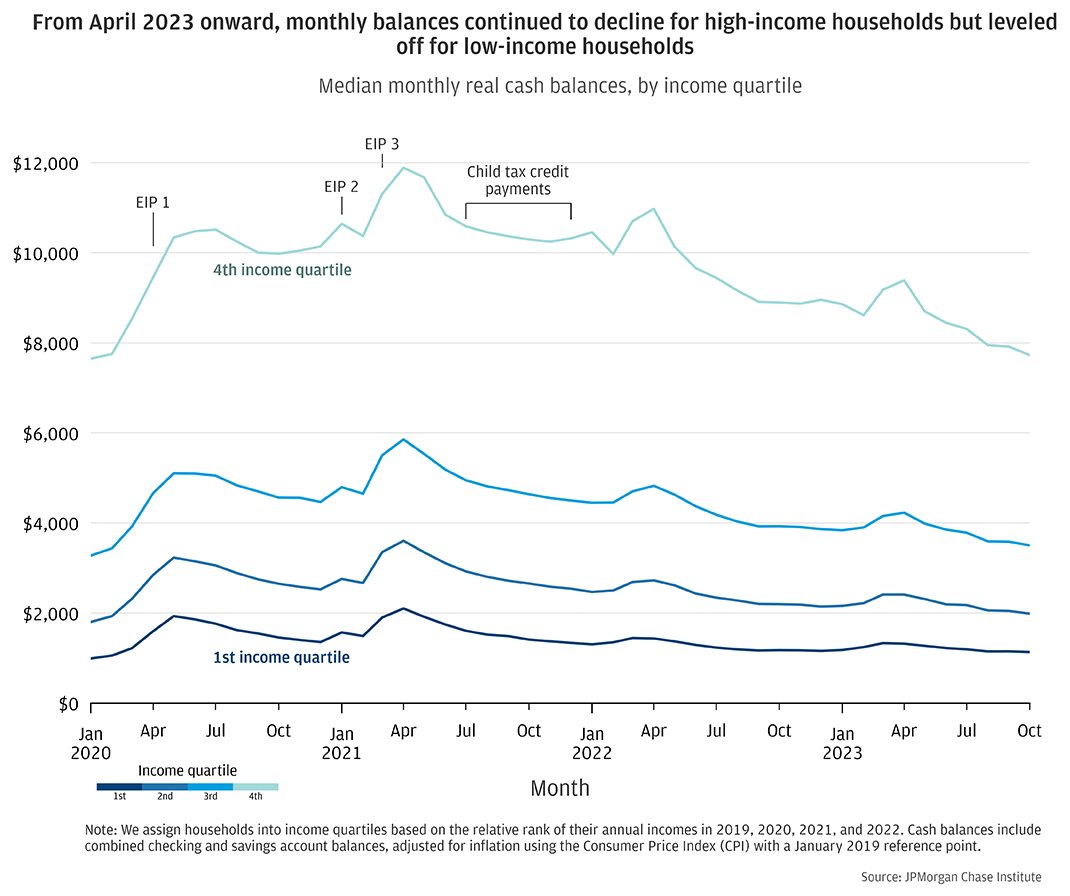
Figure 3
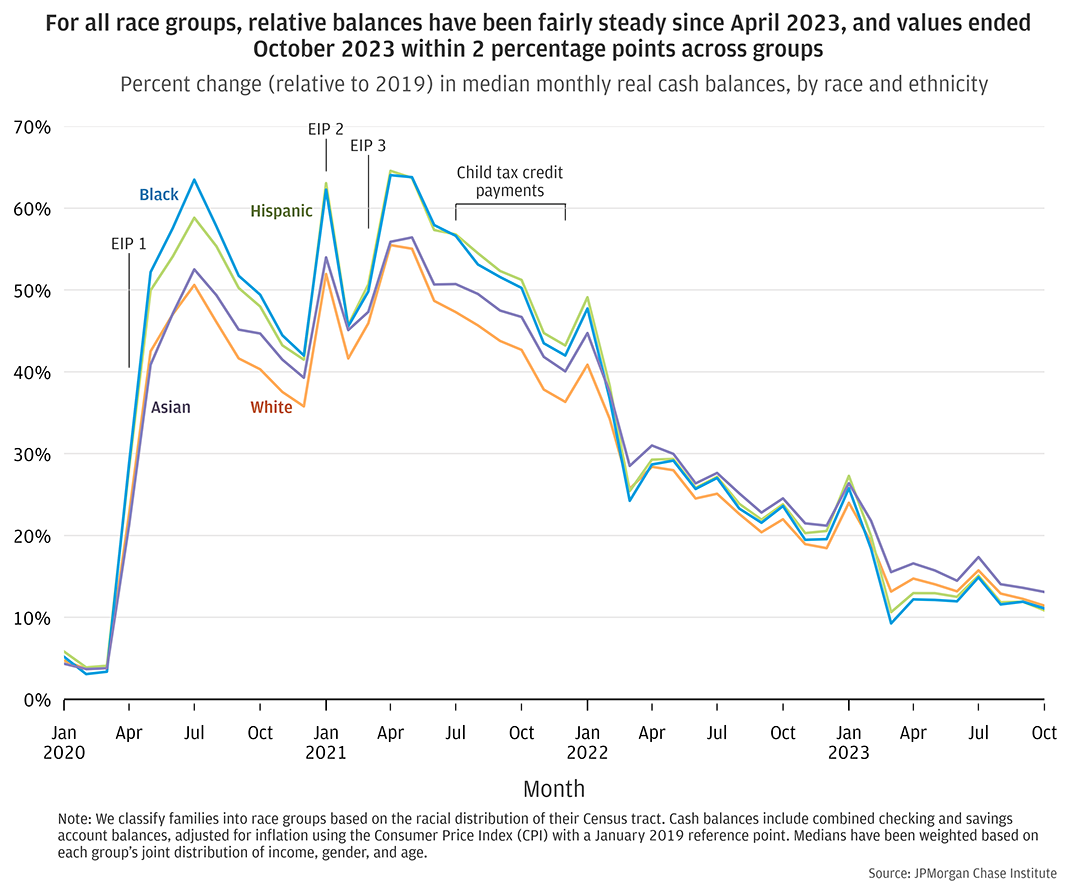
Balance trajectories in the second and third quarters of 2023 look similar across race and ethnicity groups, mirroring the trajectories of the middle of the income distribution.10 We weight median balances to account for differences in income, age, and gender across race groups, and continue to see clear level differences in weighted medians, with Asian and White households having notably higher balances than Hispanic and Black households.11 Despite level differences, balances remained roughly parallel across all race and ethnicity groups, declining slightly between January and October 2023—by $200 to $300 for each group.
On a relative basis (Figure 5) balances have been fairly consistent in the second and third quarters of 2023, with a very slight increase for Black and Hispanic households. As noted in the previous Pulse release, relative balance elevation levels converged by the second quarter of 2022, and that continues to be the case, with very little differentiation across race and ethnicity groups. In October 2023, relative balance values were within 2.2 percentage points across groups, ranging from 11 to 13 percent elevated relative to 2019.
Figure 4
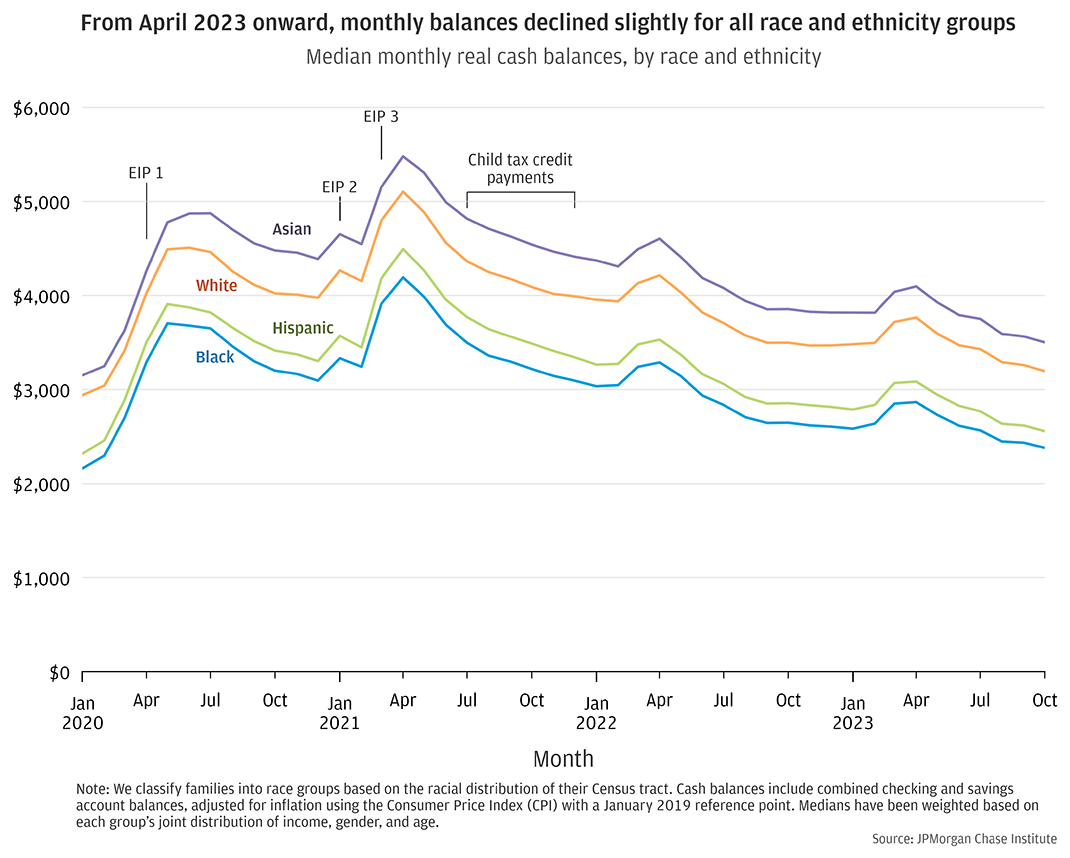
Figure 5
Balances have been in-line with historical expectations during the second half of 2023, whereas cash buffers—balances scaled to spending—remain somewhat elevated.
How do current cash balances compare to where households would have been had their usual growth not been disrupted by a pandemic? As households age, their incomes tend to increase and they tend to spend and save more. Every household in our balanced household panel is four years older in the final year of our analysis window than they were in the reference year—and those four additional years bring increases in income and cash balances. Previous work has shown that individuals tend to maintain relatively stable cash buffer levels over time, spending down excess cash when balances are elevated until they return to their usual cash buffer level, at which point they stop dissaving (Wheat and Eckerd 2023).
To understand current balances in the context of households’ expected life-cycle growth, we examined real balance changes for a pre-pandemic sample in comparison with our Household Pulse sample. Specifically, we used the same identification and filtering rules as our Pulse sample to construct a separate historical comparison sample with a 2015 reference year to assess balances from January 2016 through October 2019.12 This comparison sample demonstrates the impact of the balanced panel dynamics described above outside of the context of the COVID pandemic and its associated policy responses, helping to put recent balance results into perspective.
Figure 6 shows relative balance growth both for the Pulse sample and the historical comparison sample. In both samples, balances were around 10 percent elevated by October of the fourth year after the reference year. In other words, the amount of balance elevation that we observe in the Pulse sample has come back into alignment with historical trends, rather than representing excess cash. Results for the two samples have been aligned since June 2023.
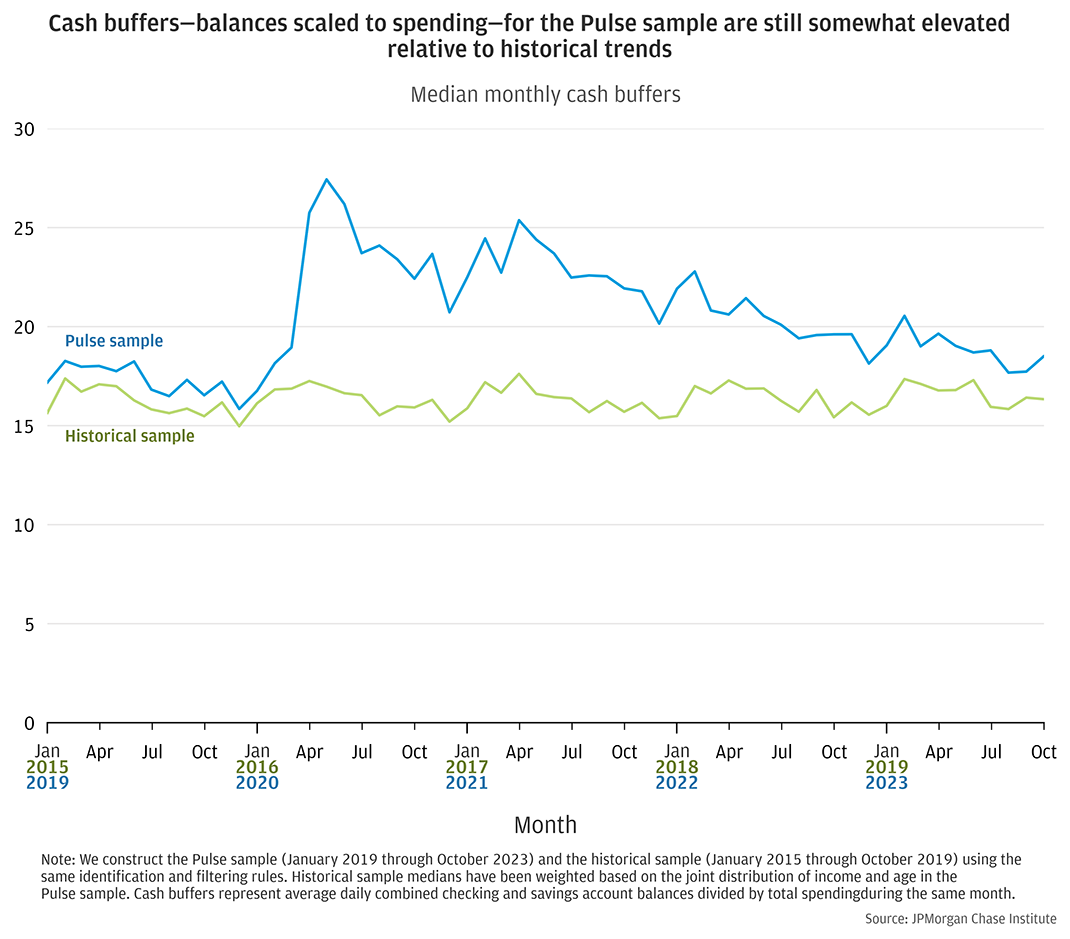
On the other hand, Figure 7 tracks cash buffers—balances scaled to spending—and shows that this metric remains somewhat elevated relative to historical trends as of October 2023. This elevation is small—roughly 2 cash buffer days, compared to a 3-day difference in January—and the two samples had a difference of around 1 cash buffer day during the reference year. If the Pulse sample continues its slightly declining trajectory, cash buffer differences relative to the historical sample may mirror pre-pandemic conditions soon. Alternatively, families may settle on a different post-pandemic cash buffer equilibrium and maintain slightly elevated cash buffers going forward (Wheat and Eckerd 2023).
Figure 6
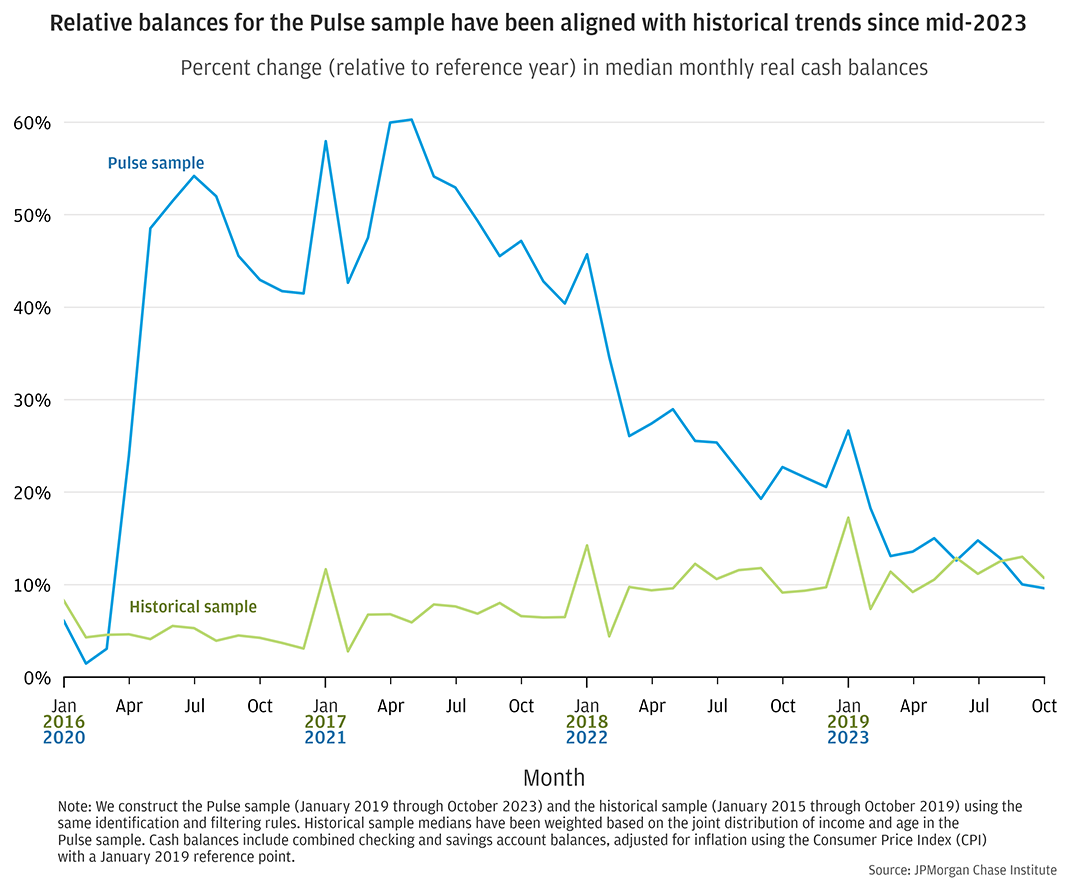
Figure 7
Abdelrahman, Hamza, Luiz E. Oliveira. 2023. “The Rise and Fall of Pandemic Excess Savings.” FRBSF Economic Letter.
Board of Governors of the Federal Reserve Board. 2023. “2022 Survey of Consumer Finances.” Board of Governors of the Federal Reserve System. https://www.federalreserve.gov/econres/scfindex.htm
Cepa, Kennan, Wanjira Chege, Necati Celik, Andrew Warren, Riya Patil. 2023. “2023 U.S. Trends Report: Rising Financial Vulnerability in America.” Financial Health Network. https://finhealthnetwork.org/wp-content/uploads/2023/09/2023-Pulse-U.S.-Trends-Report-Final.pdf
Stettner, Andrew. 2021. “7.5 Million Workers Face Devastating Unemployment Benefits Cliff This Labor Day.” The Century Foundation. https://tcf.org/content/report/7-5-million-workers-face-devastating-unemployment-benefits-cliff-labor-day/?secureweb=WINWORD
U.S. Bureau of Labor Statistics, Consumer Price Index for All Urban Consumers: All Items in U.S. City Average [CPIAUCSL], retrieved from FRED, Federal Reserve Bank of St. Louis.
https://fred.stlouisfed.org/series/CPIAUCSL
U.S. Census Bureau, Current Population Survey, 2020 and 2021 Annual Social and Economic Supplements (CPS ASEC). https://www.census.gov/content/dam/Census/library/visualizations/2021/demo/p60-273/figure1.pdf
Waelter, Anthony, Stephen Rogers. 2023. “State of the US consumer: November 2023.” Deloitte Center for Consumer Industry. https://www2.deloitte.com/us/en/insights/economy/consumer-pulse/state-of-the-us-consumer.html
Wheat, Chris, Erica Deadman. 2022. “Household Pulse through June 2022: Gains for most, but not all.” JPMorgan Chase Institute. https://www.jpmorganchase.com/insights/financial-health-wealth-creation/household-pulse-cash-balances-through-june-2022
Wheat, Chris, George Eckerd. 2023. “Household Cash Buffer Management from the Great Recession through COVID-19.” JPMorgan Chase Institute. https://www.jpmorganchase.com/insights/financial-health-wealth-creation/household-cash-buffer-management-from-the-great-recession-through-covid-19
During the pandemic, the federal government provided cash assistance and relief to households through a range of fiscal interventions. Three rounds of stimulus, or Economic Impact Payments (EIP) provided cash benefits to households earning below specified income thresholds, with payments landing in April 2020, January 2021, and March 2021. Throughout this time, expanded unemployment insurance delivered payments to jobless workers, including gig workers and self-employed workers, with weekly supplements to typical benefits which were phased out in 2021. Finally, the American Rescue Plan increased the dollar amount of Child Tax Credit (CTC) payments and disbursed half of the credit via monthly advance payments from July through December 2021. https://home.treasury.gov/policy-issues/coronavirus/assistance-for-american-families-and-workers/economic-impact-payments https://tcf.org/content/report/7-5-million-workers-face-devastating-unemployment-benefits-cliff-labor-day/
Our Household Pulse data asset covers 8.6 million families who were active checking account users between January 2019 and October 2023 and had at least $12,000 in annual adjusted income—non-transfer inflows into the checking accounts, minus Economic Impact Payments (EIP) and Unemployment Insurance (UI)—deposited to their Chase checking accounts every year in 2019 through 2022.
This methodology does not account for behavioral changes that households may make in response to high inflation, such as reductions in spending. The cash buffer metric used in Household Cash Buffer Management from the Great Recession through COVID-19 does account for reductions in spending, and accordingly provides a complementary view on the recent evolution of household liquidity.
Deloitte’s Consumer Signals longitudinal survey shows that the proportion of Americans feeling anxious about their personal finances increased in September 2023 relative to earlier this year; the Financial Health Network’s Financial Health Pulse shows a greater proportion of Americans feeling financially vulnerable in 2023 relative to 2020 through 2021, with sentiment around short-term savings lower in 2023 than in the prior two years. https://www2.deloitte.com/us/en/insights/economy/consumer-pulse/state-of-the-us-consumer.html https://finhealthnetwork.org/wp-content/uploads/2023/09/2023-Pulse-U.S.-Trends-Report-Final.pdf
We assign households to income quartiles using the methodology introduced in the June 2022 Pulse release (see “Box: Our updated income metrics”). This method uses our adjusted income metric—non-transfer inflows into the checking accounts, minus Economic Impact Payments (EIP) and Unemployment Insurance (UI)—and calculates each household’s relative rank across income for each year in our sample, averaging ranks to determine final quartile.
We use a modeled race metric, classifying households into race groups based on the racial distribution of their Census tract.
Income disparities by race are large and persistent in the U.S., where Asian and White households have notably higher incomes than Hispanic and Black households. Because higher incomes often result in higher cash balances, we facilitate comparisons between race groups by weighting the medians we report based on each group’s joint distribution of income, gender, and age. https://www.census.gov/content/dam/Census/library/visualizations/2021/demo/p60-273/figure1.pdf
Sample filters are applied to ensure the households in our sample use their Chase accounts as primary vehicles for managing their finances. See details in End Note 2. Our Pulse sample is constructed from households that were active Chase accountholders between January 2019 and October 2023. We apply the same identification and filtering rules to construct the comparison sample to analyze data for January 2015 through October 2019.
We thank our research team, specifically Carolyn Gorman and Edward Biggs, for their hard work and contribution to this research. Additionally, we thank Alfonso Zenteno and Robert Caldwell for their support. We are indebted to our internal partners and colleagues, who support delivery of our agenda in a myriad of ways, and acknowledge their contributions to each and all releases.
We are also grateful for the invaluable constructive feedback we received from external experts and partners. We are deeply grateful for their generosity of time, insight, and support.
We would like to acknowledge Jamie Dimon, CEO of JPMorgan Chase & Co., for his vision and leadership in establishing the Institute and enabling the ongoing research agenda. We remain deeply grateful to Peter Scher, Vice Chairman, Tim Berry, Head of Corporate Responsibility, Heather Higginbottom, Head of Research & Policy, and others across the firm for the resources and support to pioneer a new approach to contribute to global economic analysis and insight.
This material is a product of JPMorgan Chase Institute and is provided to you solely for general information purposes. Unless otherwise specifically stated, any views or opinions expressed herein are solely those of the authors listed and may differ from the views and opinions expressed by J.P. Morgan Securities LLC (JPMS) Research Department or other departments or divisions of JPMorgan Chase & Co. or its affiliates. This material is not a product of the Research Department of JPMS. Information has been obtained from sources believed to be reliable, but JPMorgan Chase & Co. or its affiliates and/or subsidiaries (collectively J.P. Morgan) do not warrant its completeness or accuracy. Opinions and estimates constitute our judgment as of the date of this material and are subject to change without notice. No representation or warranty should be made with regard to any computations, graphs, tables, diagrams or commentary in this material, which is provided for illustration/reference purposes only. The data relied on for this report are based on past transactions and may not be indicative of future results. J.P. Morgan assumes no duty to update any information in this material in the event that such information changes. The opinion herein should not be construed as an individual recommendation for any particular client and is not intended as advice or recommendations of particular securities, financial instruments, or strategies for a particular client. This material does not constitute a solicitation or offer in any jurisdiction where such a solicitation is unlawful.
Wheat, Chris, Erica Deadman, Daniel M Sullivan. 2024. “Household Pulse: Balances through October 2023.” JPMorgan Chase Institute.
https://www.jpmorganchase.com/insights/financial-health-wealth-creation/household-pulse-cash-balances-through-october-2023
Authors

Chris Wheat
President, JPMorganChase Institute

Erica Deadman
Consumer Research Lead, JPMorganChase Institute

Daniel M. Sullivan
Consumer Research Director, JPMorganChase Institute