

Figure 1: 92 percent of households can cover a $400 expense shock using some combination of cash savings, disposable income, or use of short-term credit.
Latest news

An Ohio-based company is protecting first responders around the world
With support from JPMorganChase, Fire-Dex is providing protective equipment to firefighters in 100 countries and all 50 states.
Learn moreLatest news

Veteran’s Unconventional Path to Landing her Dream Job in Tech
U.S. Army Veteran Ashley Wigfall transitioned to a civilian role and charted her path to technologist through mentorship and skills training at the JPMorgan Chase tech hub in Plano, Texas.
Learn more
Research
JPMorgan Chase Institute
July 30, 2024
Findings
Recent surveys on the financial resilience of American households—how many live paycheck-to-paycheck and cannot cover emergency expenses—yield contradictory results. The contradiction likely stems from different treatment of cash savings versus disposable income and credit; there are few data sources that can simultaneously examine all these resources. In this report, we analyze de-identified administrative banking data on the most common sources of household liquidity and find that most households can weather a moderate unexpected expense. Our data show that short-term credit and disposable income, which can be diverted from planned discretionary spending, are important sources of liquidity that significantly increase household financial resilience. Short-term credit is especially important for understanding the liquidity of low-income households. When considering the full set of financial resources a household can access, it is difficult to conclude that most American households are living paycheck-to-paycheck.
Notwithstanding its importance to households and policymakers alike, the resilience of households to expense shocks is difficult to measure with precision. In a widely reported 2023 survey, 62 percent of American adults said they were living paycheck-to-paycheck, defined as a “household [relying] on their regular paychecks to meet their expenses and financial obligations, with little or no savings left over.”1 In contrast, the Federal Reserve Board’s Survey of Household Economics and Decisionmaking (SHED) recently reported that only 13 percent of adults would be unable to pay a $400 emergency expense.2 Though these surveys both suggest that a significant fraction of Americans may be vulnerable to an emergency expense, their results are somewhat contradictory; it is difficult to confidently assess how many people are exposed to this vulnerability.
While some aspects of financial security are well covered in prior research, others have been more difficult to evaluate, and there are few data sources that inform how households jointly rely on different sources of liquidity.3 In particular, no public administrative data sources regularly provide a view that informs how households might use cash, credit, and other sources of liquidity in combination to respond to expense shocks.
To fill this gap, we use de-identified administrative banking data to provide a more comprehensive view of households’ financial security by measuring the cash balances, income, spending, and credit access of 5.9 million households. We estimate how many households could weather a hypothetical emergency expense and examine what sources of liquidity they could draw on.
We find that most households have sufficient liquidity to weather moderate expense shocks, and that sources of liquidity beyond cash savings are the key to many households’ ability to weather an emergency expense. Overall, 8 percent of our sample is unable to cover a $400 expense shock by any combination of cash on hand, disposable income, or use of short-term credit.
Additionally, we find that:
These findings have significant implications for experts concerned about the financial resilience of American households.
First, considering cash savings alone as a source of financial resiliency leads to an unnecessarily pessimistic view of financial resilience and how many households are living paycheck-to-paycheck. For example, households that contribute to a retirement plan and have an established rainy-day fund may comfortably spend most of their income every month and still be very resilient to emergency expenses. Our finding that a vast majority of households—including low-income and young households—have enough cash and disposable income to cover emergency expenses contradicts claims that most American households are living “paycheck-to-paycheck.”
Another important lesson from these findings is how important affordable credit access is for financial resilience. This is especially true for larger expenses; removing access to credit cards cuts the number of low-income households able to weather a $1,600 shock by 31 percent (25 percent coverage compared to 37 percent). Moreover, 43 percent of low-income households unable to cover a smaller $400 expense might have been able to do so if they had additional credit access.
Overall, household liquidity is complex, made up of many components and constraints. Our results shed light on several new pieces of the picture, and upcoming Institute research will continue to investigate liquidity dynamics and financial resilience.
Our sample covers 5.9 million households for whom we see financial details via their deposit and credit card accounts. We assess several sources of liquidity, listed here in order from most accessible to least accessible.
We measure the following key metrics on a monthly basis:
Available Cash: The total cash that the household could access through their checking and savings accounts that is available for unexpected expenses. Balances fluctuate widely over the course of a month as households receive income and pay expenses. However, a significant portion of income and cash balances are already earmarked for non-discretionary expenses such as rent and loan payments. To avoid overestimating how much unearmarked savings a household has, we use the 25th percentile of daily balances within a month to proxy for available cash on hand.
Disposable income: In a typical month, households funnel their disposable income (income net of non-discretionary expenditures) into some combination of savings and discretionary spending. When faced with an expense shock, households can divert some of these funds to cover the expense.4
Free use of credit: If the above methods cannot cover the expense, the households can access a portion of their future disposable income by tapping any available credit on their open and current credit cards. If the household has enough disposable income to pay the amount back within one month, then this short-term use of credit does not incur any interest charges.5,6
Low-cost use of credit: If the household has sufficient available credit on their credit cards, but not enough disposable income to pay the amount back within one month, they may revolve the amount and pay it down over time. We classify this as “low-cost” if the household’s disposable income allows them to pay the amount back within three months.7 They will incur up to two months’ of interest charges during that time, which must also be paid for with disposable income.8
We assess these metrics on a sample of households with active JPMorgan Chase checking accounts, defined as households that have at least one checking account with at least five non-transfer transactions per month during our sample window (calendar years 2021 through 2023). To ensure that we have a view into the household’s income, we limit our analysis to households with at least $12,000 in annual take-home income across their deposit accounts during our sample window. We limit our sample to households for whom we can observe and categorize the majority of their spending activity, removing households with more than 20 percent of spending occurring via non-Chase credit card payments. We weight our results on income, matching the income distribution from the Survey of Consumer Finances (SCF).9
Many discussions of liquidity focus on cash balances. The JPMorgan Chase Institute’s Household Pulse series tracks households’ cash reserves over time, assessing alignment with historical expectations following the build-up of excess savings after the COVID-19 pandemic (Wheat et al. 2024). Publicly available metrics also track household savings, measuring excesses relative to pre-pandemic levels (Abdelrahman and Oliveira 2023). Additional research follows trends in cash buffers—balances scaled to spending—and how that metric responds to changes in cash balances (Wheat and Eckerd 2023; Wheat et al. 2024). These reports provide important but incomplete views into household liquidity, focusing primarily on availability of cash. Going beyond available cash, we track additional sources of liquidity to provide a more complete picture of the liquid resources a household can access when unexpected expenses arise. We present our primary findings in stacked bar charts, showing the share of households that are able to cover an expense shock of a specified size by first using available cash, then turning to disposable income if cash cannot fully cover the expense, and finally using credit cards to cover the remainder if necessary.
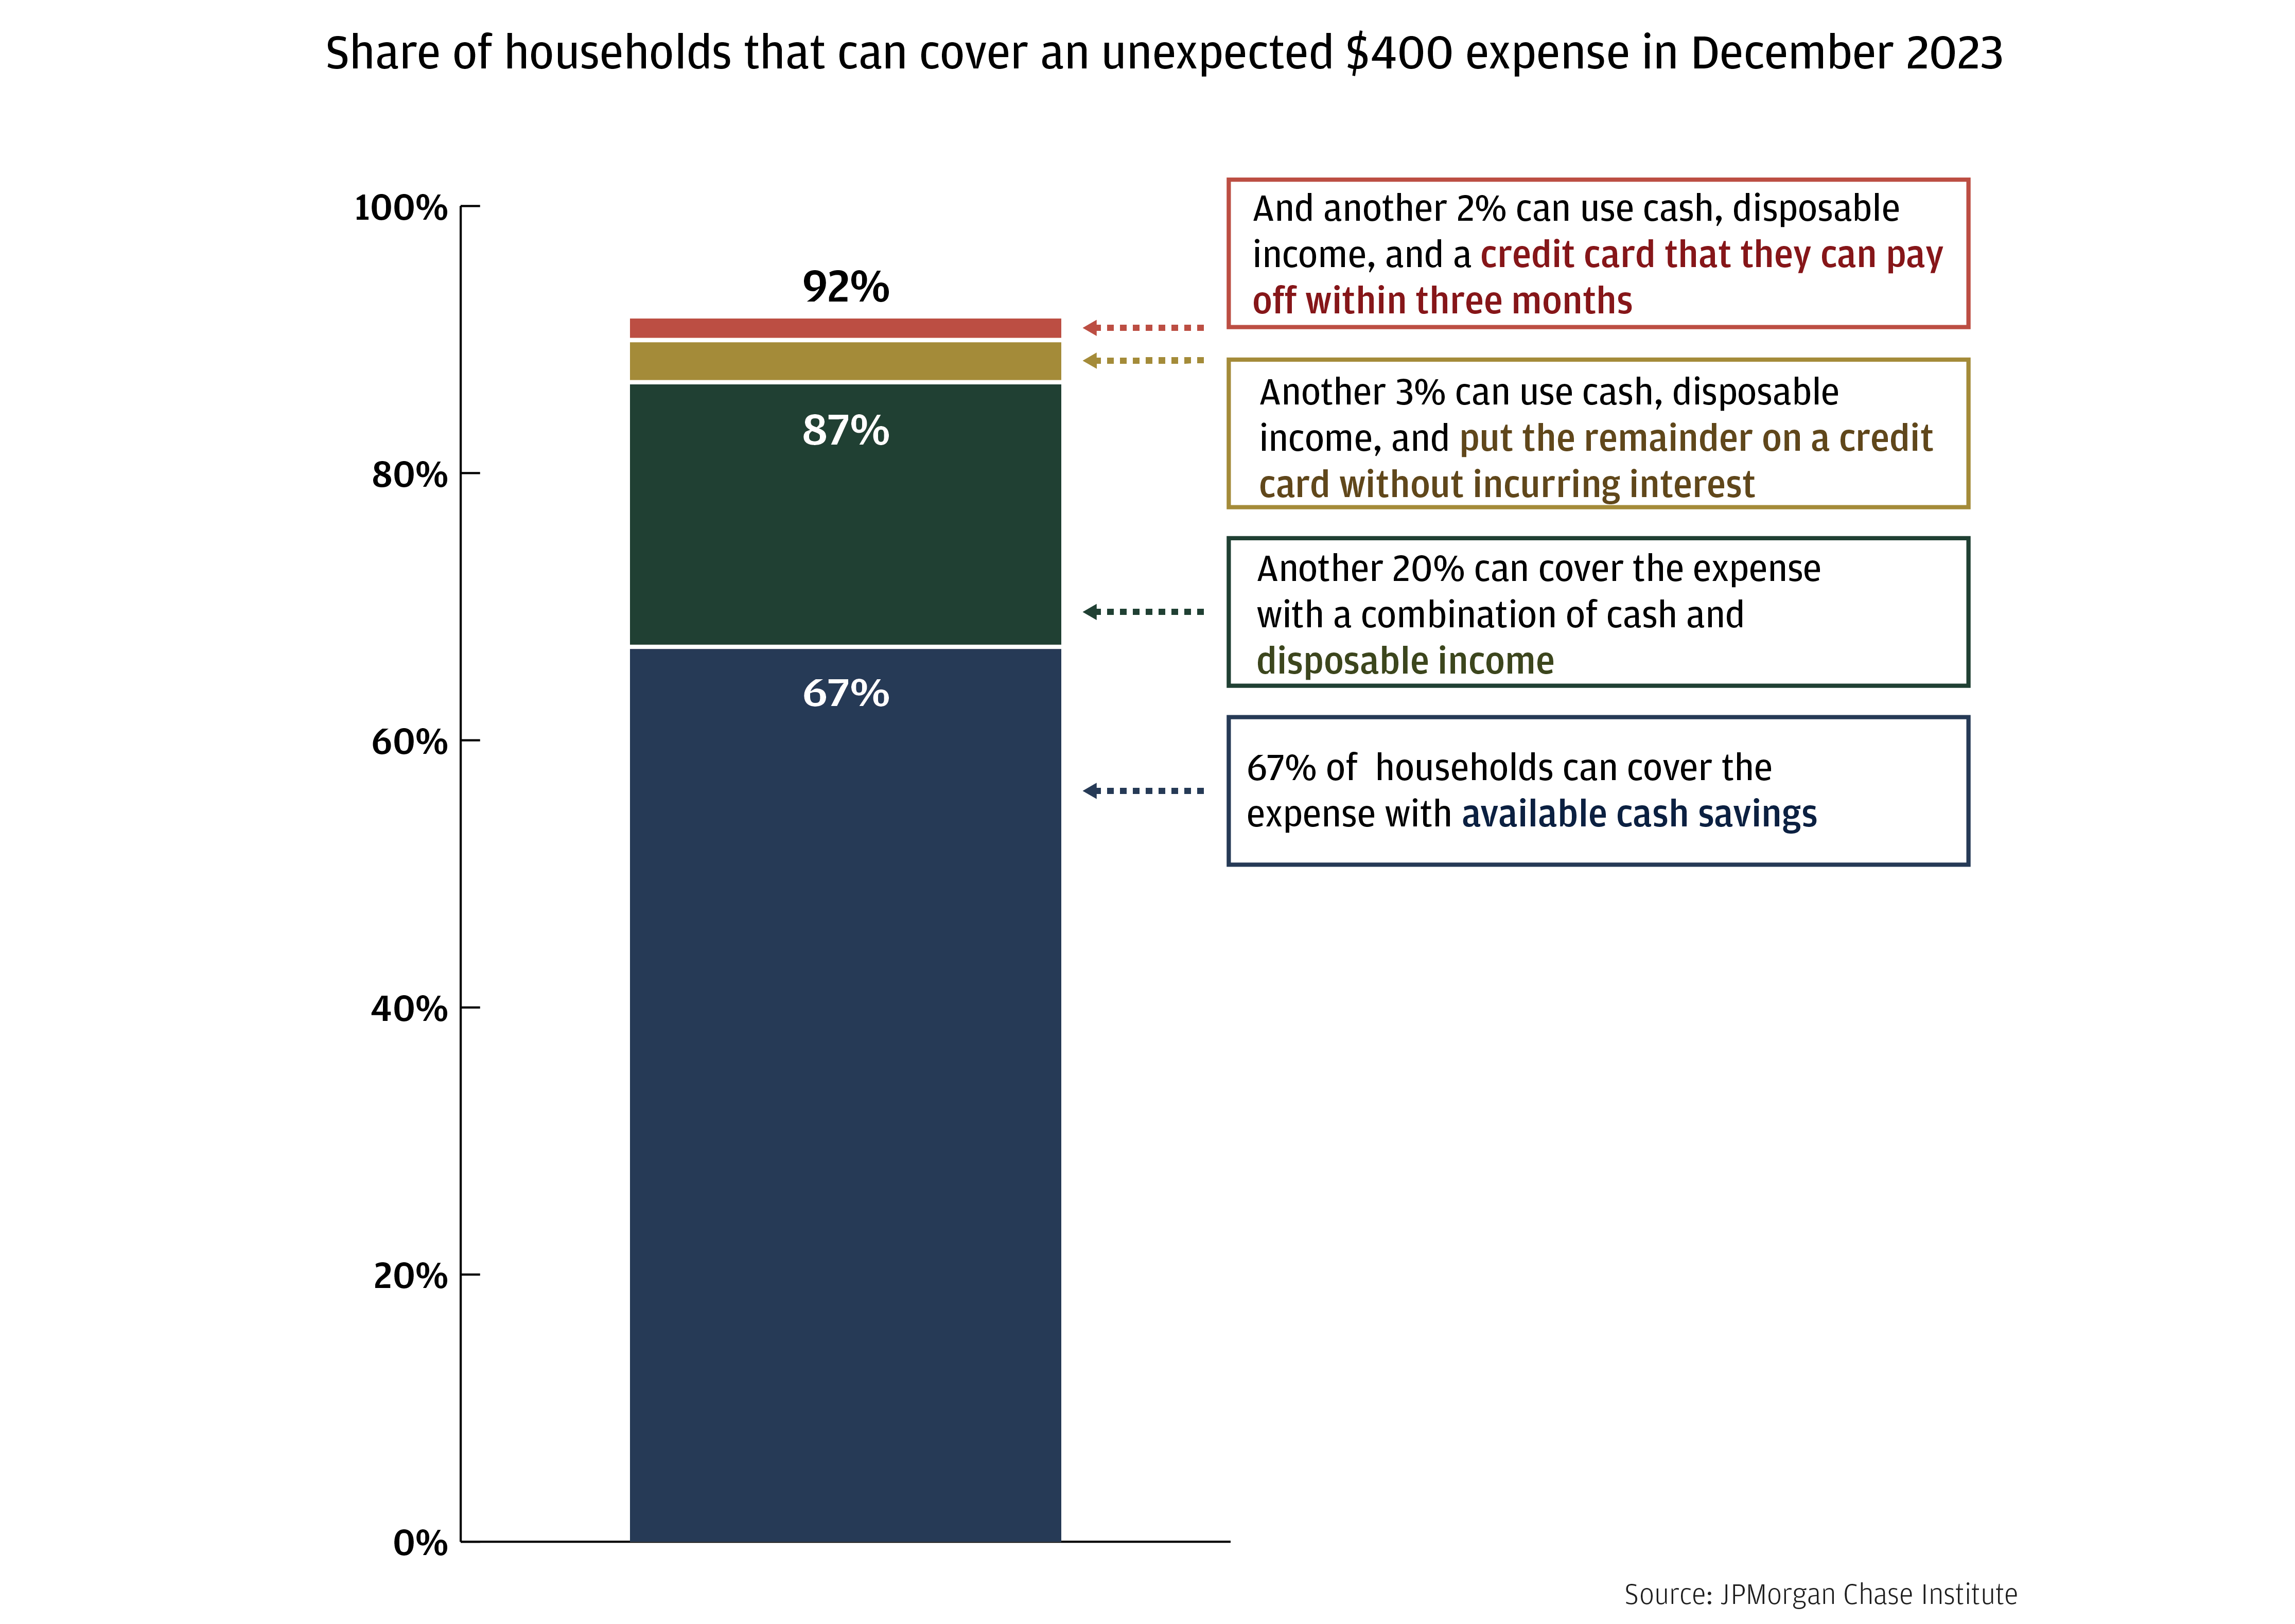
We find that overall, 8 percent of our sample is unable to cover a $400 expense shock by any combination of cash on hand, disposable income, or use of short-term credit (Figure 1). This figure is lower than the latest SHED survey, which reported that 13 percent of households are unable to cover a $400 shock and dramatically lower than the reported 62 percent of households that are living paycheck-to-paycheck. Breaking down the components of our results, we see that 13 percent of households are unable to cover the expense without use of credit cards. If SHED respondents thought of any use of credit as being unable to cover the expense, that could explain some of the differences in outcomes.
Figure 1: 92 percent of households can cover a $400 expense shock using some combination of cash savings, disposable income, or use of short-term credit.
We also find meaningful variation in both the ability of families to cover a $400 expense shock by income, as well as the methods they would use to cover it. Nearly all of the highest-earning households can cover the expense, 99 percent via cash on hand and disposable income (Figure 2). But even among the lowest-earning households, 77 percent are also able to cover a $400 expense. Cash and disposable income don’t go as far for these households: only 43 percent can cover the expense solely via cash on hand, and an additional 22 percent by diverting disposable income. Short-term use of credit cards enables an additional 12 percent of low-income households to cover the expense (7 percent using free single-month credit, and the remaining 5 percent needing to incur some interest fees to pay the amount back over a few months).10
Available credit becomes a more important part of the story for larger unexpected expenses, even for higher-earning households (Figure 3). For the lowest-income households, only 25 percent can cover a $1,600 expense shock using cash or disposable income; short-term use of credit enables and additional 12 percent to cover the expense, still leaving 63 percent unable. While households in the second and third income quartiles are less often unable to cover the expense—35 percent and 15 percent, respectively, cannot cover—access to credit cards plays an important role. While use of credit does not play a large role in their ability to cover a $400 expense shock—enabling 5 percent and 2 percent of households to cover the expense—it becomes a much more impactful lever for larger expenses. Ability to float the expense on a credit card for one to three months enables 17 percent of households in the second income quartile and 13 percent of households in the third income quartile to cover the expense shock, contributing substantially to middle-income households’ ability to cover larger expense shocks.
Figure 2: 77 percent of the lowest-income households can cover an unexpected $400 expense, compared to nearly 100 percent of the highest-income households.
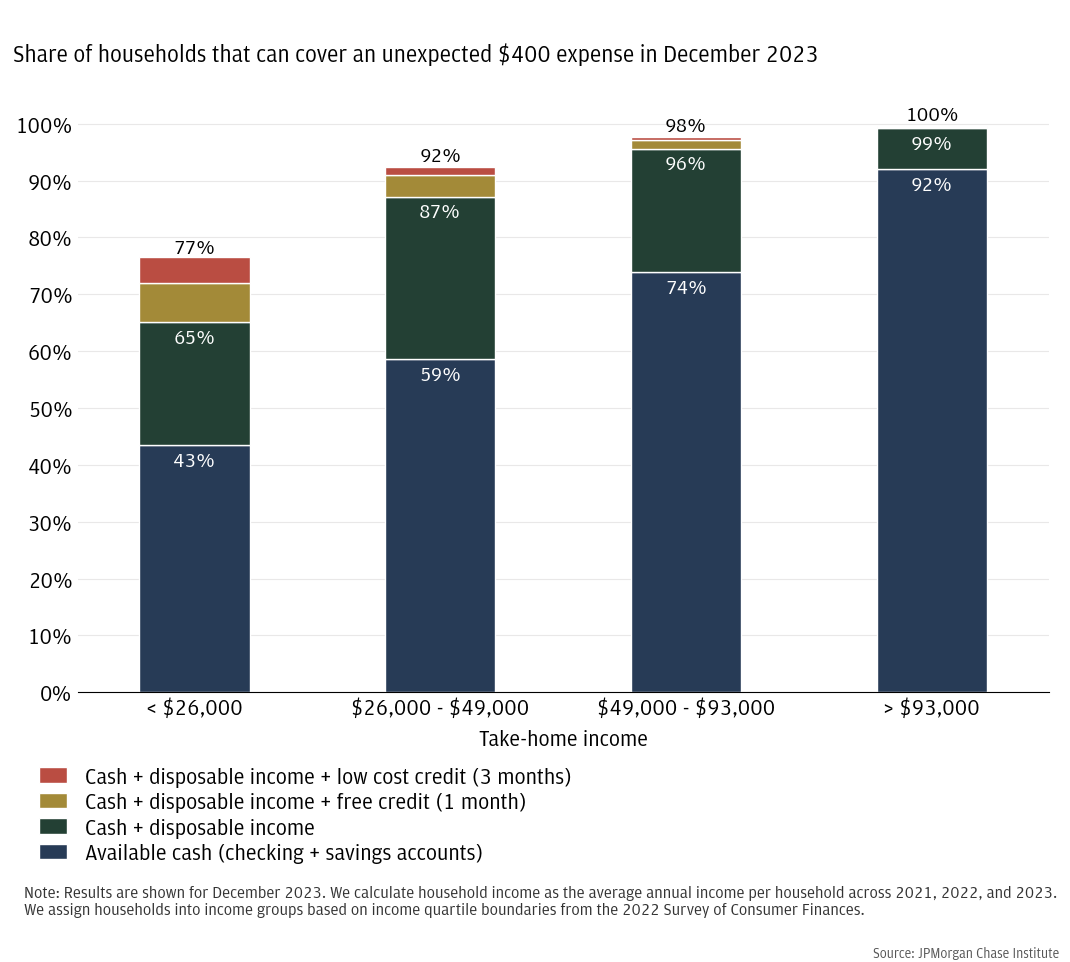
Figure 3: 37 percent of the lowest-income households can cover an unexpected $1,600 expense, compared to 97 percent of the highest-income households.
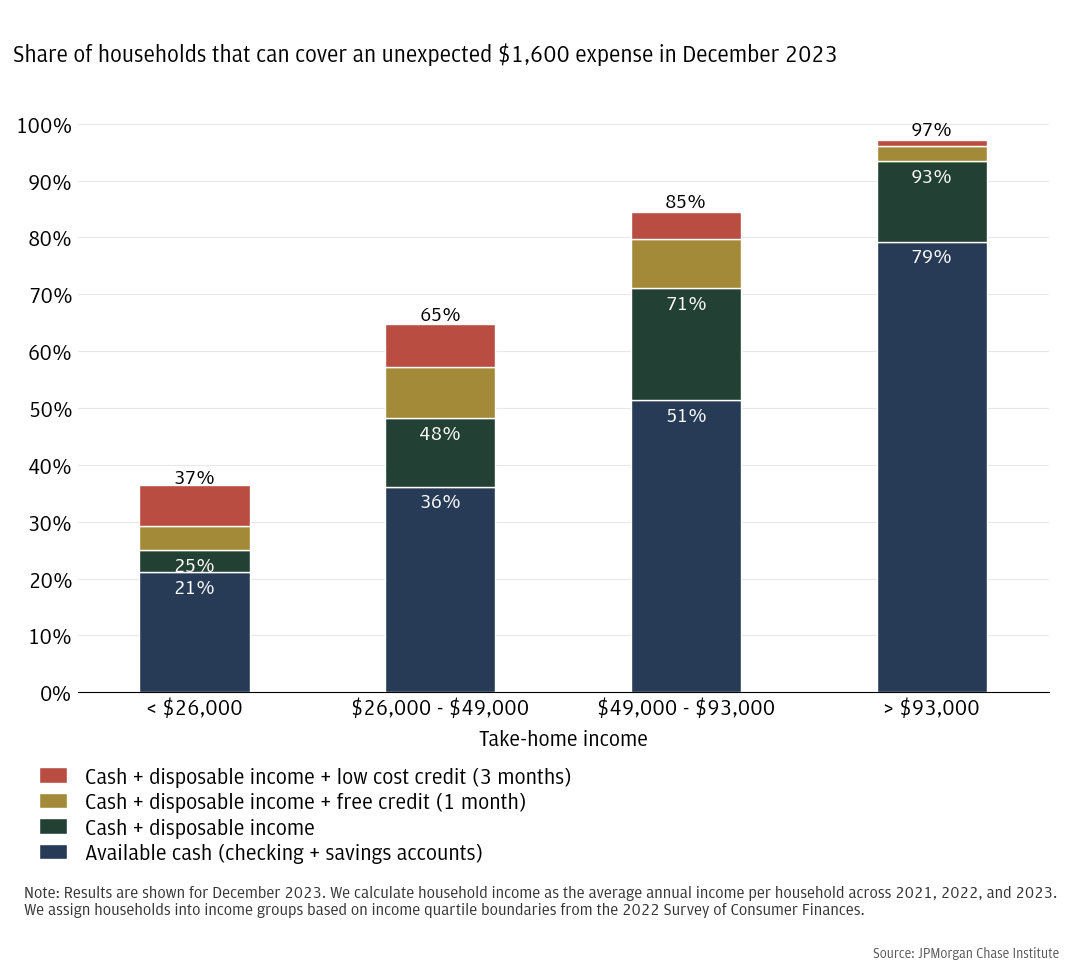
As shown in Finding One, many families may find the use of short-term credit to be an important mechanism for covering expense shocks. For all but the highest-income households, credit enables at least an additional 10 percent of households to cover an unexpected $1,600 expense shock when cash and disposable income fall short. Of course, many households are still unable to cover such an expense, including 63 percent of the lowest-earning households and even 3 percent of the highest-earning households.
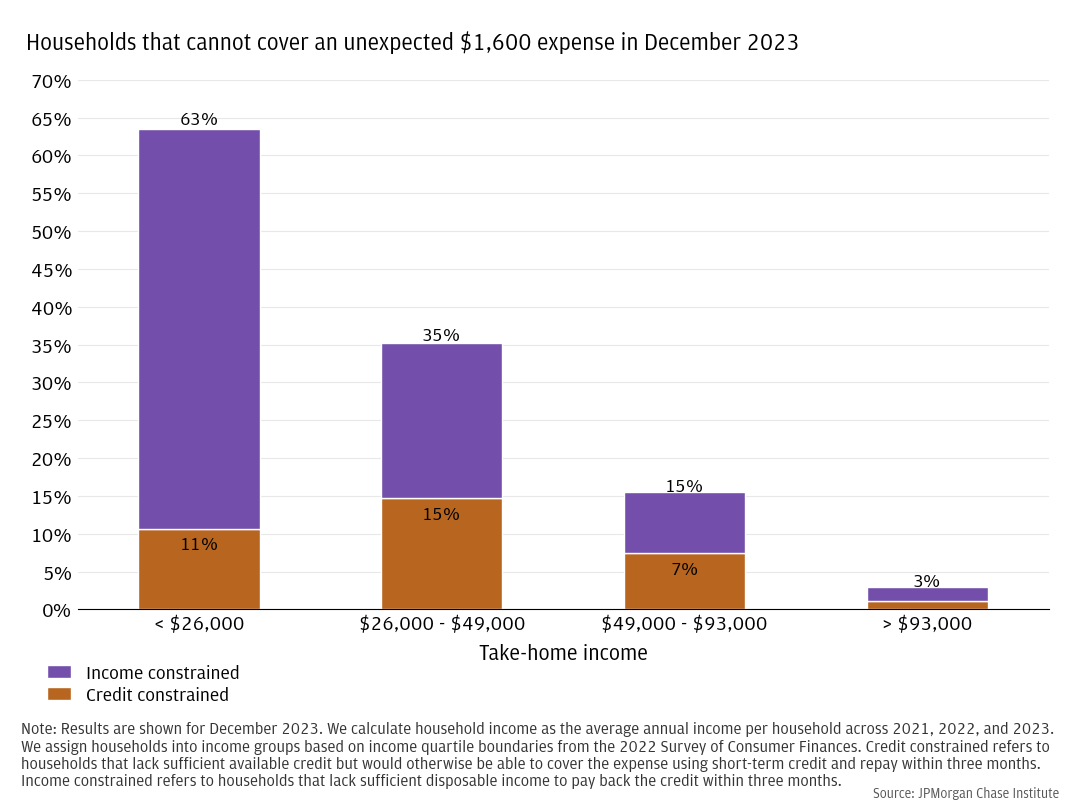
To better understand the households that cannot cover an expense shock, we explore the limiting factor for coverage. If the household had additional available credit to draw on for short-term help, would that enable them to cover the expense? Figure 4 shows the share of households that cannot cover an unexpected $400 expense due to either income constraints or credit constraints. For moderate shocks of $400, 10 percentage points of the total 23 percentage points of households that cannot cover the expense (43 percent) would be able to do so if they had additional credit available. We refer to these households as credit constrained. However, for the remaining households, simply increasing available credit would not solve the problem, as their disposable income is not sufficient to pay back the credit within a three-month window. We refer to these households as income constrained. For larger $1,600 expense shocks, income constraints are the binding factor for the lowest-income households: an additional 11 percent of households could cover the expense with additional available credit, but the remaining 53 percent would still be unable to do so (Figure 5). For households in the top three income quartiles, 37 to 48 percent of the households that cannot cover the $1,600 expense are constrained by credit availability, with the remaining households constrained by disposable income.
Figure 4: 10 percent of the lowest-income households—or 43 percent of those that are unable to weather $400 expense shocks—could pay off such shocks within 3 months with more available credit.
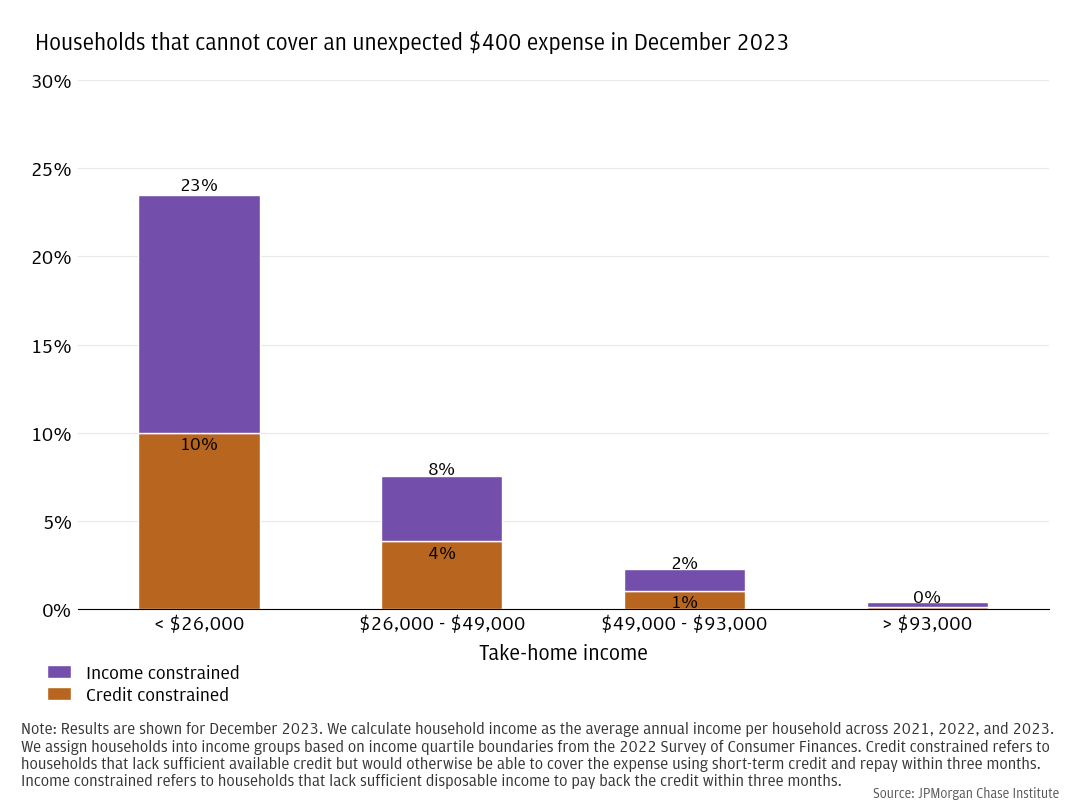
Figure 5: Income constraints, rather than insufficient credit, is the binding factor for the lowest-income households that cannot cover an unexpected $1,600 expense.
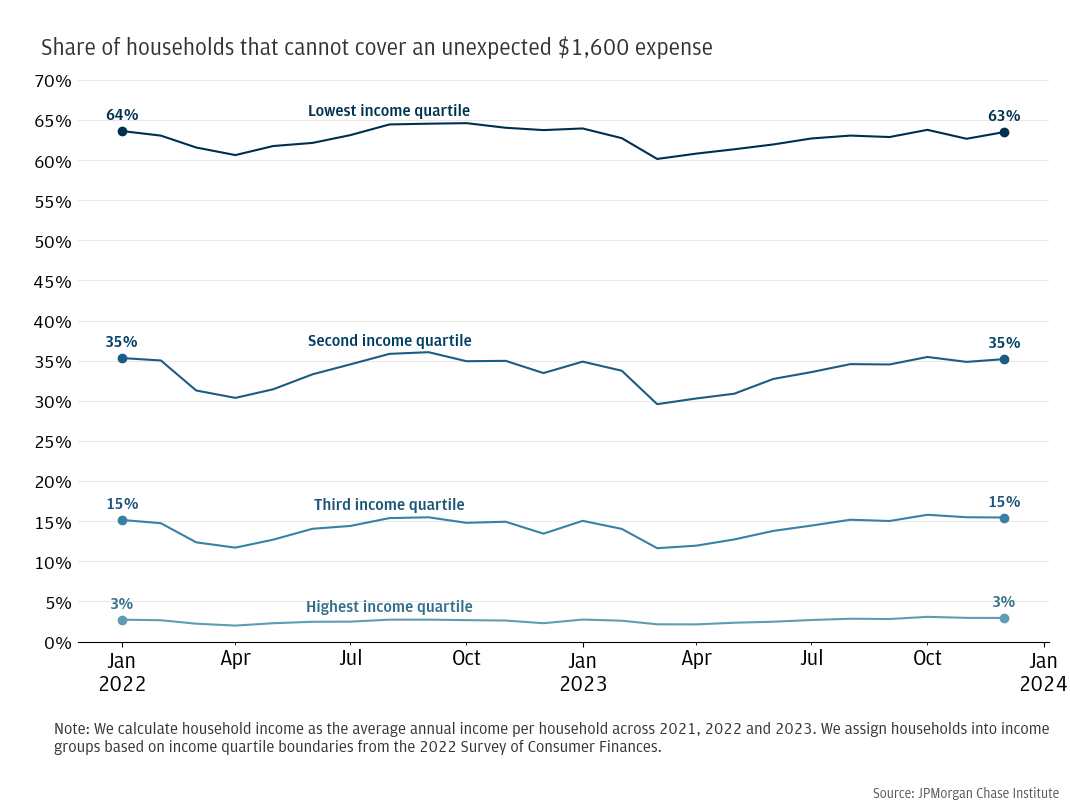
Plotting over time, we see remarkably consistent monthly results throughout 2022 and 2023 (Figures 6 and 7). The proportion of households that are unable to cover an expense shock of a given amount remains steady over time for each income quartile. We observe slight seasonal decreases around March/April each year, coinciding with tax refund timing when cash balances tend to be elevated. Higher than usual cash balances result in fewer households that are unable to cover an unexpected expense, shown by the seasonal decreases in Figures 6 and 7.
We note that broad macroeconomic trends that drove increases in households’ expenses have not resulted in greater shares of households unable to cover expense shocks. From 2022 to 2023, interest rates increased, resulting in larger debt payments and higher credit card interest charges for many households.11 This has also been a time of high inflation, driving up the cost of necessities and causing considerable consumer stress.12 These factors are incorporated in our monthly disposable income calculations (income after debt payments and other non-discretionary expenses such as groceries) as well as in our cost of short-term credit use, where we calculate incurred interest fees based on monthly interest rates. Yet despite rising household expenses, we do not see increases in the share of households that are unable to cover unexpected expenses.
Figure 6: The share of households that cannot cover an unexpected $400 expense has been steady in recent years, with expected seasonal lows around tax time each year, when cash balances tend to be elevated.
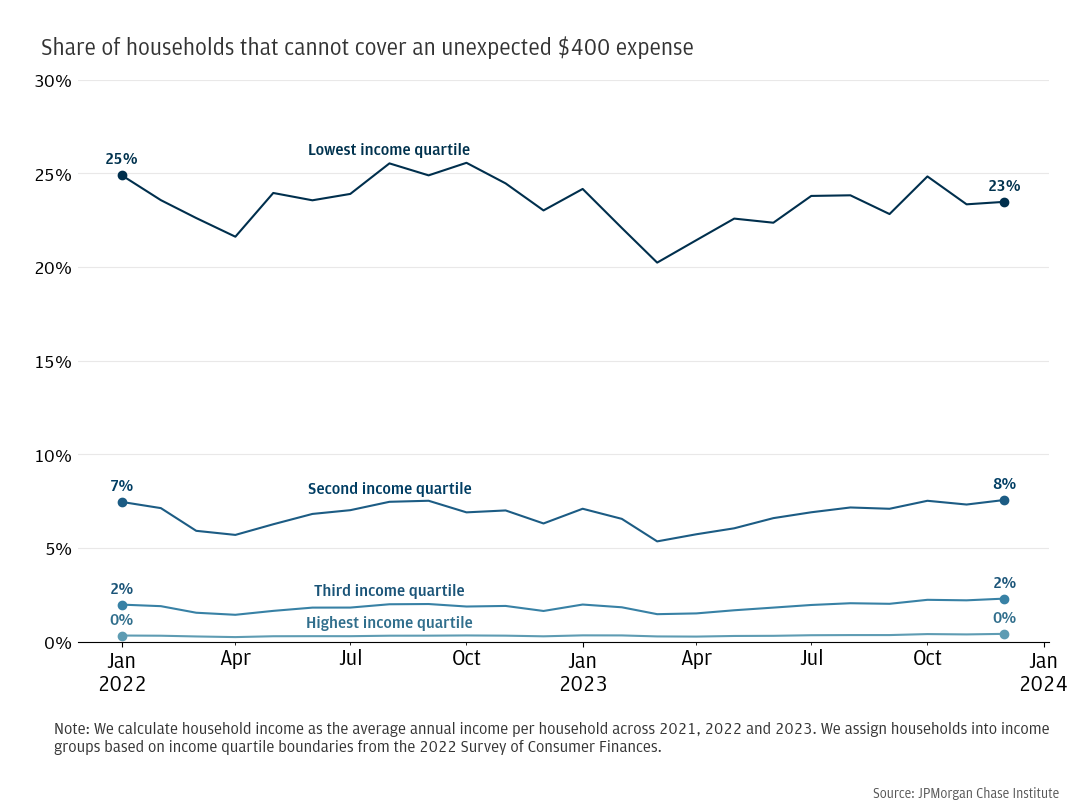
Figure 7: The share of households that cannot cover an unexpected $1,600 expense has been steady in recent years, with expected seasonal lows around tax time each year, when cash balances tend to be elevated.
Differences between race and ethnicity groups in ability to cover an unexpected expense are primarily driven by differences in cash liquidity (Figure 8).13 Across race and ethnicity groups, around 90 percent of households can cover a $400 expense shock (93 percent of Asian and White households, 90 percent of Hispanic households, and 89 percent of Black households), but we see differences in how households cover the expense. 72 percent of Asian households and 71 percent of White households can cover the expense using cash on hand, and an additional 17 to 18 percent would have to use some disposable income to help cover the expense. Hispanic and Black households, on the other hand, have lower cash liquidity: 62 and 59 percent, respectively, can cover the expense using only cash on hand, and an additional 22 to 24 percent would have to use a combination of cash and disposable income to cover the expense. In other words, relative to Asian and White households, Hispanic and Black households are less likely to be able to cover a $400 expense using only cash on hand; however, they make up some of this deficit with a higher proportion of households that can supplement cash with disposable income to cover the expense.
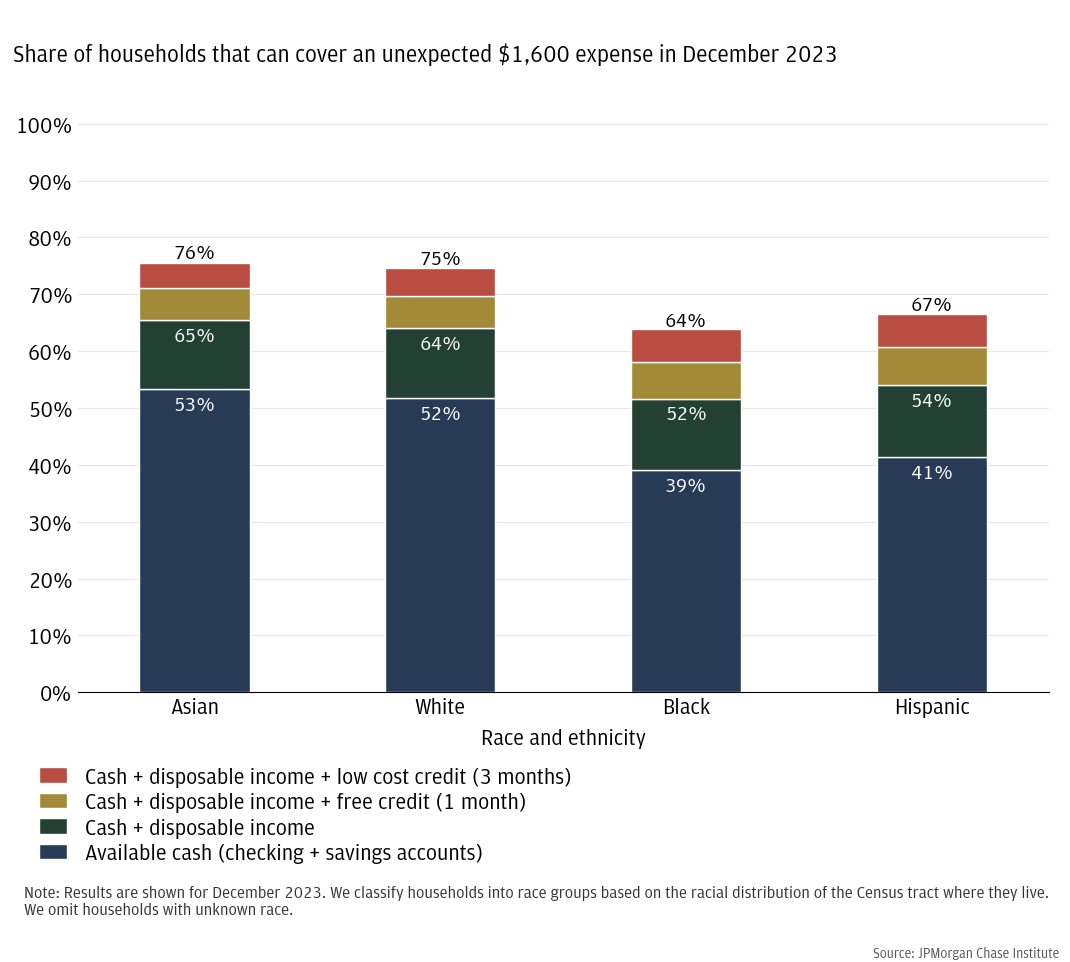
When considering a larger $1,600 expense shock, we only observe differences between race and ethnicity groups in cash on hand coverage rates (Figure 9). Similar to the $400 expense, we observe a roughly 12 percentage point difference in ability to cover the expense using only cash on hand (53 percent of Asian households and 52 percent of White households, compared to 41 percent of Hispanic households and 39 percent of Black households). The remaining coverage methods are consistent across groups, with 12 to 13 percent of households supplementing cash with disposable income, and 10 to 12 percent relying on short-term credit use to cover the remainder of the expense.
Figure 8: Asian and White households are 11 percentage points more likely than Black and Hispanic households to be able to cover a $400 expense shock using available cash, but use of disposable income helps make up the gap for Black and Hispanic households.
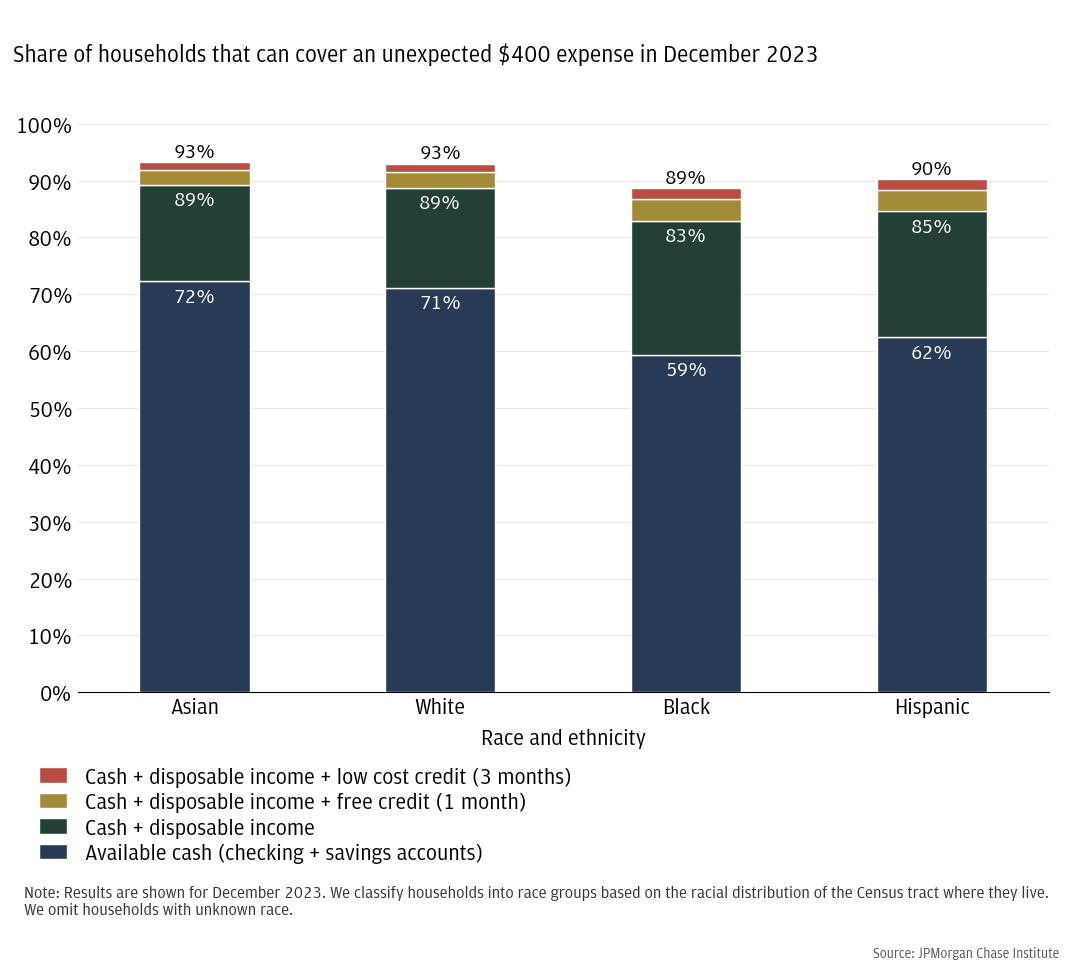
Figure 9: 76 percent of Asian and 75 percent of White households can cover an unexpected $1,600 expense, compared to 67 percent of Hispanic and 64 percent of Black households, and this gap is driven by differences in available cash.
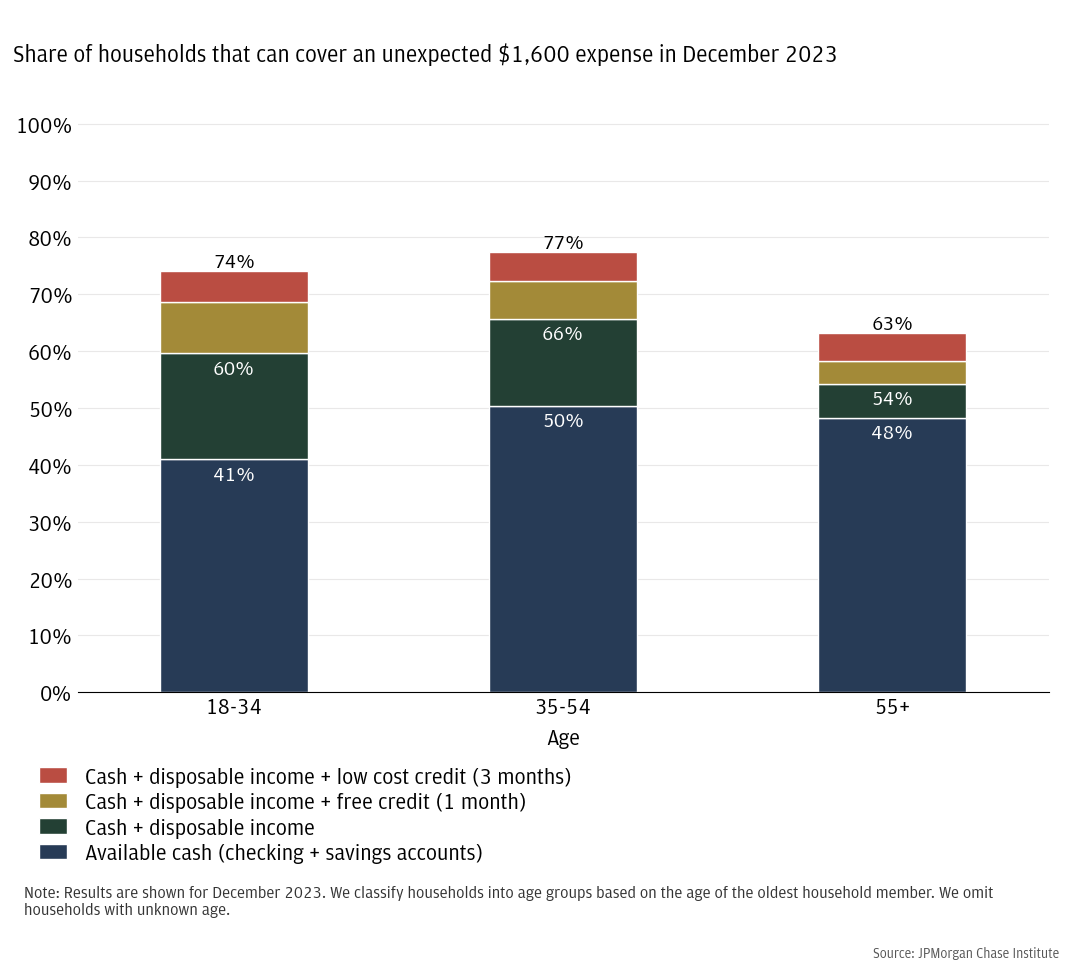
Availability of cash liquidity also plays an important role in differentiating household ability to cover an unexpected expense by age: the oldest households primarily rely on cash to weather expense shocks, whereas younger households can draw on more disposable income to cushion the shocks (Figures 10 and 11). For expenses of $400 or $1,600, the youngest households (ages 18 to 34) are 6 to 9 percentage points less likely to be able to cover the expense using just cash on hand, compared to middle-aged households (35 to 54) and older households (55 and older). But the coverage trends reverse for households that rely on a combination of cash and disposable income to cover the expense, where we see the oldest households come out behind both younger groups. For a $1,600 expense shock, 41 percent of the youngest households can cover the expense using cash on hand, compared to 50 percent of middle-aged households and 48 percent of the oldest households. Younger households are able to supplement available cash with disposable income, enabling an additional 19 percent of the youngest households and 15 percent of middle-aged households to cover the expense. That disposable income can also be leveraged to pay back short-term credit use, covering a further 14 percent of young households and 12 percent of middle-aged households. For the oldest households, however, disposable income only enables an additional 6 percent of households to cover the expense, and a further 9 percent can cover via use of short-term credit. This leaves the oldest households the least able to cover the expense shock, with 37 percent of households unable to cover the expense, compared to 26 percent of the youngest households and 23 percent of middle-aged households. Despite healthy cash reserves, lower disposable income leaves the oldest households more vulnerable to unexpected expenses than their younger counterparts.
Figure 10: Despite having relatively high available cash, lower disposable income results in the oldest households being least able to cover an unexpected $400 expense: 87 percent, compared to 94 percent of middle-aged households and 95 percent of young households.
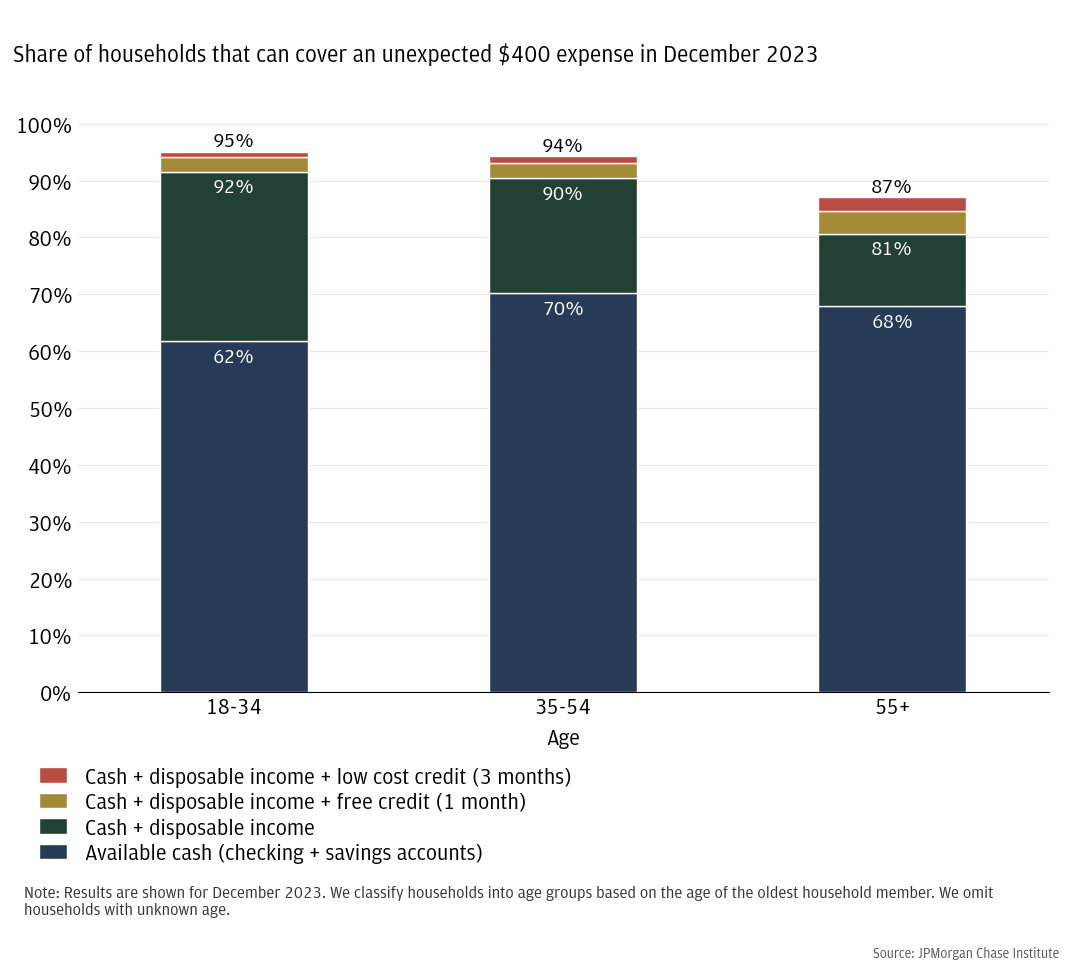
Figure 11: Despite having relatively high available cash, lower disposable income results in the oldest households being least able to cover an unexpected $1,600 expense: 63 percent, compared to 77 percent of middle-aged households and 74 percent of young households.
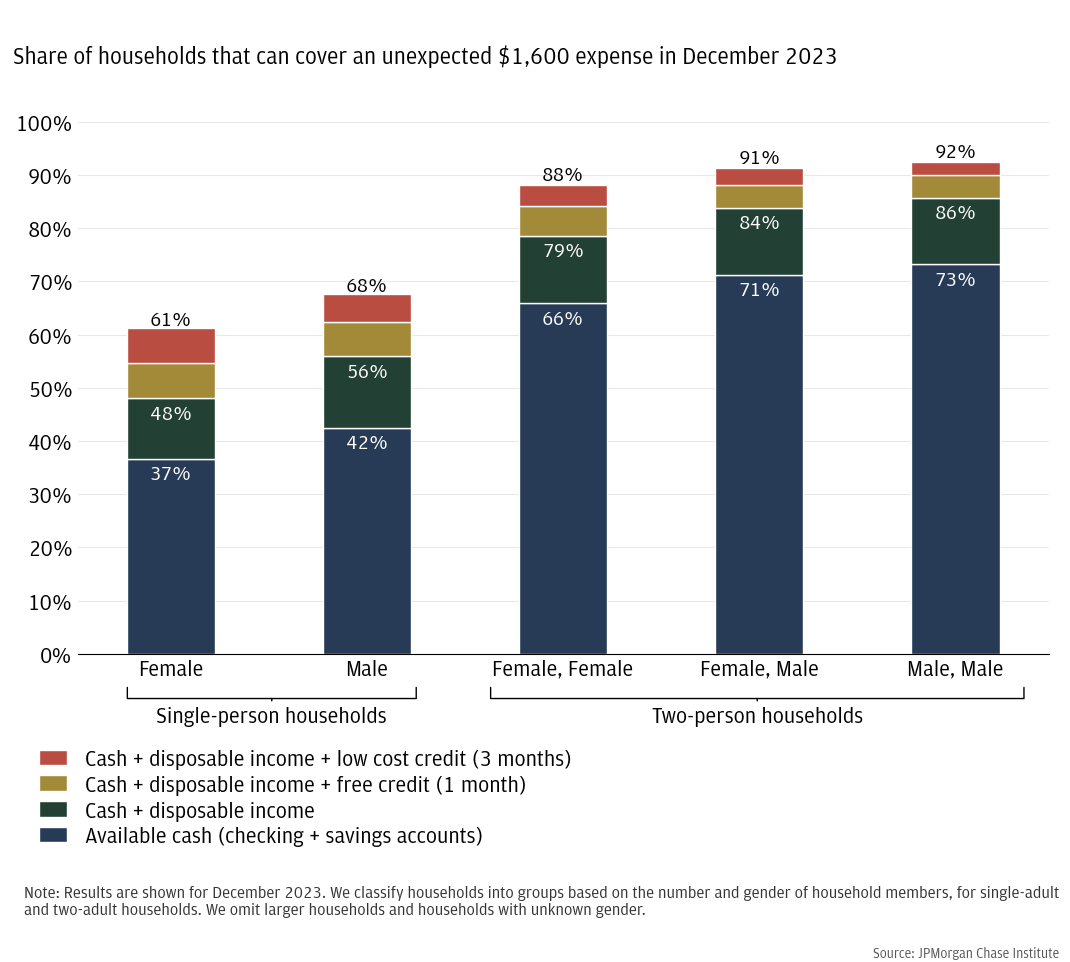
Continuing this pattern, results vary by household size, with two-person households more able to cover emergency expenses than single-person households, and cash liquidity primarily driving the gap (Figures 12 and 13). For large $1,600 emergency expenses, 37 to 42 percent of single-person households can cover the expense using only available cash, compared to 66 to 73 percent of two-person households. An additional 25 percent of single-person households and 19 to 22 percent of two-person households can cover the expense by diverting disposable income or using short-term credit. For a given household size, all-female households are less able to cover a $1,600 expense using only available cash, and slightly less likely to be able to cover the expense at all.
Figure 12: Two-person households are more able to cover a $400 emergency expense than single-person households, and cash liquidity is the primary driver of this gap.
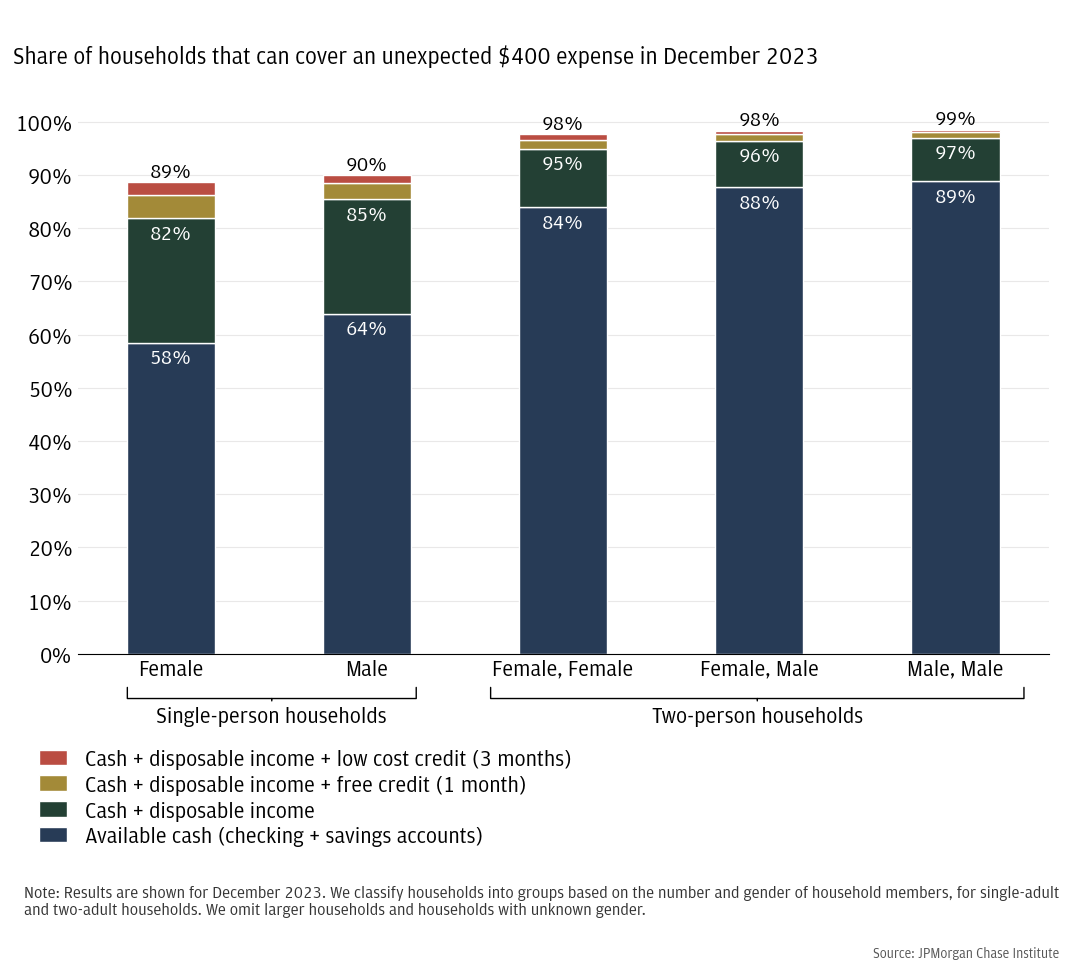
Figure 13: Two-person households are more able to cover a $1,600 emergency expense than single-person households, and cash liquidity is the primary driver of this gap.
The vast majority of households can cover a $400 expense shock using some combination of cash on hand, disposable income, and short-term credit and that has remained consistent over recent years. Overall, 92 percent of households can cover a $400 expense shock, including 77 percent of households in the lowest income quartile. With the exception of small variations around tax time each spring, those proportions have remained remarkably consistent since the start of 2022. Despite recent high inflation and increasing interest rates, household ability to cover expense shocks has not decreased. This holds even for larger $1,600 expense shocks: despite fewer households being able to cover these larger expenses, ability to cover has been consistent during our sample window. However, this could change as inflation, interest rates, and labor market forces continue to evolve. We will revisit these time series assessments in future work, extending our sample window to cover data into 2024 as well as prior to the COVID-19 pandemic.
Credit access plays an important role in financial security, enabling households to weather expense shocks when cash and disposable income fall short. Cash and disposable income are insufficient for many households to cover even small $400 expense shocks. For the lowest-earning households, 11 percent rely in part on short-term credit use to cover the expense. For larger unexpected expenses of $1,600, use of short-term credit enables an additional 14 percent of low-to-medium income households to cover the expense when they otherwise would be unable. Expanding access to credit may further support some households when faced with expense shocks. Of the households in our sample that were unable to cover a $400 expense shock, 43 percent would have been able to cover the expense if they had more available credit. However, if those households had higher credit limits on their open credit cards, we cannot know whether that additional credit would be available for use when an expense shock arises. It is possible that households would increase their credit usage and reach a new equilibrium at a higher balance, thus still falling short of the needed available credit when the unexpected expense occurs. Additional research is needed to establish whether additional credit line would remain open—and thus available for use in the event of a shock—or get used on non-emergency expenditures and thus be unavailable to help with future expense shocks.
Cash balances alone under-estimate a household’s resilience to unexpected expenses. While measurement of cash balances has been an important part of tracking household financial health in the aftermath of the COVID-19 pandemic, cash reserves are not households’ only source of financial stability. This report shows that available cash is important as one method for covering unexpected expenses, enabling households to weather financial shocks. It also shows that many households rely on repurposing disposable income and utilizing short-term credit in order to cover unexpected expenses. These latter methods of expense coverage supplement available cash, enabling many incremental households to weather expense shocks. For example, for households in the lowest three income quartiles facing a $1,600 unexpected expense, roughly 42 percent of households that can cover the expense would do so in part via repurposing disposable income and using short-term credit. In other words, accounting for these additional methods of expense coverage allows us to see a more complete picture of how households can cover unexpected expenses and which groups are able to do so.
Groups with less available cash are less able to cover expense shocks and more reliant on reallocating disposable income and using short-term credit, resulting in decreased near-term savings and additional interest charges. Households with low cash on hand are particularly vulnerable to unexpected expense shocks, either incurring negative secondary financial effects in order to weather the shock, or unable to cover the amount at all. This includes households with the lowest incomes, Black and Hispanic households, single-person households, and households aged 55 and over.
Figure A1
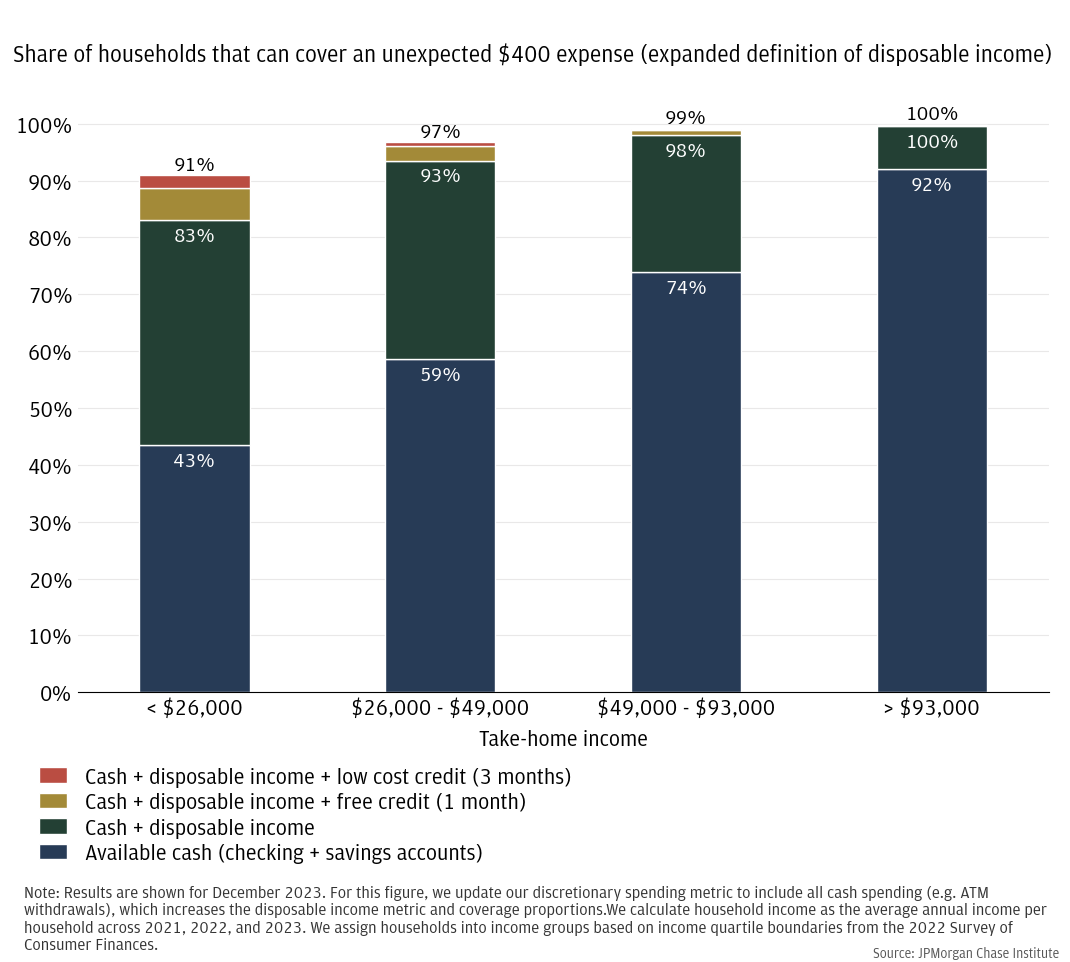
Figure A2
Abdelrahman, Hamza, Luiz E. Oliveira. 2023. “The Rise and Fall of Pandemic Excess Savings.” FRBSF Economic Letter. https://www.frbsf.org/economic-research/publications/economic-letter/2023/may/rise-and-fall-of-pandemic-excess-savings/
Baugh, Brian, Itzhak Ben-David, Hoonsuk Park, Jonathan A. Parker. 2018. “Asymmetric Consumption Smoothing.” National Bureau of Economic Research Working Paper 25086. http://www.nber.org/papers/w25086
Wheat, Chris, Erica Deadman, Daniel M. Sullivan. 2024. “Household Pulse: Balances through February 2024.” JPMorgan Chase Institute. https://www.jpmorganchase.com/institute/all-topics/financial-health-wealth-creation/household-pulse-balances-through-february-2024
Wheat, Chris, Erica Deadman, Daniel M Sullivan. 2022. “How families used the advanced Child Tax Credit.” JPMorgan Chase Institute. https://www.jpmorganchase.com/institute/all-topics/financial-health-wealth-creation/how-families-used-advanced-CTC
Wheat, Chris, George Eckerd. 2023. “Household Cash Buffer Management from the Great Recession through COVID-19.” JPMorgan Chase Institute. https://www.jpmorganchase.com/institute/all-topics/financial-health-wealth-creation/household-cash-buffer-management-from-the-great-recession-through-covid-19
We thank Bernard Ho for his hard work and contribution to this research. Additionally, we thank Alfonso Zenteno, Annabel Jouard, and Oscar Cruz for their support. We are indebted to our internal partners and colleagues, who support delivery of our agenda in a myriad of ways and acknowledge their contributions to each and all releases.
We would like to acknowledge Jamie Dimon, CEO of JPMorgan Chase & Co., for his vision and leadership in establishing the Institute and enabling the ongoing research agenda. We remain deeply grateful to Peter Scher, Vice Chairman; Tim Berry, Head of Corporate Responsibility; Heather Higginbottom, Head of Research, Policy, and Insights and others across the firm for the resources and support to pioneer a new approach to contribute to global economic analysis and insight
This material is a product of JPMorganChase Institute and is provided to you solely for general information purposes. Unless otherwise specifically stated, any views or opinions expressed herein are solely those of the authors listed and may differ from the views and opinions expressed by J.P. Morgan Securities LLC (JPMS) Research Department or other departments or divisions of JPMorgan Chase & Co. or its affiliates. This material is not a product of the Research Department of JPMS. Information has been obtained from sources believed to be reliable, but JPMorgan Chase & Co. or its affiliates and/or subsidiaries (collectively J.P. Morgan) do not warrant its completeness or accuracy. Opinions and estimates constitute our judgment as of the date of this material and are subject to change without notice. No representation or warranty should be made with regard to any computations, graphs, tables, diagrams or commentary in this material, which is provided for illustration/reference purposes only. The data relied on for this report are based on past transactions and may not be indicative of future results. J.P. Morgan assumes no duty to update any information in this material in the event that such information changes. The opinion herein should not be construed as an individual recommendation for any particular client and is not intended as advice or recommendations of particular securities, financial instruments, or strategies for a particular client. This material does not constitute a solicitation or offer in any jurisdiction where such a solicitation is unlawful.
Footnotes
https://www.cnbc.com/2023/10/31/62percent-of-americans-still-live-paycheck-to-paycheck-amid-inflation.html
https://www.pymnts.com/consumer-finance/2022/what-is-paycheck-to-paycheck/
Household cash balances are well documented via publicly available data such as the Personal Saving Rate data series from the Bureau of Economic Analysis, as well as administrative sources such as the JPMorgan Chase Institute’s Household Pulse series (Wheat et al. 2024). Access to credit is frequently covered by the New York Fed through its Consumer Credit Panel, as well as its Survey of Consumer Expectations' (SCE) Credit Access Survey, which tracks credit application rates and outcomes over time.
Non-discretionary expenditures include debt payments and necessary spending, such as groceries, healthcare, utilities, and rent. Discretionary spending includes categories such as restaurants, travel, and entertainment. Our disposable income metric uses 75 percent of discretionary spending; in other words, we assume that 75 percent of the household’s monthly discretionary spending can be redirected to help cover expense shocks.
If the households’ credit cards already carry a revolving balance, then there is no additional interest-free grace period for new purchases, and new purchases begin accruing interest immediately. Our “free use of credit” metric assumes that all households are using credit cards that do not currently carry revolving balances. Our data cannot differentiate cards with revolving balances from those without, and we therefore cannot determine the interest cost of the first billing cycle of credit card use on a household-by-household basis. But using a conservative assumption that all credit cards contain revolving balances, we find that our results are not noticeably affected: assigning half a month of interest fees to all households during the first billing cycle (assuming a mid-cycle purchase date), our results do not change substantively. We observe less than 0.1 percent difference in the share of households able to cover a $400 or $1,600 expense using one month of credit, and the share of households able to cover the expense overall. Intuitively, this is unsurprising since 15 days of interest is small relative to the expense shocks we are considering: with a 23 percent APR and a $400 purchase, 15 days of compounded interest is less than $4, and we suppose that households with disposable income will not put the entire $400 expense on a credit card. Since our results are robust to these two options, we assume households will pay no interest for the first billing cycle of credit card use.
https://www.nerdwallet.com/article/credit-cards/credit-card-grace-period
The amount of time between making a purchase on a credit card and having to pay back that purchase will be at least 21 days, the legally required minimum number of days between the last day of the billing period and the payment due date. For purchases made before the end of the billing period, the gap between purchase date and payment due date is often a month or longer and can be as much as seven or eight weeks. We simplify this by referring to paying the purchase back “within one month.”
While credit card APRs are often high relative to other types of loans, limiting to two months of interest charges minimizes the amount paid in interest, and households are only considered able to use this option if their disposable income can cover the full purchase plus interest repayment within the timeframe. We also note that the other option for immediate short-term loans are payday lenders, which have shorter repayment periods and much higher rates. Per CFPB data, a “typical two-week payday loan with a $15 per $100 fee equates to an annual percentage rate (APR) of almost 400 percent.”
https://www.consumerfinance.gov/ask-cfpb/what-is-a-payday-loan-en-1567/
We source credit card interest rates from the Board of Governors of the Federal Reserve System (US), Commercial Bank Interest Rate on Credit Card Plans. Our calculations vary interest rate over time based on these monthly rates. https://fred.stlouisfed.org/series/TERMCBCCALLNS
The SCF measures pre-tax income, whereas we observe take-home income in our data. We apply a tax withholding rate of 22 percent to approximate pre-tax income when weighting results to match the SCF income distribution. https://www.federalreserve.gov/econres/scfindex.htm
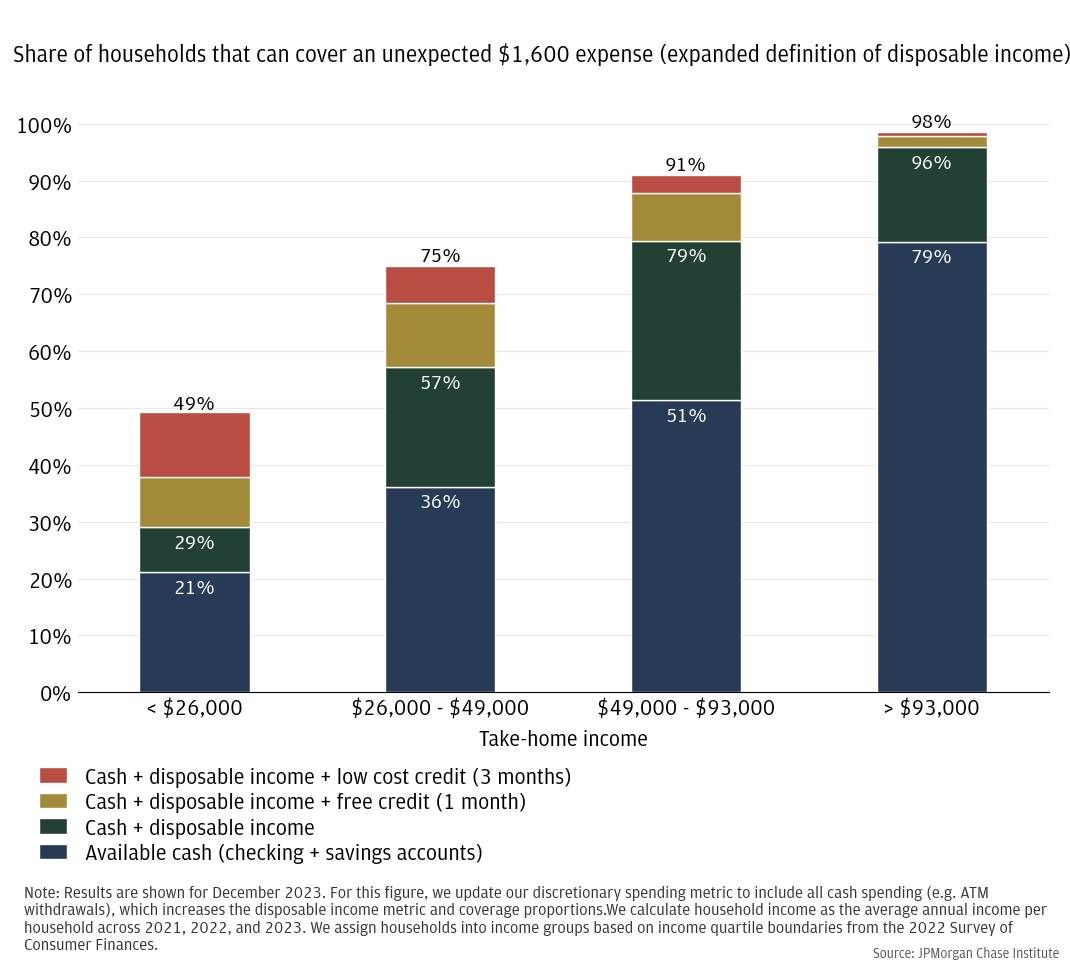
Our discretionary spending metric does not include cash withdrawals from the household’s accounts, because we cannot classify what that cash gets used for. If we assumed that all cash was used for discretionary spending, and updated our metric accordingly, the coverage numbers for the lowest-income households would increase. The same 43 percent would cover the unexpected $400 expense using cash on hand, but an additional 40 percent (compared to the original 22 percent) could cover the expense with the help of disposable income, and a final 8 percent (compared to 11 percent) could cover with the help of short-term credit. For the lowest-income households, the proportion that cannot cover the $400 expense would decrease from 23 percent to 9 percent. Overall, if we classify all cash uses as discretionary, the share of households that cannot cover a $400 expense shock would decrease from 8 percent to 3 percent, and from 29 percent to 22 percent for a $1,600 expense shock. See Appendix Figures A1 and A2.
U.S. Bureau of Economic Analysis, Personal interest payments [B069RC1], retrieved from FRED, Federal Reserve Bank of St. Louis; June 9, 2024.
Inflation over time: https://www.statista.com/statistics/273418/unadjusted-monthly-inflation-rate-in-the-us/
Consumer sentiment: The Financial Health Network’s Financial Health Pulse shows a greater proportion of Americans feeling financially vulnerable in 2023 relative to 2020 through 2021, with sentiment around short-term savings lower in 2023 than in the prior two years. https://finhealthnetwork.org/wp-content/uploads/2023/09/2023-Pulse-U.S.-Trends-Report-Final.pdf
Racial differences in cash liquidity are well-established. See the latest JPMorgan Chase Institute Household Pulse for cash balance levels and trends by race and ethnicity, and further discussion: https://www.jpmorganchase.com/institute/all-topics/financial-health-wealth-creation/household-pulse-balances-through-february-2024
Authors

Chris Wheat
President, JPMorganChase Institute

Erica Deadman
Consumer Research Lead, JPMorganChase Institute

Daniel M. Sullivan
Consumer Research Director, JPMorganChase Institute