

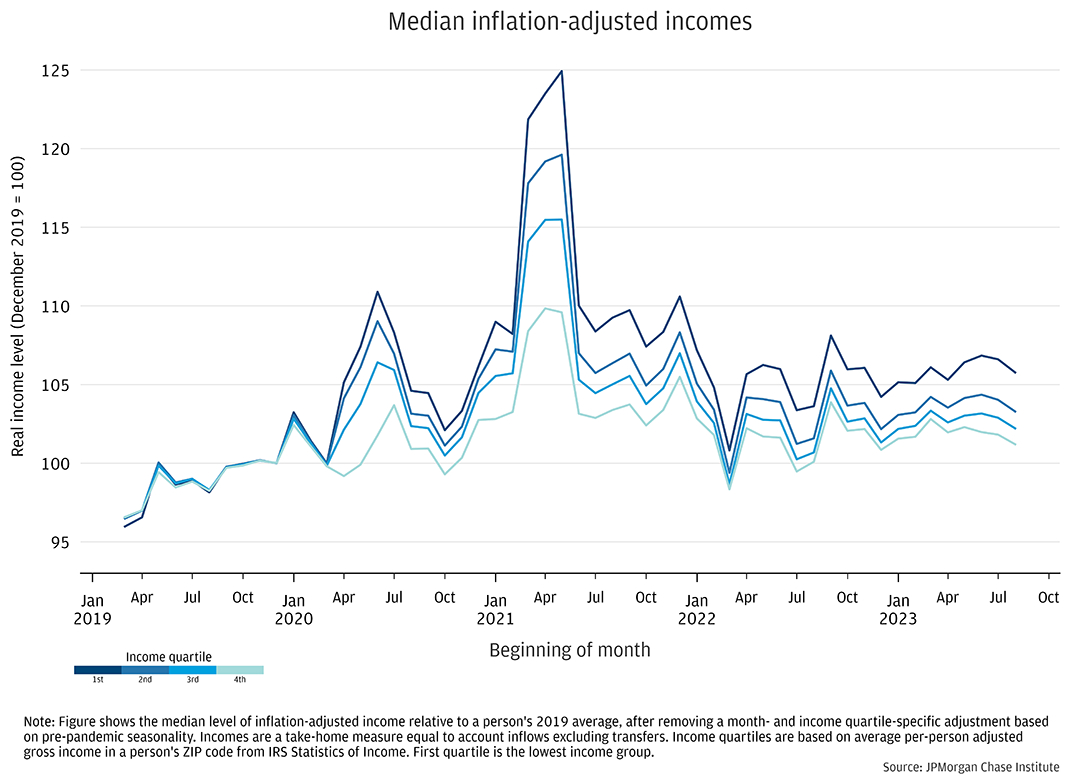
Figure 1: Those with lower incomes sustain relative gains compared to pre-pandemic levels, but real income growth has been minimal since early 2022 across the distribution.
Latest news

An Ohio-based company is protecting first responders around the world
With support from JPMorganChase, Fire-Dex is providing protective equipment to firefighters in 100 countries and all 50 states.
Learn moreLatest news

Veteran’s Unconventional Path to Landing her Dream Job in Tech
U.S. Army Veteran Ashley Wigfall transitioned to a civilian role and charted her path to technologist through mentorship and skills training at the JPMorgan Chase tech hub in Plano, Texas.
Learn more
The labor market remains strong, but high inflation has partially eroded the purchasing power of nominal income gains. Indicators of how much incomes have (or haven’t) increased relative to consumer prices since the pandemic—and which workers are faring best—can vary significantly across public data sources, as discussed in a recent report from the Hamilton Project1. Part of the measurement challenge is a result of pandemic era economic volatility. For example, notable changes in the composition of the working population has distorted some of the most regularly cited metrics of wage growth, and other data sets have relatively small sample sizes or lack direct insight into subsets of workers over a multi-year period2. This brief helps address these hurdles by using a large granular dataset that allows us to track how individuals’ incomes have changed since prior to the pandemic and breaks down trends by income level and race.
Our analysis uses de-identified data covering income dynamics of 8 million individuals. The sample spans a five-year period ending in August 2023 3. We estimate real income growth by income quartiles, and we use a subset of our overall data set with self-reported race information to provide another lens on income inequality dynamics. To reduce potential bias in our individual-level growth estimates coming from categorizing individuals by income, we use an individual’s location, specifically their ZIP code of residence, as a proxy for income strata (see box below for details). The multi-year panel perspective centers the analysis on typical dynamics experienced by workers in their take-home pay. We adjust for changes in consumer prices using the Consumer Price Index (CPI), to track the current purchasing power of inflows4.
Figure 1 shows the median change in the level of real take-home pay in our sample from 2019 through August 2023 by income quartile. As described in earlier analysis covering pandemic era dynamics, fiscal stimulus provided financial boosts that were larger in percentage terms for those with lower incomes, explaining the sharpness of the increases for these populations in mid-2020 and the first half of 20215. Real incomes subsequently gravitated back to their 2019 baseline as stimulus faded and inflation rose. Since the start of this year, purchasing power has trended modestly higher for all income groups, with marginal relative gains for the lowest income quartile. This dynamic is directionally consistent with prior research that tight labor markets tend to provide benefits for those with lower average incomes. On net, we estimate that the lowest income quartile had real incomes 6 percent higher than December 2019 for the three months ending in August 2023, compared to a gain of just 1 percent for the top income quartile.
Figure 1: Those with lower incomes sustain relative gains compared to pre-pandemic levels, but real income growth has been minimal since early 2022 across the distribution.
We use individual-level panel data to compute income growth, but for this analysis (as in prior Institute reports on income growth) we do not group individuals by their observed income. Instead, we categorize households by the average per-person incomes in their ZIP Code, according to IRS Statistics of Income reports. This grouping method reduces the potential for (non-economic) volatility in our data to introduce bias in growth rates by income tier; for example, if a typically high-income household experiences a temporary interruption in observed inflows—which can occur if an individual operates multiple checking accounts—we could erroneously categorize them as low-income and later over-estimate income growth.
While this methodology reduces bias coming from income volatility, grouping by average incomes in an individual’s ZIP code may understate true differences across the population. That is, an individual’s ZIP code of residence provides an indication of their income (and likely other socio-economic factors), but any geographic aggregate may smooth over potentially notable within-ZIP heterogeneity, muting measured differences.
Our real income measure tracks the experience of individuals over time, and incomes tend to rise as people age in excess of income growth rates observed in the overall workforce. An estimate from academic research suggests the life cycle component of growth is about one and a half percent per year for individuals at the average age of our sample. This suggests that the lowest income quartile experienced growth roughly in-line with gains expected due to aging—rising by approximately 6 percent from the end of 2019 to August-2023—while the other income quartiles fell short of this historical average6.
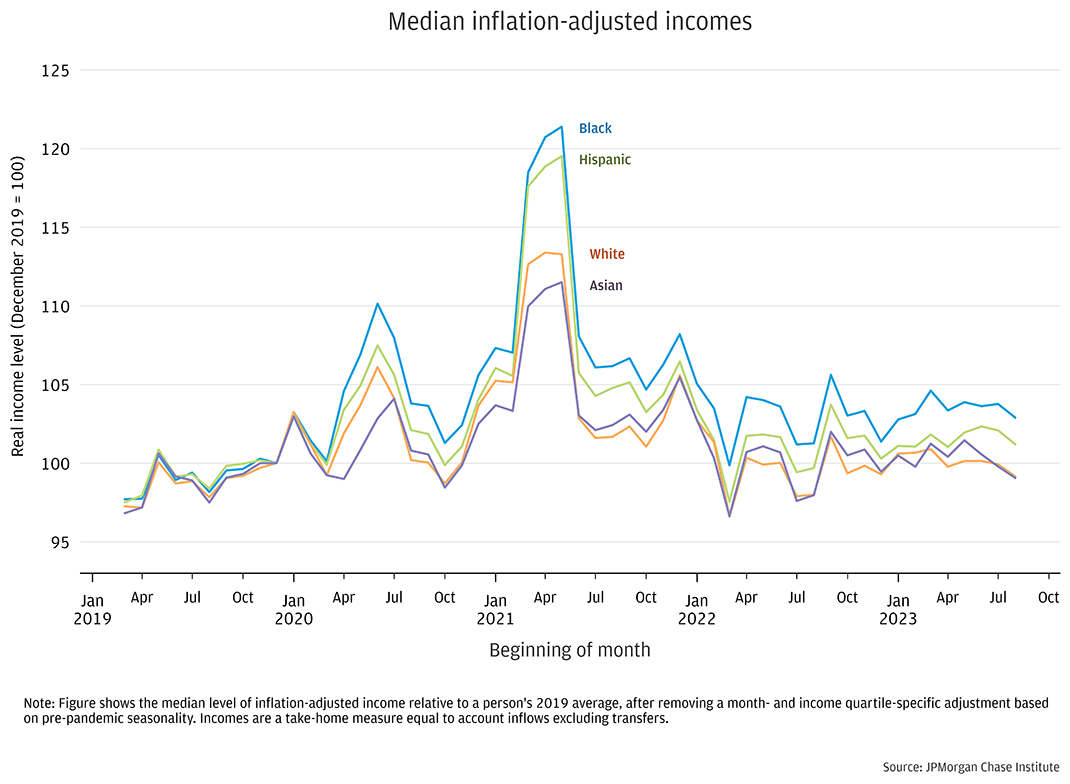
Figure 2 shows the same metrics of real income using our de-identified sample with race information, which covers 700,000 individuals7. Differences by race are directionally consistent with trends seen across income quartiles, considering gaps in median income by race in the U.S. population8. Black and Hispanic individuals have maintained marginal relative gains compared to White and Asian individuals, although these gains have not extended despite the continued tightness in the labor market9. As of August 2023, Black individuals had the highest median real income gains relative to late 2019 at a 3 percent increase, compared with a 1 percent decline for White and Asian individuals, while Hispanic individuals were in between with a 1 percent rise. Note, the sample for which we have race data has older average ages than the sample used in Figure 1—likely contributing to the lower overall growth seen in this group—and may not be representative of the broader populations10.
Figure 2: Black and Hispanic individuals have held on to marginal relative gains since 2019, directionally consistent with differences by income groups.
Despite high inflation, the purchasing power of workers’ current income has remained higher this year relative to 2019 across income quartiles in our overall sample, although growth has been tepid. Over this time frame, lower-income workers and Black and Hispanic workers fared relatively better than other groups, but these relative gains have not substantially increased over the past year, despite ongoing tightness in the labor market.
Looking at recent dynamics, real income growth has been roughly flat, with price increases approximately matching changes in nominal take-home pay over the past year across income and race groups. This is a disappointing outcome to observe in data tracking individual incomes over time, given the historic tendency for incomes to rise as people age even with no underlying growth in productivity.
Considering the context of a moderating rate of personal savings following the historic swings during the pandemic, real income dynamics provide a reasonable guide to consumer demand. The additional factor of an abnormal savings stockpile dissipates in relevance as individuals’ cash balances get closer to their usual levels11. For policymakers, like those at the Federal Reserve, concerned with bringing down inflation, a re-alignment of real spending with (lower) income growth brings potential benefits.
Tracking the paths of income gains by subpopulations as the labor market remains tight helps gauge potential redistributive side effects of sustaining historically low levels of unemployment, as cited by Federal Reserve policymakers and academic research12. Low-income, Black, and Hispanic workers have sustained part of the relative gains seen during the pandemic, which came in the context of noticeable progress closing gaps in the period of full employment from 2016 to 2019.
Autor, David, Dube, Arindrajit, and Annie McGrew. 2023. “The Unexpected Compression: Competition at Work in the Low Wage Labor Market.” NBER Working Paper no. 31010.
https://www.nber.org/papers/w31010
Greig, Fiona, and George Eckerd. 2022. “Racial Income Inequality Dynamics: Big Data Insights from 2013 through COVID-19.” JPMorgan Chase Institute.
https://www.jpmorganchase.com/institute/research/household-income-spending/racial-income-inequality-dynamics
Greig, Fiona, Wheat, Christopher, Eckerd, George, O’Brien, Melissa, and Shantanu Banerjee. 2021. “How Did the Distribution of Income Growth Change Alongside the Hot Pre-Pandemic Labor Market and Recent Fiscal Stimulus?” JPMorgan Chase Institute.
https://www.jpmorganchase.com/institute/research/household-income-spending/how-did-the-distribution-of-income-growth-change-alongside-the-hot-pre-pandemic-labor-market-and-recent-fiscal-stimulus
Guvenen, Fatih, Karahan, Fatih, Ozkan, Serda, and Jae Song. 2021. “What Do Data on Millions of U.S. Workers Reveal about Lifecycle Earnings Dynamics?” Econometrica 89(5): 2303-2339.
https://doi.org/10.3982/ECTA14603
Johnson, Noah. 2017. “A Comparison of PCE and CPI: Methodological Differences in U.S. Inflation Calculation and Their Implications”. Bureau of Labor Statistics.
https://www.bls.gov/osmr/research-papers/2017/st170010.htm
Okun, Arthur M. 1973. “Upward Mobility in a High-Pressure Economy”. Brookings Papers on Economic Activity 4(1): 207-262. https://www.brookings.edu/articles/upward-mobility-in-a-high-pressure-economy/
Wheat, Chris, Erica Deadman. 2023. “Household Pulse: Balances through March 2023.” JPMorgan Chase Institute. https://www.jpmorganchase.com/institute/research/household-income-spending/household-pulse-cash-balances-through-March-2023
Wheat, Chris, and George Eckerd. 2022. “The Purchasing Power of Household Incomes from 2019 to 2022.” JPMorgan Chase Institute. https://www.jpmorganchase.com/institute/research/household-income-spending/household-purchasing-power-2019-to-2022
Wheat, Chris, George Eckerd. 2023. “Household Cash Buffer Management from the Great Recession through COVID-19.” JPMorgan Chase Institute.
https://www.jpmorganchase.com/institute/research/household-income-and-spending/household-cash-buffer-management-from-the-great-recession-through-covid-19
“Have workers gotten a raise?” by Chloe N. East, Wendy Edelberg, Noadia Steinmetz-Silber, The Hamilton Project October 24, 2023
For example, the Bureau of Labor Statistics series for Average Hourly Earnings exhibited a notable spike early in the pandemic due to the reduction in lower-paid service occupations, which subsequently weighed on measured compensation growth as these sectors regained employment. Meanwhile, wage growth measures by demographic cuts based on Census data, like the Atlanta Fed Wage Growth Tracker, rely on smoothing over 12 months or more to mitigate noise, and require additional assumptions to string together year-over-year growth rates from rolling samples of 2,000 individuals to make multi-year income change comparisons.
We use a separate, earlier, sample to compute monthly seasonality trends to adjust the figures used in this report.
Specifically, we deflate take-home indexes using the All-Items CPI-U measure (FRED ticker: CPIAUSCL). In Wheat and Eckerd (2022), we deflated incomes using the PCE Index. While both inflation indicators have their strengths as estimates of price inflation, we choose CPI in this report as it maps to out-of-pocket expenses, which qualitatively aligns to our take-home-pay income construct. See Johnson (2017) for a discussion of the differences between the two measures.
The average age of our balanced sample is 42 in 2019. According to the life cycle earnings paths in academic research using Social Security Administration data, incomes rise by approximately 6 percent over the next four years, or one and a half percent per year, in excess of underlying economic growth. This estimate is based on Figure C36 Lifecycle Profile of Average Log Earnings from Guvenen, Karahan, et al. (2021). See also the box Comparing Individual-Based Growth Data to National Aggregates in Wheat and Eckerd (2022).
Self-identified demographic data was obtained in 2021 from a third party for the JPMorgan Chase Institute to conduct economic research examining financial outcomes by race, ethnicity, and gender. The demographic data was matched to internal banking records using encrypted quasi-identifiers. This de-identified file that contains banking records and demographics is only available to the JPMorgan Chase Institute.
Averaging Census Bureau data over 2013 to 2020, median incomes for Black, Hispanic, White, and Asian households were $42,210, $51,010, $71,100, and $87,550, respectively, in 2020 dollars. See Institute report: Racial Income Inequality Dynamics (May 2022).
As the labor market tightened prior to the pandemic Black and Hispanic workers’ incomes had been growing somewhat more quickly than White workers, described in Greig and Eckerd (2022).
See the box Our modeled race metric and Figure A4 in Wheat and Deadman (2023) for more detail on the Chase geographic footprint and its impact on our sample.
Wheat and Eckerd (2023) find that individuals’ spending tends to align with income as individuals approach earlier baselines for their cash balances relative to outflows (i.e., their “cash buffer”).
See, for example, then Fed Chair Janet Yellen’s October 2016 speech and Okun (1973).
We thank our research team, especially Guillaume Kasten-Sportes, Khushboo Chougule, Melissa O’Brien, and Edward Biggs for their contributions to the analysis. We also thank Kate Finnerty, Alfonso Zenteno, Robert Caldwell and Annabel Jouard for their support. We are indebted to our internal partners and colleagues, who support delivery of our agenda in a myriad of ways and acknowledge their contributions to each and all releases.
We would like to acknowledge Jamie Dimon, CEO of JPMorgan Chase & Co., for his vision and leadership in establishing the Institute and enabling the ongoing research agenda. We remain deeply grateful to Peter Scher, Vice Chairman, Tim Berry, Head of Corporate Responsibility, Heather Higginbottom, Head of Research, Policy & Insights, and others across the firm for the resources and support to pioneer a new approach to contribute to global economic analysis and insight.
This material is a product of JPMorgan Chase Institute and is provided to you solely for general information purposes. Unless otherwise specifically stated, any views or opinions expressed herein are solely those of the authors listed and may differ from the views and opinions expressed by J.P. Morgan Securities LLC (JPMS) Research Department or other departments or divisions of JPMorgan Chase & Co. or its affiliates. This material is not a product of the Research Department of JPMS. Information has been obtained from sources believed to be reliable, but JPMorgan Chase & Co. or its affiliates and/or subsidiaries (collectively J.P. Morgan) do not warrant its completeness or accuracy. Opinions and estimates constitute our judgment as of the date of this material and are subject to change without notice. No representation or warranty should be made with regard to any computations, graphs, tables, diagrams or commentary in this material, which is provided for illustration/reference purposes only. The data relied on for this report are based on past transactions and may not be indicative of future results. J.P. Morgan assumes no duty to update any information in this material in the event that such information changes. The opinion herein should not be construed as an individual recommendation for any particular client and is not intended as advice or recommendations of particular securities, financial instruments, or strategies for a particular client. This material does not constitute a solicitation or offer in any jurisdiction where such a solicitation is unlawful.
Wheat, Chris, George Eckerd. 2023. “The Purchasing Power of Household Incomes: Worker outcomes through August 2023 by income and race.” JPMorgan Chase Institute
https://www.jpmorganchase.com/insights/financial-health-wealth-creation/purchasing-power-of-household-incomes-august-2023
Authors

Chris Wheat
President, JPMorganChase Institute

George Eckerd
Wealth and Markets Research Director, JPMorganChase Institute